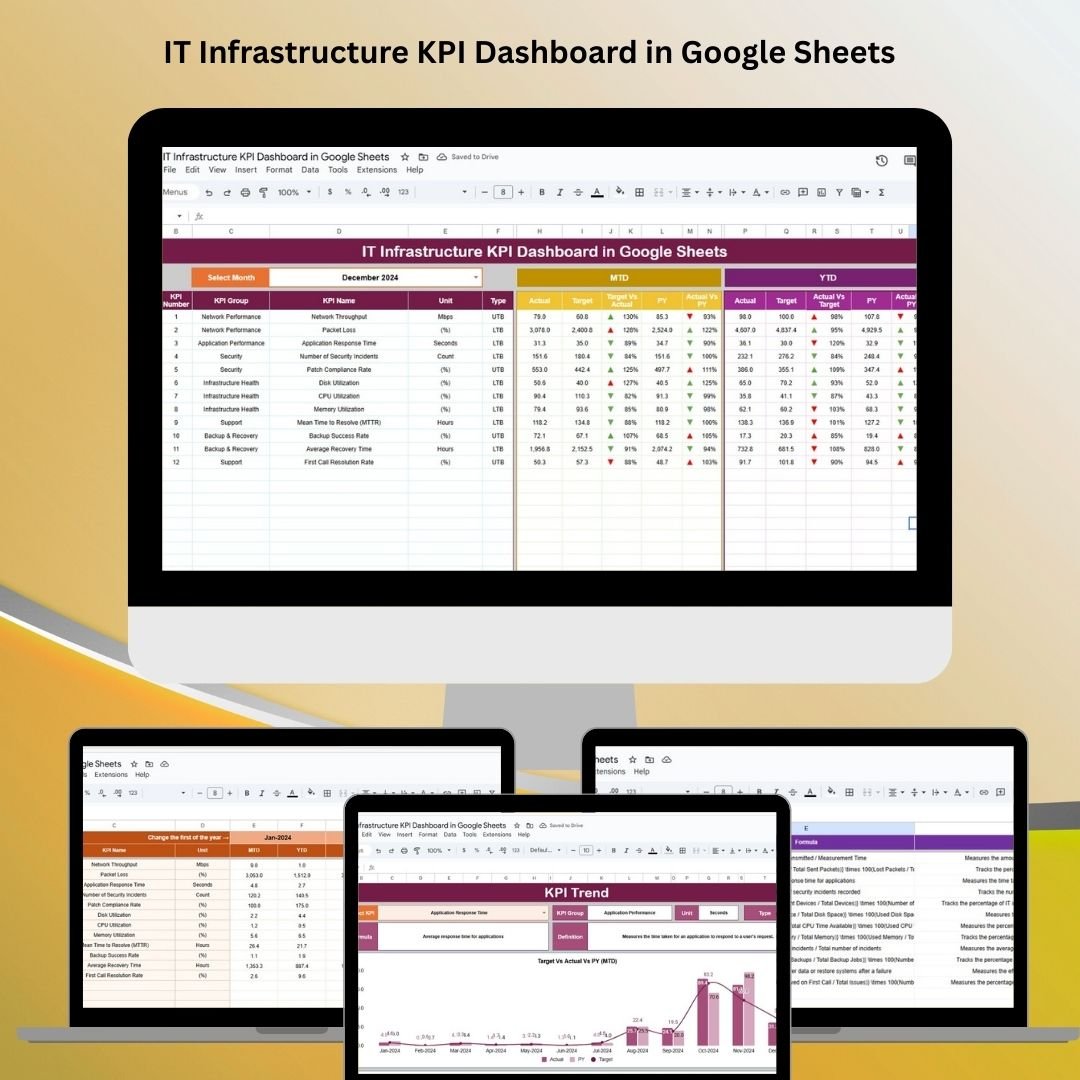
The IT Infrastructure KPI Dashboard in Google Sheets is a powerful, customizable tool that helps IT professionals track, monitor, and optimize the performance of key IT infrastructure metrics. Whether you manage a small business or a large corporation, this ready-to-use dashboard provides real-time insights into system health, uptime, response times, and more. It helps you quickly identify issues, assess performance trends, and make data-driven decisions for your organization’s IT operations.
📊 What’s Inside the IT Infrastructure KPI Dashboard 📊
The IT Infrastructure KPI Dashboard consists of six key worksheets that allow you to track essential KPIs related to your IT infrastructure’s performance:
-
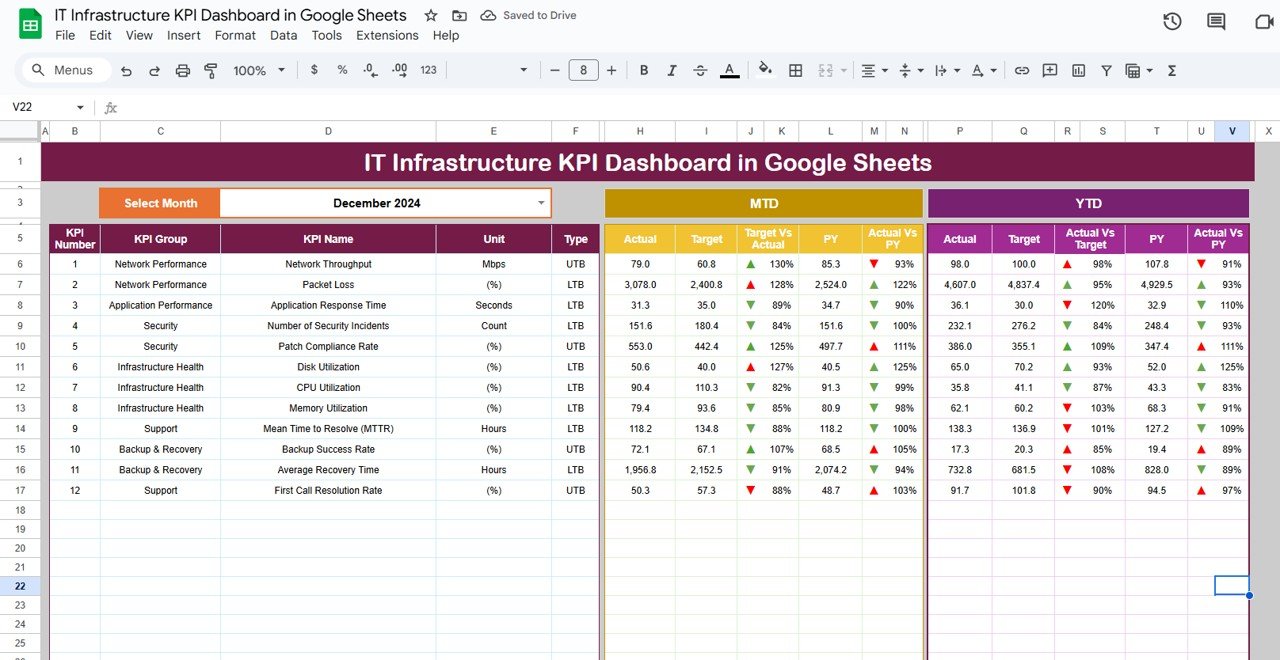
Dashboard Sheet Tab
-
Key Metrics Overview: The Dashboard Sheet displays all the critical KPIs in a visual format, offering an instant snapshot of your IT infrastructure’s health.
-
MTD (Month-to-Date) vs YTD (Year-to-Date): Compare actual performance with target and previous year data.
-
Performance Indicators: Track system uptime, response time, network latency, server performance, etc.
-
-
Comparative Analysis: Use conditional formatting to highlight KPIs that are underperforming, meeting targets, or exceeding expectations.
-
Month Dropdown (D3): Select the month for which you want to view updated data across all KPIs.
-
-
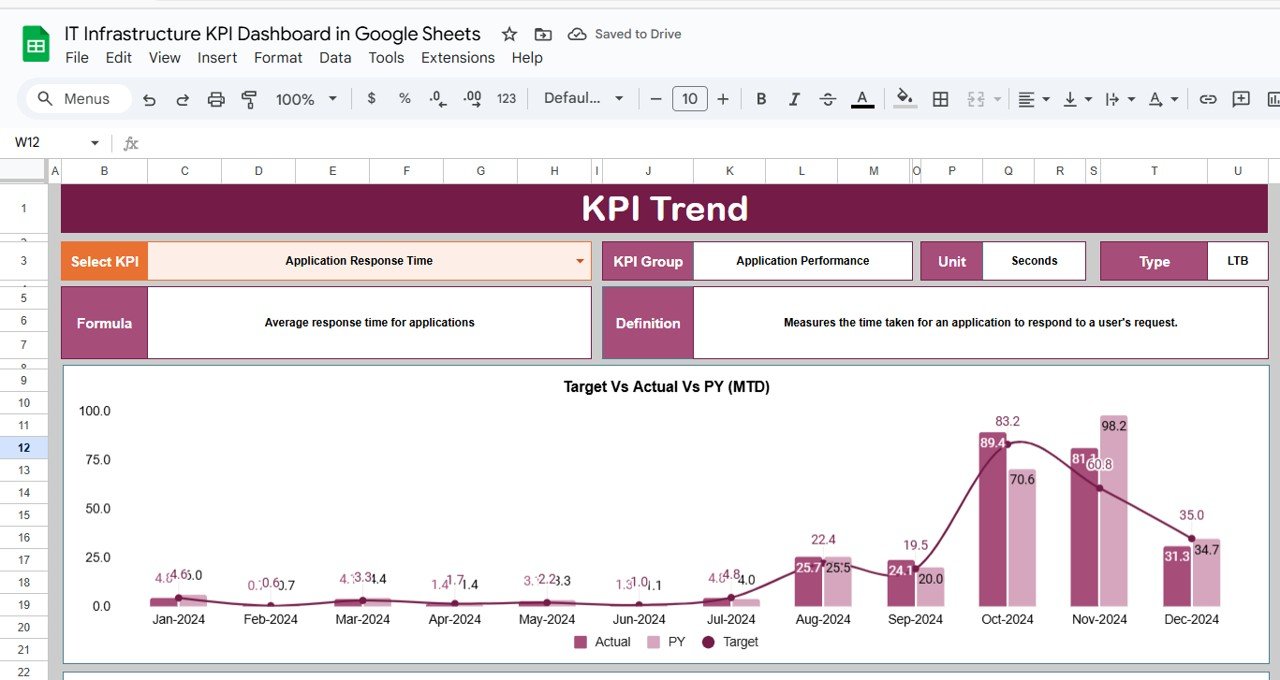
KPI Trend Sheet Tab
-
Trend Analysis: Track KPI performance over time with detailed trend lines.
-
KPI Insights: View each KPI’s unit of measurement, type (e.g., “Lower the Better” or “Upper the Better”), and formula used to calculate it.
-
KPI Selection: Choose any KPI from the dropdown in Range C3 to analyze its trend over the last several months.
-
-
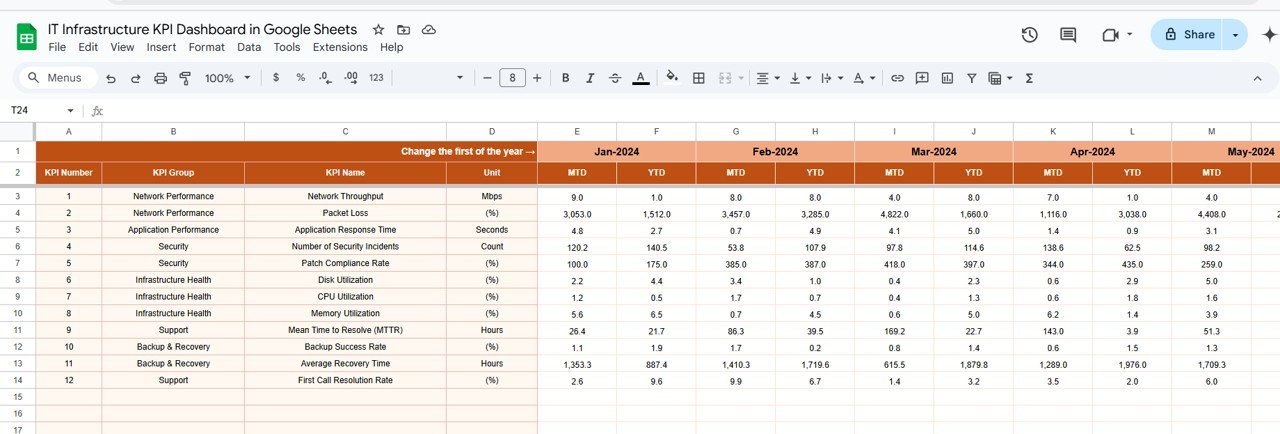
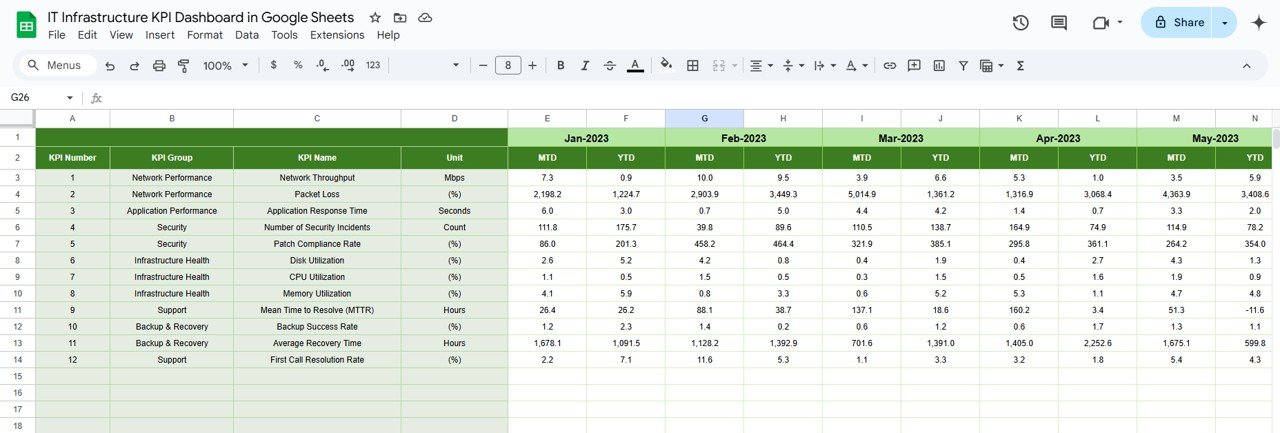
Actual Numbers Sheet Tab
-
Data Input: Enter actual performance data for MTD and YTD to update the dashboard in real-time.
-
Month Selection: Choose the starting month of the year, and the data will update across the dashboard for easy tracking.
-
-
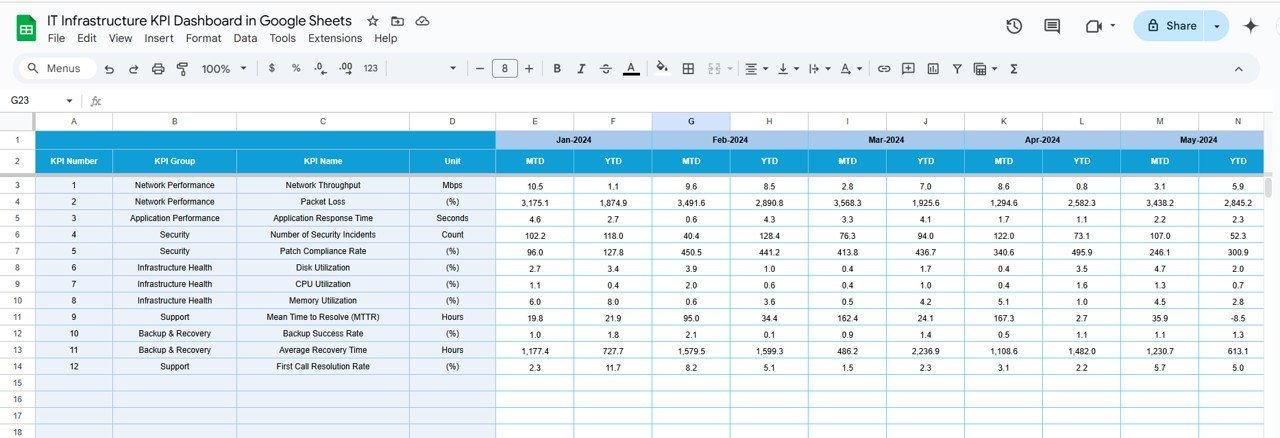
Target Sheet Tab
-
Set and Track Targets: Input target values for each KPI (both MTD and YTD) to compare against actual performance and evaluate progress.
-
Performance Monitoring: Quickly assess whether you’re meeting your IT goals.
-
-
Previous Year Numbers Sheet Tab
-
Historical Data: Track the previous year’s performance and use it for comparison against current year data, helping you identify trends and improvements.
-
-
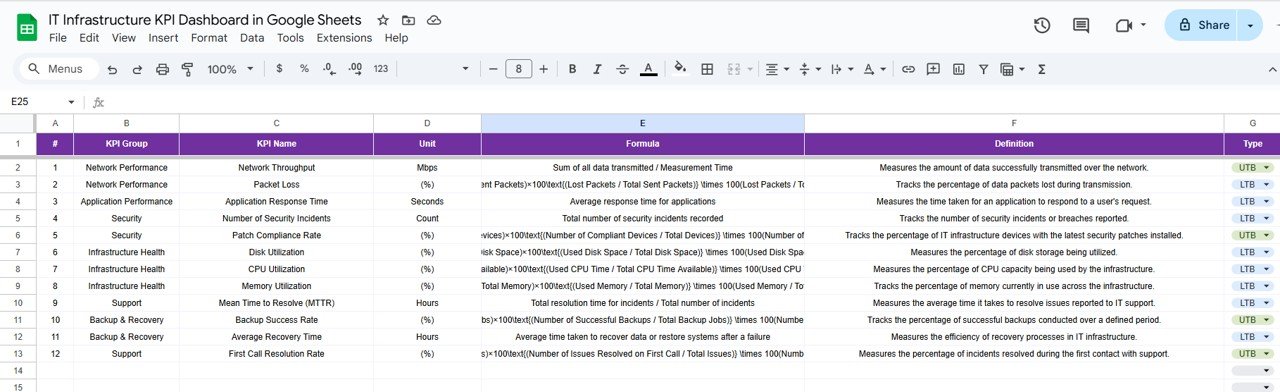
KPI Definition Sheet Tab
-
KPI Definitions: This sheet provides a comprehensive list of each KPI’s definition, group, unit, and formula to ensure clarity in your data analysis.
-
⚙️ How to Use the IT Infrastructure KPI Dashboard ⚙️
-
Input Actual Data: Enter your monthly performance data in the Actual Numbers Sheet to update the dashboard in real-time.
-
Set Targets: Input target values for each KPI in the Target Sheet to track whether you’re meeting your IT goals.
-
Track and Visualize: Use the Dashboard Sheet to monitor KPIs, track progress against targets, and view performance comparisons.
-
Analyze Trends: Use the KPI Trend Sheet to view historical performance and track the evolution of your IT infrastructure metrics.
-
Review and Adjust: Regularly update your data and use the Previous Year Numbers Sheet to evaluate the performance against last year’s data and identify opportunities for improvement.
🔧 Who Can Benefit from This IT Infrastructure KPI Dashboard 🔧
-
IT Managers: Track system performance, ensure uptime, and optimize infrastructure for improved efficiency.
-
Network Engineers: Monitor network latency, traffic, and response times to maintain smooth operations.
-
System Administrators: Use this dashboard to ensure server performance, uptime, and capacity utilization meet expectations.
-
CIOs and CTOs: Gain high-level insights into IT infrastructure health to make data-driven decisions.
-
Business Analysts: Analyze trends in IT performance to predict potential bottlenecks and recommend corrective actions.
🌟 Benefits of Using the IT Infrastructure KPI Dashboard 🌟
-
Real-Time Monitoring: Track KPIs in real-time to identify performance bottlenecks and fix issues quickly.
-
Data-Driven Decision Making: Make informed decisions based on accurate, up-to-date data about your IT systems.
-
Improved Reporting: Automate the process of tracking performance metrics, saving time on manual data entry and reducing errors.
-
Enhanced Team Collaboration: Google Sheets allows for easy collaboration among team members, so everyone stays aligned on performance goals.
-
Comprehensive KPI Tracking: Monitor all key metrics in one centralized dashboard for a comprehensive view of your IT infrastructure.
-
Customizable: Tailor the dashboard to meet your organization’s unique IT needs by adding or removing KPIs as required.
Click here to read the detailed blog post
Watch the step-by-step video Demo:


Reviews
There are no reviews yet.