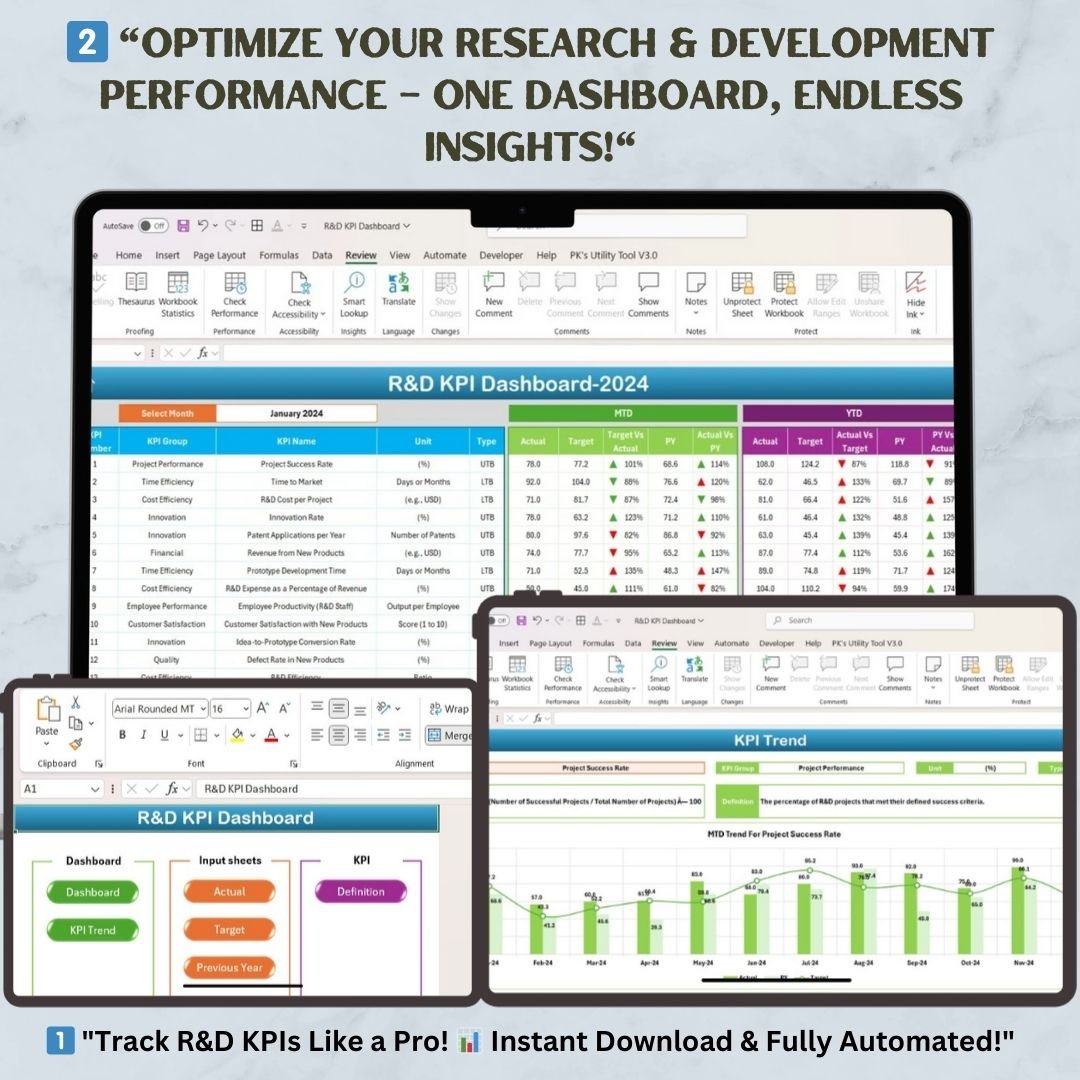
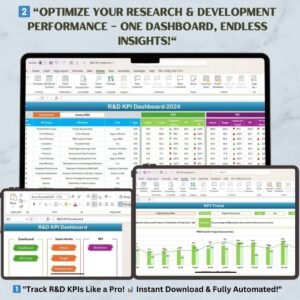
Maximize your research and development (R&D) efficiency with this fully automated and interactive KPI dashboard in Excel. Designed for R&D KPI Dashboard managers, analysts, and executives, this tool helps track critical innovation, project performance, and financial KPIs in one place.
With dynamic trend analysis, real-time data input, and goal tracking, this dashboard enables data-driven decision-making, helping you streamline R&D processes and enhance innovation outcomes.
🌟 Key Features of the R&D KPI Dashboard
🚀 Home Sheet – Centralized Navigation
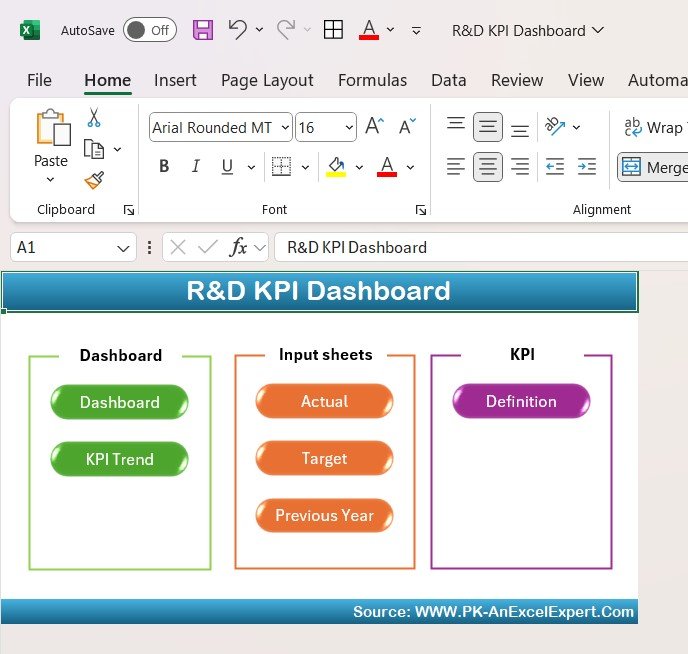
✔ User-Friendly Interface – Acts as an index page with easy navigation buttons.
✔ Quick Access – Jump to key sections like the Dashboard, KPI Trend, Target Sheet, and Definition Sheet effortlessly.
✔ Structured Workflow – Ensures smooth movement across different data entry and visualization sheets.
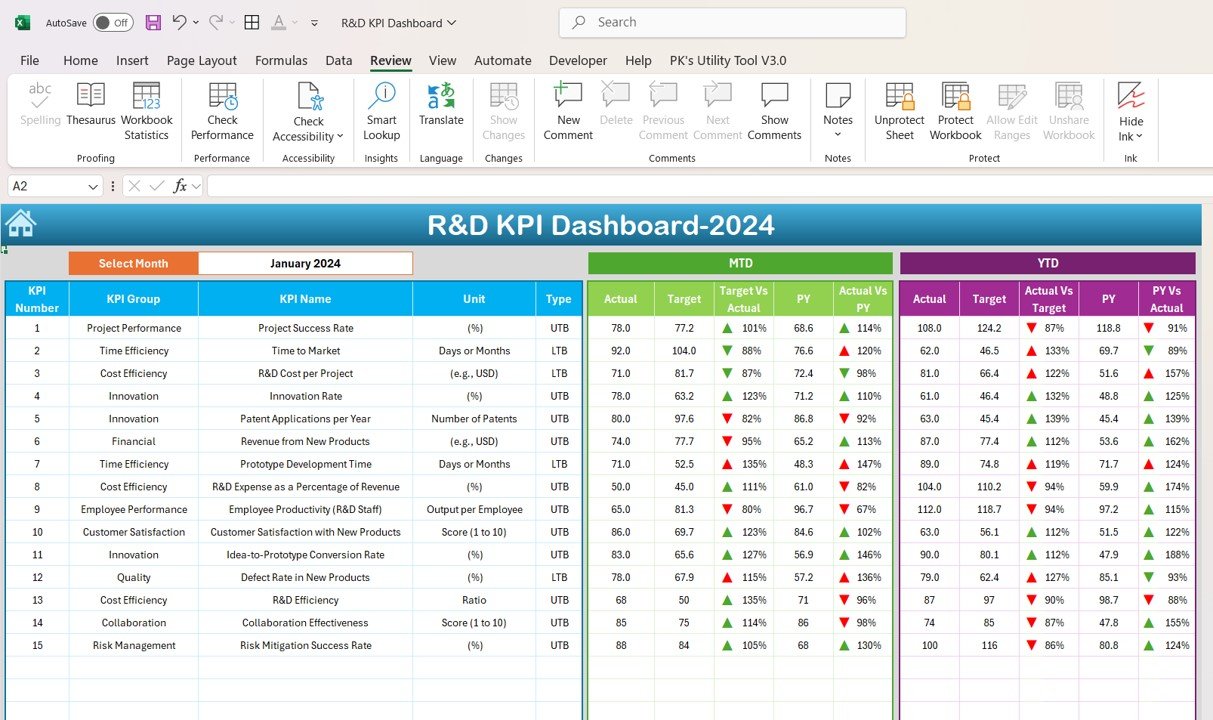
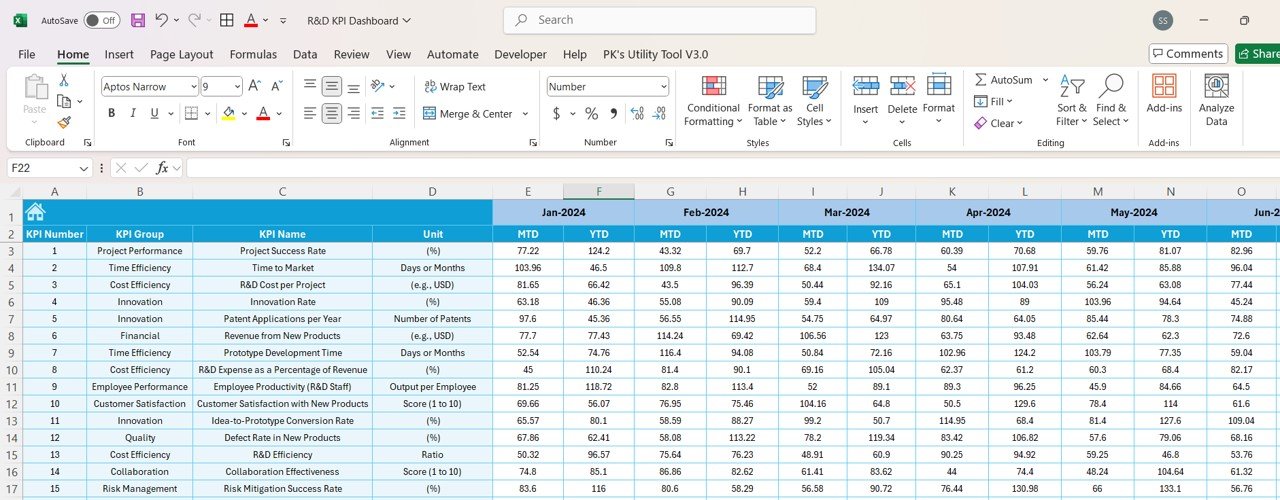
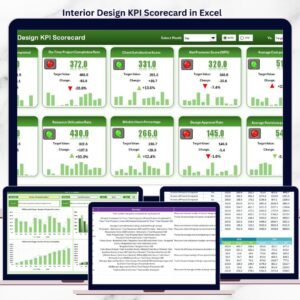
📊 R&D KPI Dashboard – Real-Time Performance Monitoring
✔ Comprehensive View of Key R&D Metrics – Monitor 15+ essential KPIs related to R&D efficiency, cost, innovation, and success rates.
✔ Dynamic KPI Tracking – Select a month from the dropdown menu, and the dashboard automatically updates.
✔ MTD & YTD Analysis – Displays Month-to-Date (MTD) and Year-to-Date (YTD) data for:
- Actual vs. Target Performance
- Current Year vs. Previous Year Comparisons
✔ Visual Performance Indicators – Uses color-coded formatting and trend arrows to highlight areas for improvement.
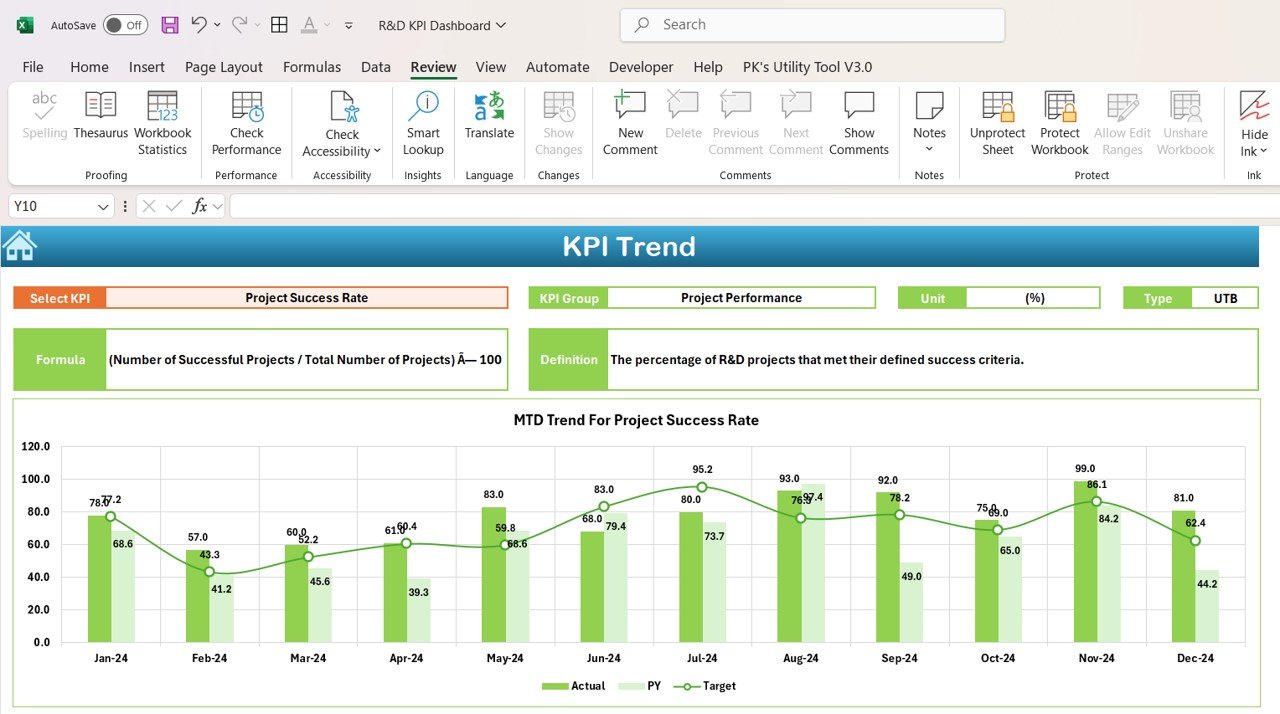
📈 KPI Trend Sheet – Identify Patterns & Trends
✔ Historical Trend Analysis – Track R&D performance across multiple months for trend identification.
✔ Formula & Definition for Each KPI – Understand how each metric is calculated.
✔ Custom KPI Selection – Choose specific KPIs and analyze trends over time.
✔ Clear Data Visualization – View MTD & YTD trends through interactive charts.
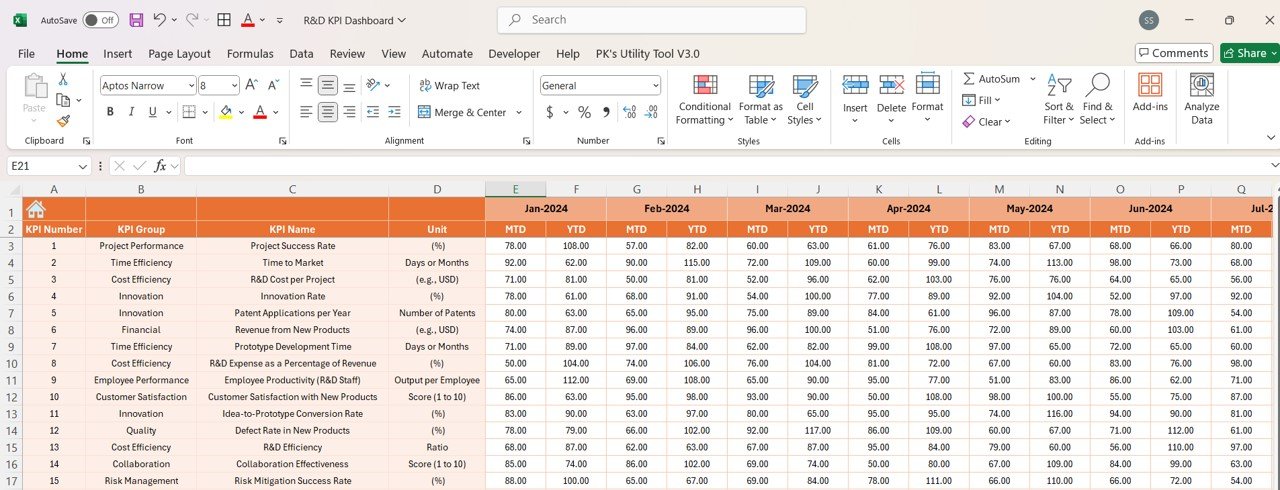
📥 Actual Numbers Input Sheet – Data Accuracy in Your Hands
✔ Manually Enter Real-Time Data – Update actual values for each KPI in the designated input fields.
✔ Automatic Dashboard Updates – Changes reflect instantly on the main dashboard.
✔ Error-Free Data Handling – Ensures accuracy and consistency in R&D performance tracking.
🎯 Target Sheet – Set & Measure Goals
✔ Define Monthly & Yearly Targets – Establish performance benchmarks for each KPI.
✔ Track Progress – Compare actual results vs. target goals to measure efficiency.
✔ Customizable KPI Benchmarks – Modify targets as per changing R&D priorities.
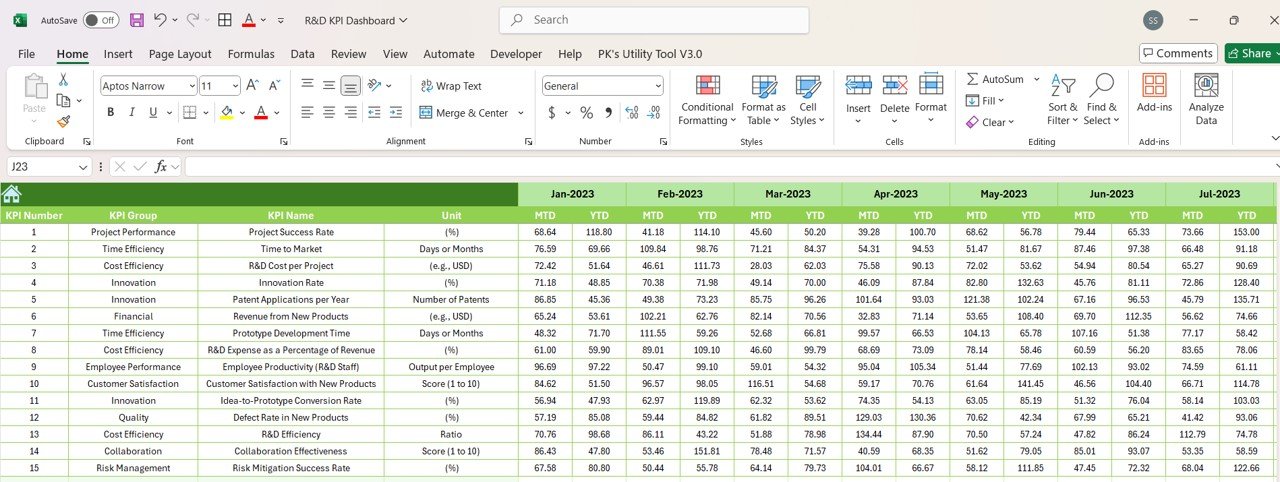
📊 Previous Year Data Sheet – Track Year-on-Year Improvements
✔ Compare Historical Performance – Store last year’s data in the same format as the current year.
✔ Identify Growth Areas – Helps in long-term strategy planning based on past performance.
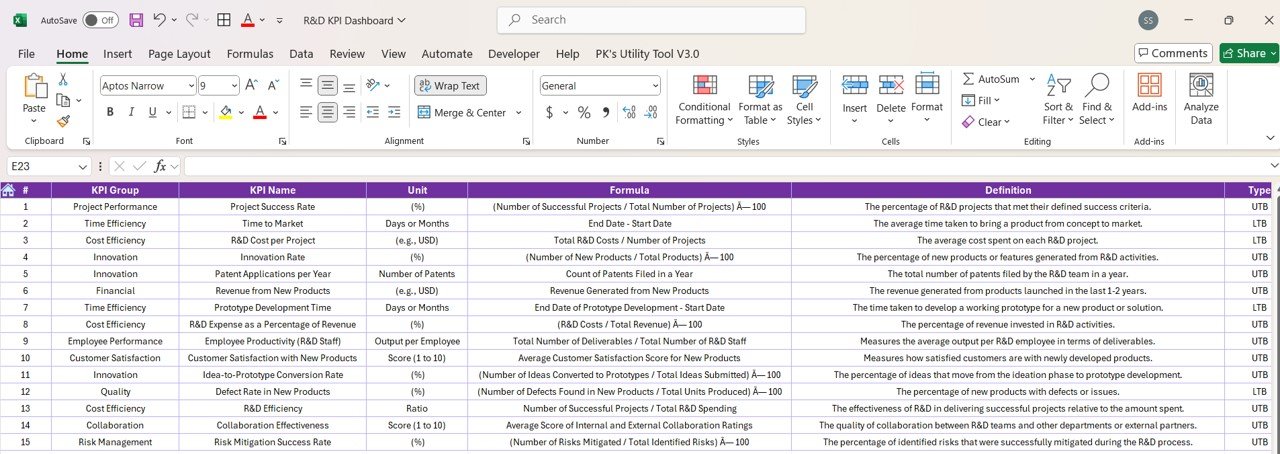
📖 KPI Definition Sheet – Clear Understanding of KPIs
✔ Comprehensive KPI Glossary – Stores all key KPI names, definitions, formulas, and units.
✔ Easy Reference for R&D Teams – Ensures alignment across departments for consistent KPI tracking.
✔ Eliminates Confusion – Helps users understand the purpose and calculation of each metric.
📌 Why Choose This R&D KPI Dashboard?
✅ Instant Access & Download – Ready-to-use Excel file, no additional software needed!
✅ Customizable & Scalable – Modify KPI metrics and targets based on your company’s R&D goals.
✅ Professional-Quality Reporting – Generate automated reports for presentations & strategy meetings.
✅ Timesaving & Efficient – Eliminates manual calculations, reducing data errors and increasing productivity.
🎯 Who Can Benefit from This Dashboard?
✔ R&D Managers & Directors – Optimize research performance & drive innovation.
✔ Product Development Teams – Track project timelines & success rates.
✔ Finance & Cost Analysts – Monitor R&D expenditures & efficiency.
✔ Innovation Leaders – Measure patent applications, new product revenue, and idea conversion rates.
✔ Executives & Decision Makers – Make data-driven R&D investment decisions.
Click hare to read the Detailed blog post
Visit our YouTube channel to learn step-by-step video tutorials


Reviews
There are no reviews yet.