

Managing Port Contract Management Dashboard in Excel is a high-risk and high-value responsibility. Port contracts involve long durations, large financial commitments, multiple vendors, strict timelines, and ongoing operational exposure. Port authorities, logistics companies, and infrastructure operators must constantly monitor contract performance to avoid cost overruns, renewal delays, and profitability losses. However, when contract data is scattered across Excel files, emails, and manual reports, visibility decreases and decision-making becomes reactive.Port Contract Management Dashboard in Excel
That is exactly where the Port Contract Management Dashboard in Excel becomes a powerful and practical solution.
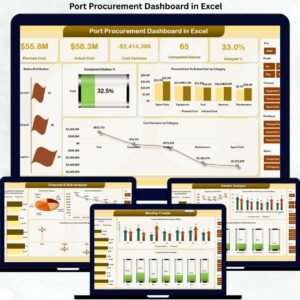
This ready-to-use Excel dashboard consolidates contract performance, financial metrics, vendor efficiency, and trend analysis into one centralized and interactive reporting system. Instead of manually tracking contracts across multiple files, managers gain a single source of truth that highlights contract status, revenue, cost, profit, and risk. Because the dashboard is built entirely in Excel, it delivers advanced analytics without expensive BI tools or complex setup.
✨ Key Features of the Port Contract Management Dashboard in Excel
📊 1. Executive-Level Contract Visibility
Get an instant overview of total contracts, contract value, actual cost, revenue, and profit using clear KPI cards designed for fast decision-making.
💰 2. Financial Performance Monitoring
Track actual cost vs revenue and profit trends to maintain strong financial control across all port contracts.
🏗️ 3. Vendor & Contractor Performance Insights
Analyze vendor reliability, revenue contribution, engagement level, and performance scores to improve contract outcomes.
📅 4. Monthly Trend & Risk Tracking
Monitor contract lifecycle changes, performance scores, and financial movement over time to identify risks early.
🧩 5. Fully Customizable Excel Model
Add new ports, vendors, contract types, KPIs, or metrics easily based on your operational needs.
📦 What’s Inside the Port Contract Management Dashboard in Excel
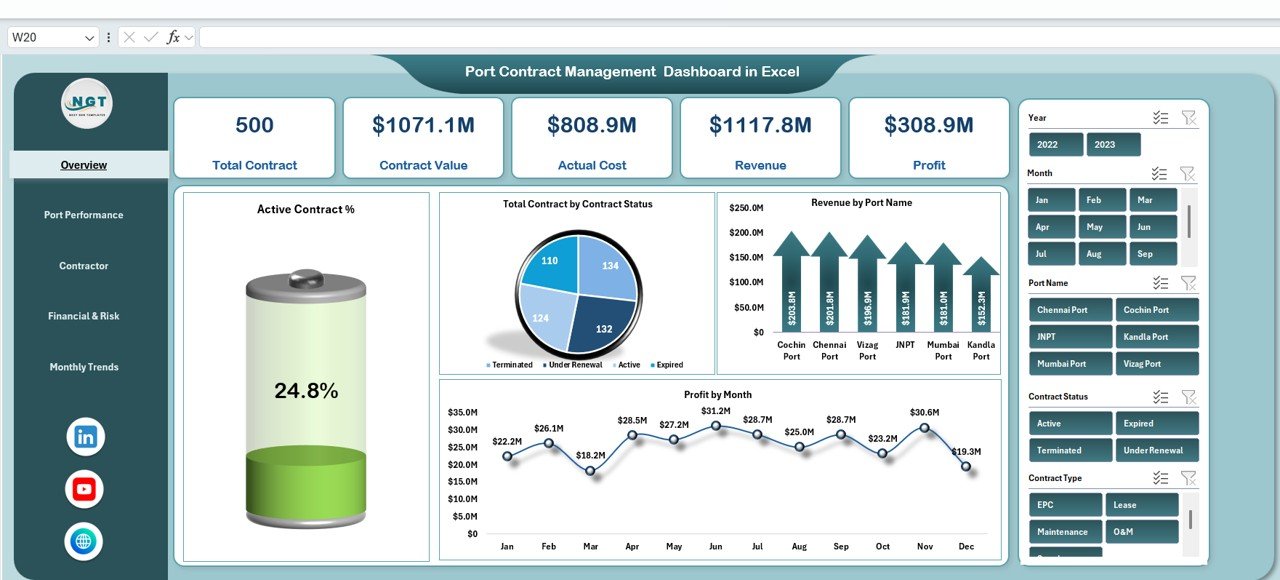
🖥️ Overview Sheet Tab – Executive Summary
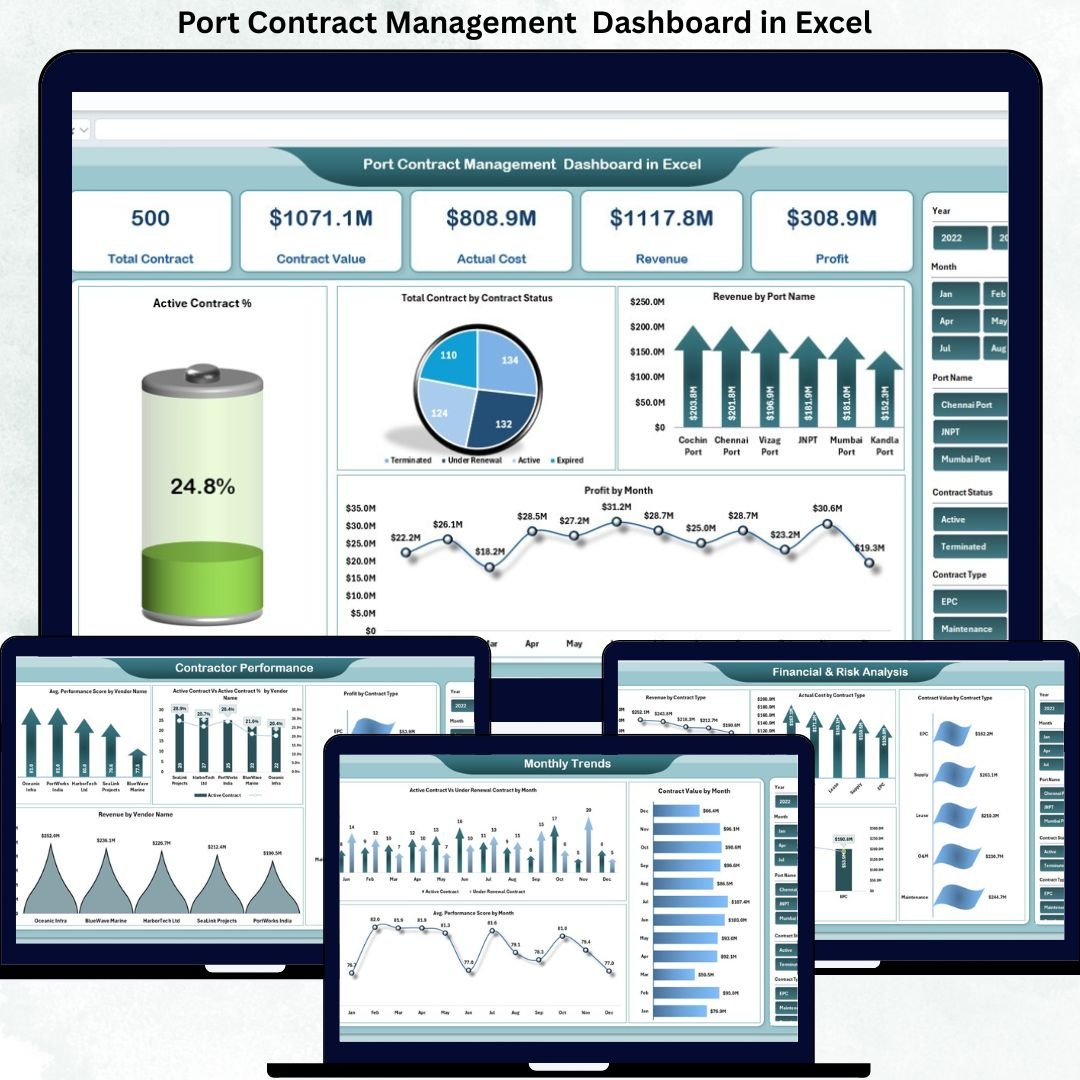
The Overview sheet acts as the control center of the dashboard and delivers instant clarity on overall contract health.
KPI Cards Included
Total Contract – Number of active and managed contracts
Contract Value – Total contract value (USD)
Actual Cost – Cost incurred to date
Revenue – Revenue generated from port contracts
Profit – Net profit earned
Charts on the Overview Sheet
Active Contract % – Measures contract activity level
Total Contract by Contract Status – Active, Closed, Under Renewal, Completed
Revenue by Port Name – Compares port-wise revenue contribution
Profit by Month – Tracks monthly profitability trends
These visuals help leadership assess contract performance within seconds.
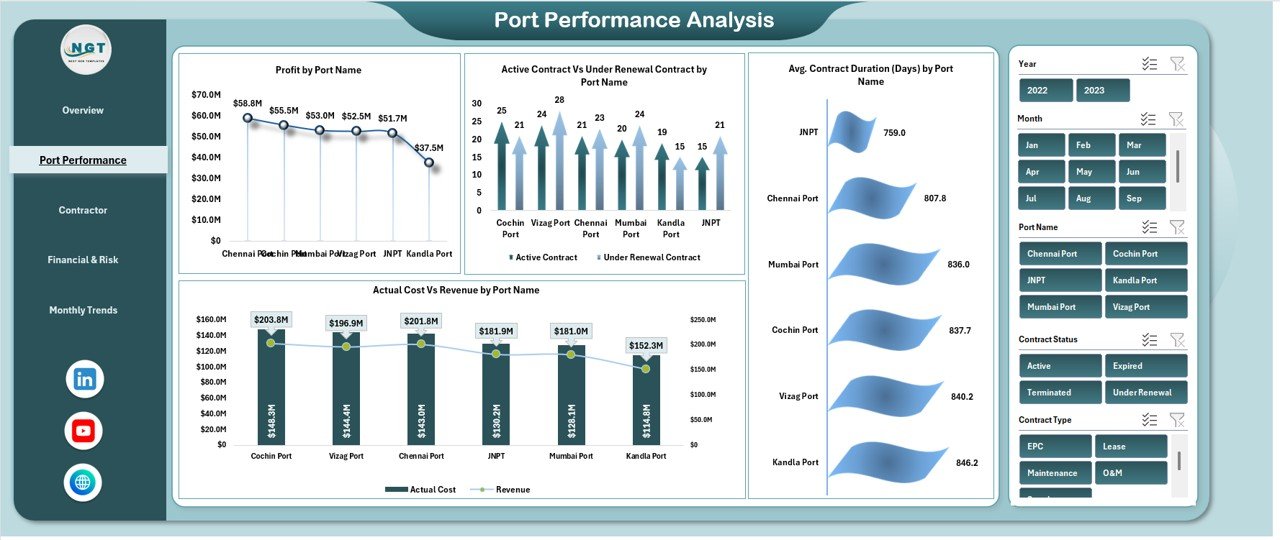
⚓ Port Performance Analysis
This section evaluates port-wise contract efficiency and profitability.
Charts Included
Profit by Port Name – Identifies high- and low-performing ports
Active Contract vs Under Renewal Contract by Port Name – Highlights renewal risks
Average Contract Duration (Days) by Port Name – Measures operational efficiency
Actual Cost vs Revenue by Port Name – Reveals cost effectiveness
This analysis helps management prioritize ports that deliver stronger financial outcomes.
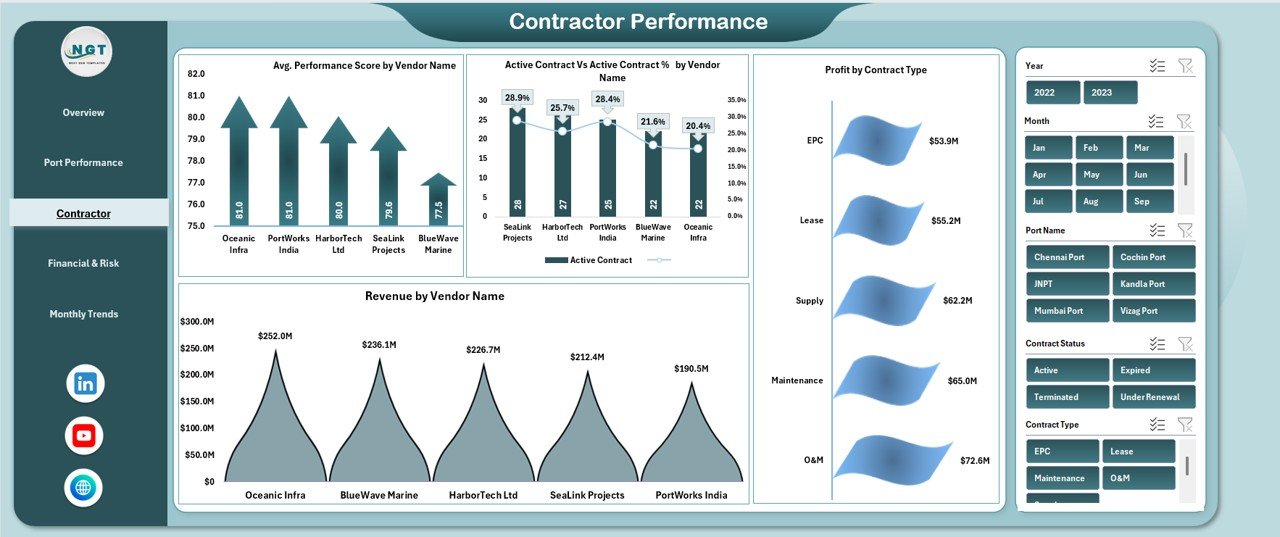
🏗️ Contractor Performance Analysis
Contractors directly influence execution quality and profitability.
Charts Included
Average Performance Score by Vendor Name – Measures service reliability
Active Contract vs Active Contract % by Vendor Name – Shows engagement levels
Profit by Contract Type – Analyzes margin performance
Revenue by Vendor Name – Identifies top-performing vendors
These insights support data-driven vendor selection and renewal decisions.
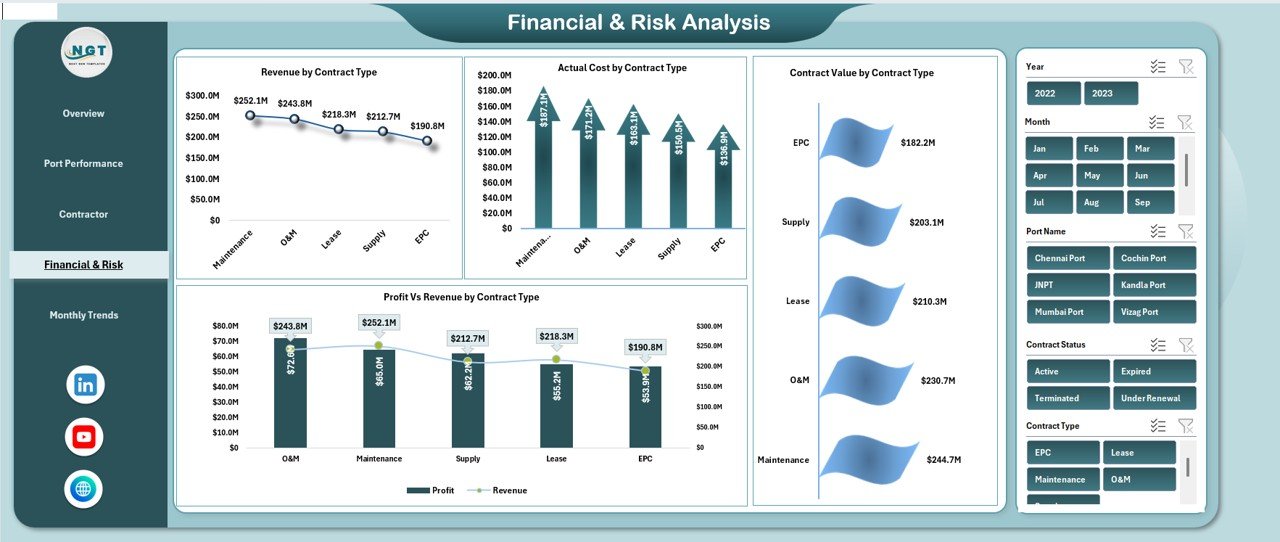
💰 Financial & Risk Analysis
This section focuses on financial exposure and risk management.
Charts Included
Revenue by Contract Type
Actual Cost by Contract Type
Contract Value by Contract Type
Profit vs Revenue by Contract Type
It helps teams identify high-risk, low-margin contract categories and improve budgeting accuracy.
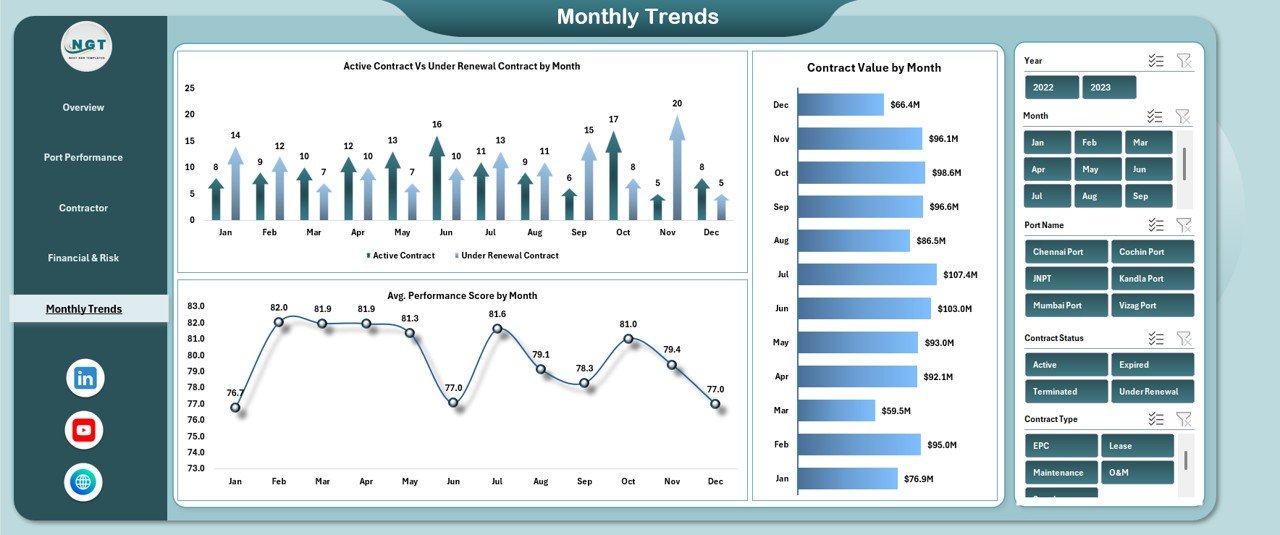
📅 Monthly Trends Analysis
Contracts evolve continuously, and trend analysis is essential.
Charts Included
Active Contract vs Under Renewal Contract by Month
Contract Value by Month
Average Performance Score by Month
These trends support proactive planning and risk mitigation.
🎯 Who Can Benefit from This Port Contract Management Dashboard in Excel
⚓ Port Authorities – Maintain control over contract performance and risk
🚚 Logistics & Shipping Companies – Track financial and vendor outcomes
🏗️ Infrastructure Operators – Improve contract execution and renewal planning
📊 Finance & Contract Teams – Monitor cost, revenue, and profit clearly
💼 Senior Leadership – Make faster, data-backed decisions
### Click here to read the Detailed blog post
Watch the step-by-step video tutorial:


























Reviews
There are no reviews yet.