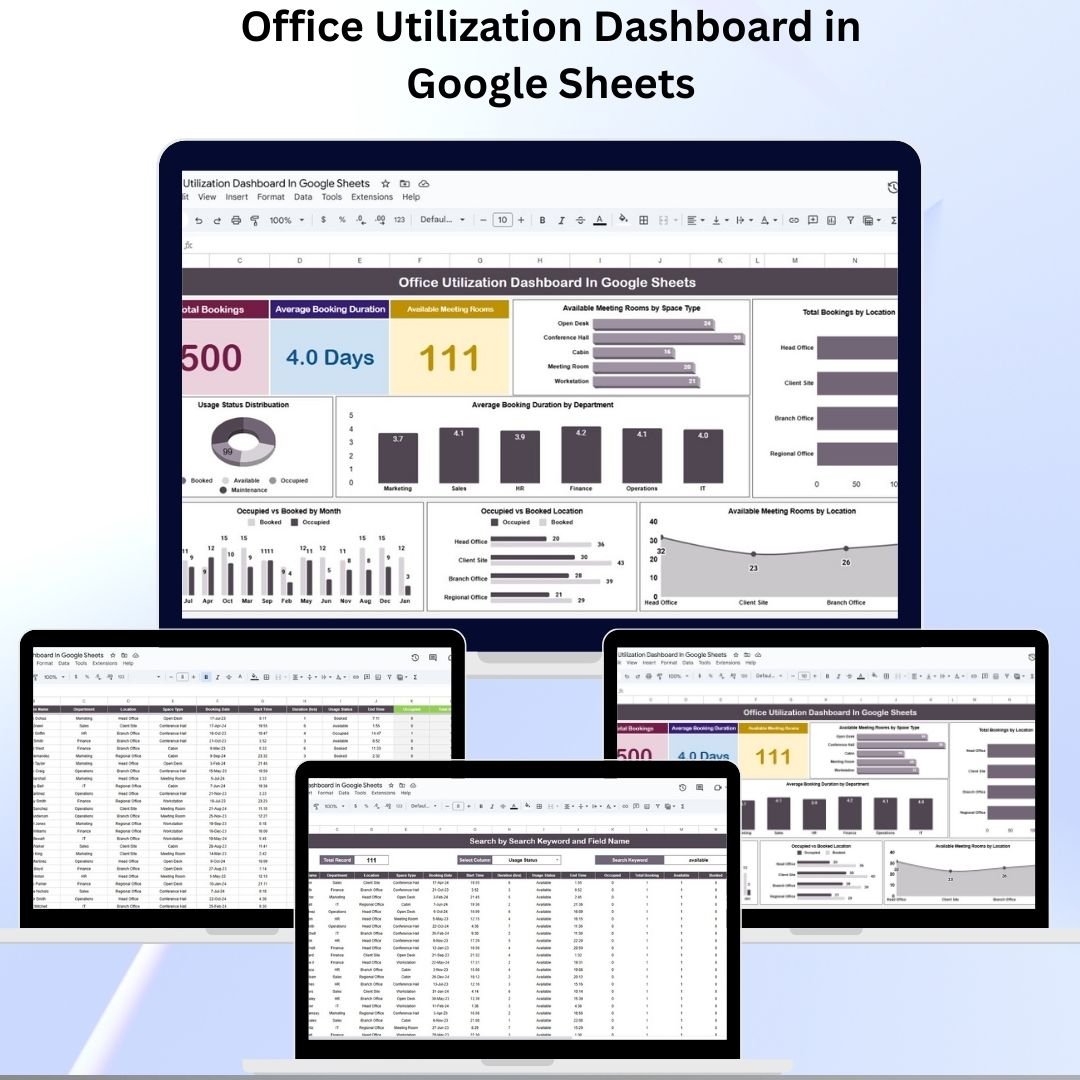
In today’s hybrid work environment, efficient office space management has become essential. With meeting rooms, desks, and collaborative spaces in high demand, organizations need a smart system to track usage, identify bottlenecks, and improve resource allocation.
The Office Utilization Dashboard in Google Sheets is a ready-to-use, interactive solution that enables managers, office administrators, and team leaders to monitor bookings, analyze space usage, and optimize workplace efficiency—without expensive software or complicated tools.
Built with simplicity and power in mind, this tool transforms raw booking data into clear, actionable insights for effective decision-making.
⭐ Key Features of the Office Utilization Dashboard
1. Dashboard Sheet Tab 📊
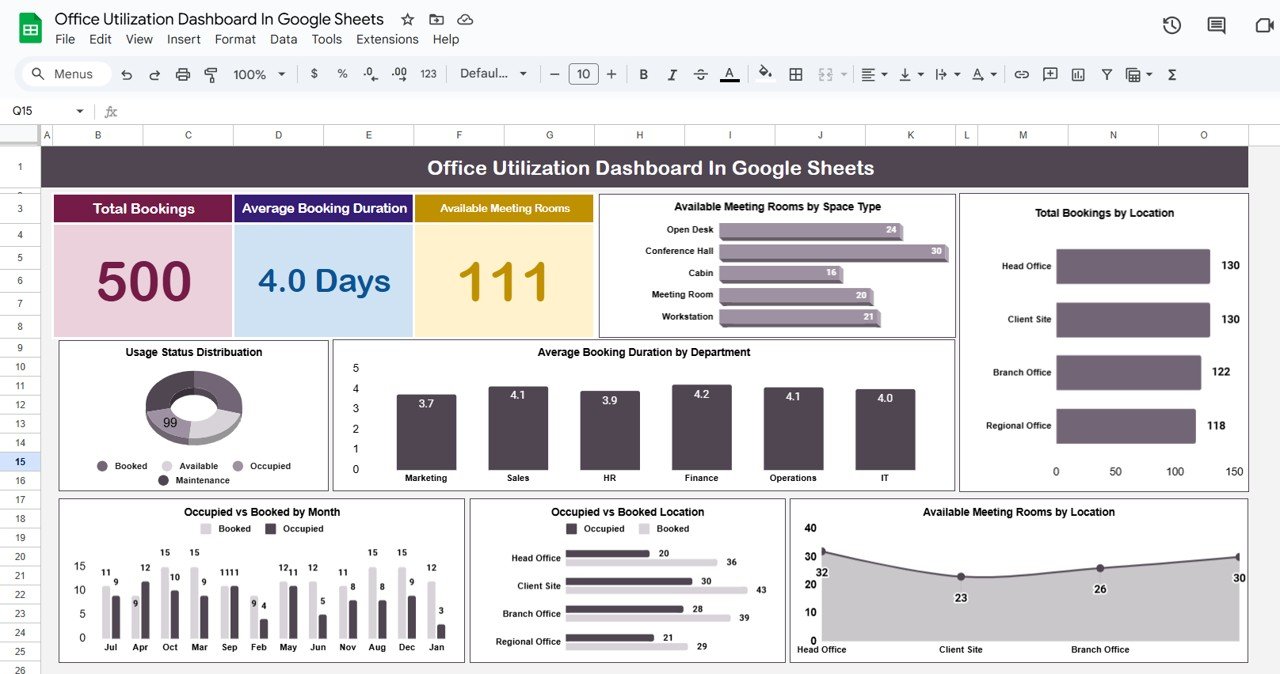
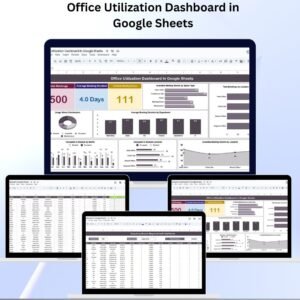
The Dashboard Sheet provides an at-a-glance summary of office utilization through cards and charts:
Cards Include:
-
Total Bookings – Overall number of bookings logged
-
Average Booking Duration – Mean time spent per booking
-
Available Meeting Rooms – Current availability of office spaces
Charts Include:
-
Available Rooms by Space Type
-
Total Bookings by Location
-
Usage Status Distribution (Booked, Occupied, Available)
-
Avg. Booking Duration by Department
-
Room Availability by Location
-
Occupied vs Booked by Location
-
Occupied vs Booked by Month
This gives instant insights into how spaces are being used and which areas are underutilized.
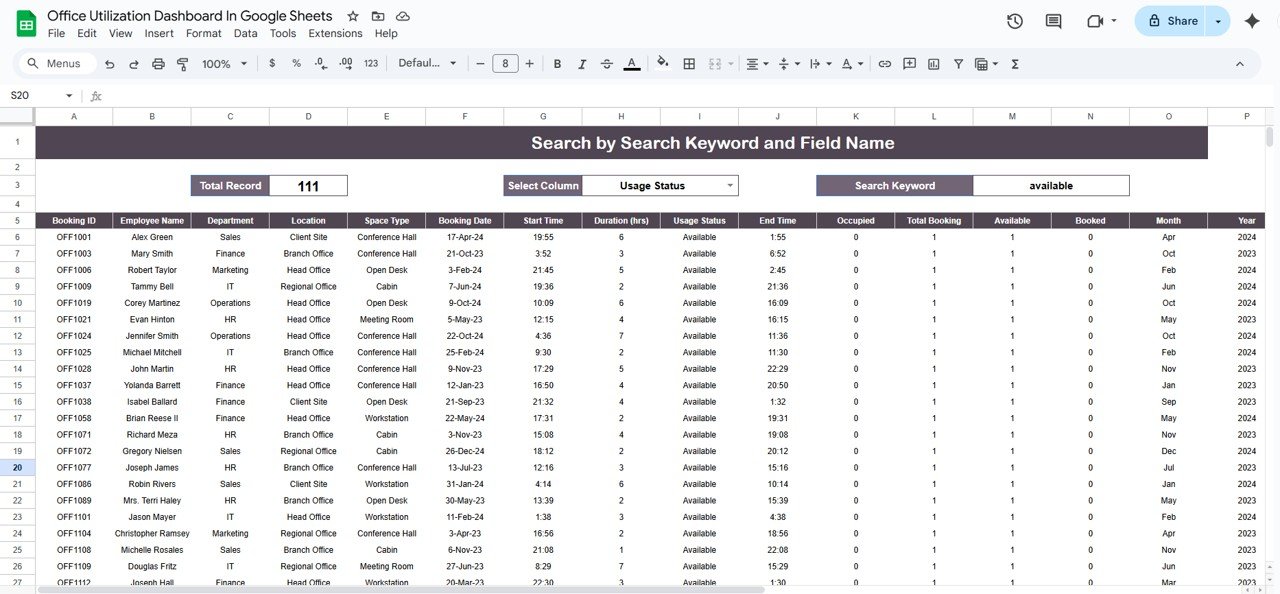
2. Search Sheet Tab 🔍
The Search Sheet helps users filter bookings with ease.
-
Search by Keyword & Field Name – Filter by department, employee, usage status, or location.
-
Dynamic Record Count – Instantly shows total results matching your search.
Example: Quickly find available spaces for Finance, or identify which rooms are most often booked.
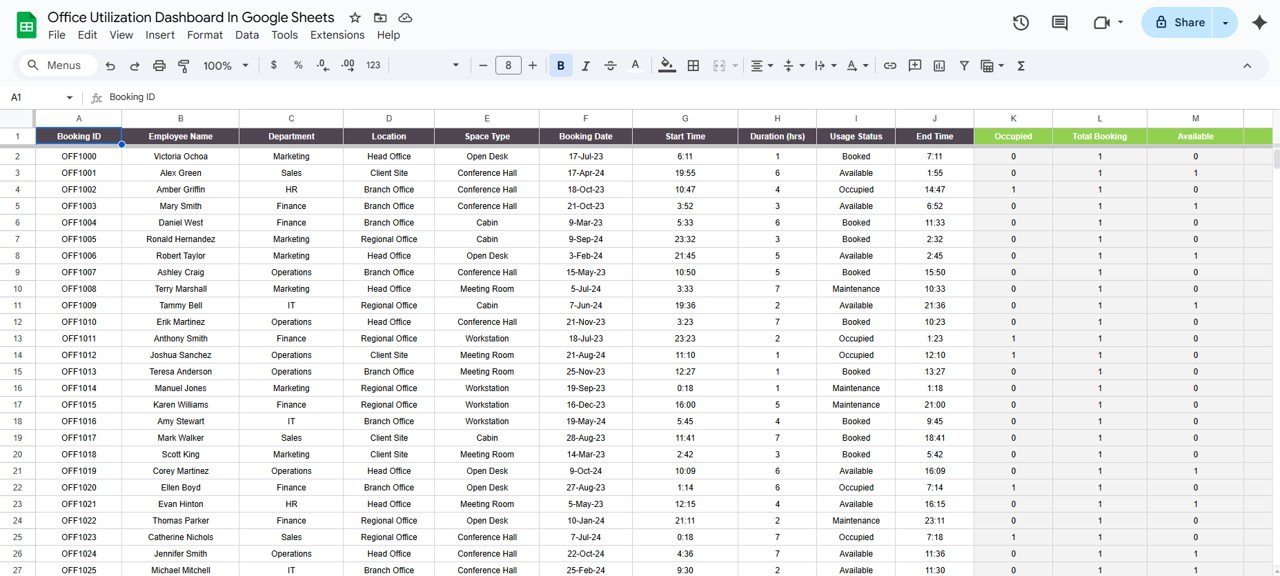
3. Data Sheet Tab 📑
The Data Sheet acts as the centralized database for all bookings.
Captured Fields:
-
Booking ID
-
Employee Name
-
Department
-
Location
-
Space Type (Conference Room, Open Desk, etc.)
-
Booking Date & Time
-
Duration (hrs)
-
Usage Status (Available, Booked, Occupied)
-
Occupied / Total Bookings
-
Month & Year
All charts and dashboard metrics update automatically from this sheet, ensuring accuracy and real-time analysis.
💡 Advantages of Using the Office Utilization Dashboard
-
📈 Real-Time Insights – Understand occupancy instantly.
-
🏢 Better Space Management – Spot underutilized areas and reassign resources.
-
🗂 Department-Level Tracking – Ensure fair allocation of spaces across teams.
-
📊 Trend Analysis – Monitor usage by month and location.
-
✅ Ease of Use – No advanced skills required; powered entirely by Google Sheets.
🚀 Opportunities for Improvement
-
🔗 Integrate with Google Calendar / Outlook for live booking sync.
-
🎨 Add conditional formatting to highlight high-demand rooms.
-
🔐 Enable role-based access for controlled editing.
-
🧑🤝🧑 Track employee utilization rates for hybrid models.
-
⏰ Add alerts for expiring or unconfirmed bookings.
📝 Best Practices
-
Update Data Regularly → Keep the Data Sheet current for accuracy.
-
Filter by Department → Give department heads their own usage view.
-
Use Monthly & Annual Views → Plan resources based on long-term patterns.
-
Monitor Peak Hours → Adjust allocations for busiest times.
-
Always Backup → Maintain a copy of the file to prevent data loss.
✅ Conclusion
The Office Utilization Dashboard in Google Sheets is the ultimate solution for tracking and managing office space effectively. By providing real-time visibility into bookings, usage trends, and availability, it empowers organizations to optimize resources, cut costs, and enhance employee satisfaction.
Whether you manage a single office or multiple locations, this dashboard ensures workspace efficiency at your fingertips.
📌 Click here to read the Detailed Blog Post
Watch the step-by-step video Demo:


Reviews
There are no reviews yet.