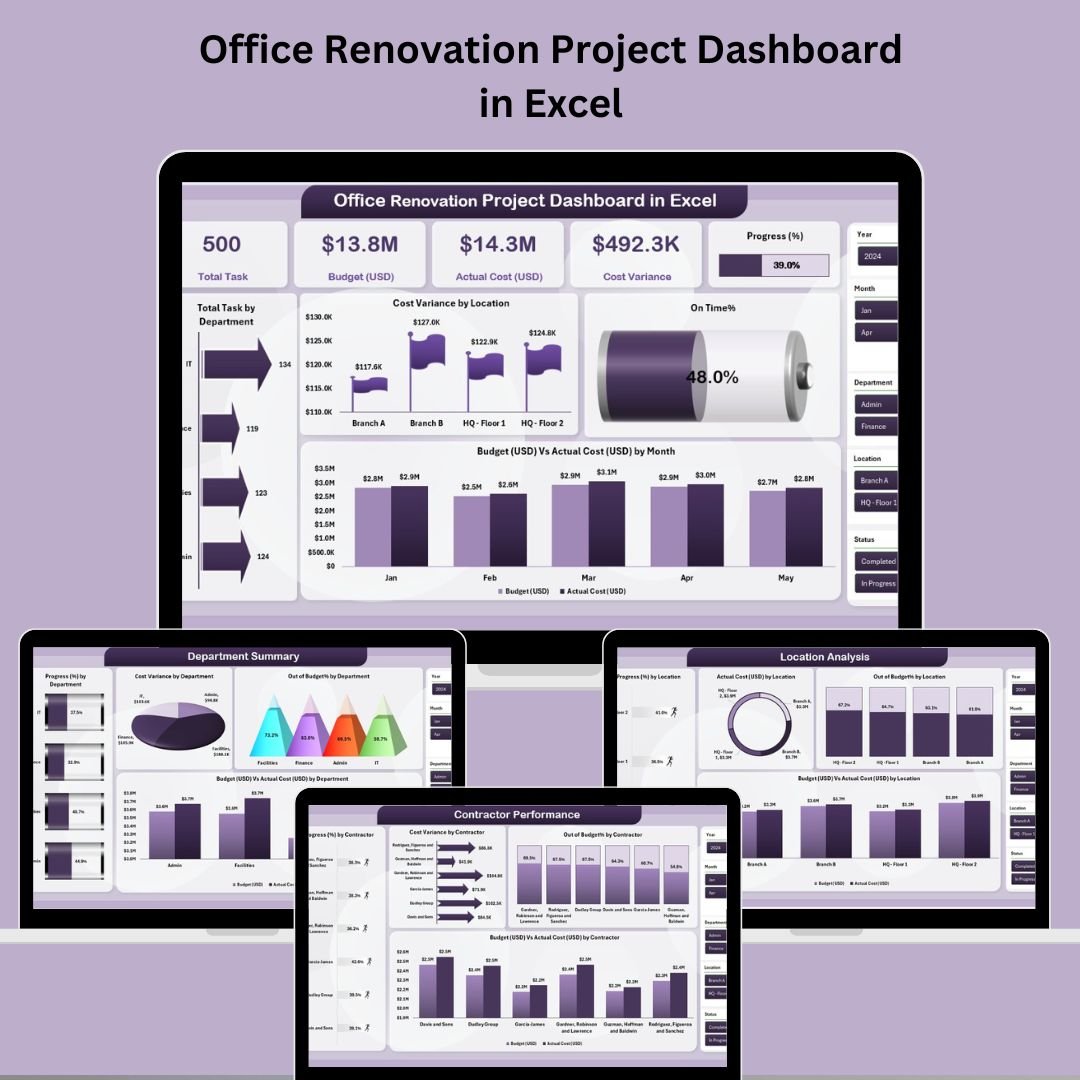
Managing an office renovation doesn’t have to be overwhelming. With multiple teams, deadlines, and budgets on the line, keeping everything in sync is a challenge—unless you have the Office Renovation Project Dashboard in Excel. 💼📊
This all-in-one Excel dashboard gives project managers, facility coordinators, and decision-makers a powerful visual tool to oversee every aspect of their renovation project. From cost control to contractor performance, it turns complex data into actionable insights—no special software needed!
✅ Key Features of Office Renovation Project Dashboard
📌 Five Analytical Pages – Easily navigate across Overview, Department Summary, Contractor Performance, Location Analysis, and Monthly Trends.
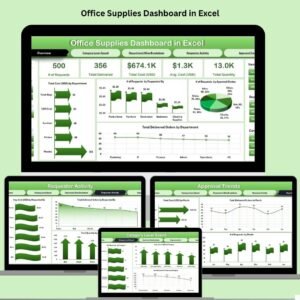
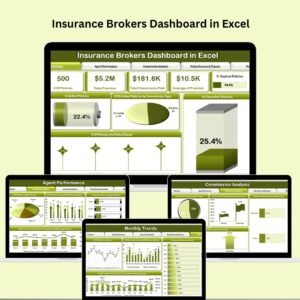
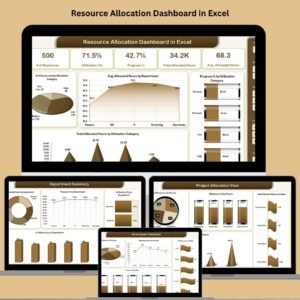
📈 High-Level KPI Cards – View metrics like On-Time %, Total Tasks, Budget vs Actual at a glance.
📊 20+ Dynamic Charts – Visualize progress, costs, and variances in real-time.
🧩 Interactive Page Navigator – Quickly switch between key views from one control panel.
📍 Slicers for Custom Views – Filter by location, department, or contractor for targeted analysis.
📁 Data-Driven Design – Just update the Data Sheet and watch all visuals auto-refresh.
🧮 Budget vs Actual Insights – Control costs and spot overages early.
🏢 Contractor and Location Breakdown – Track performance across vendors and sites.
📦 What’s Inside the Office Renovation Dashboard
This Excel tool includes five performance dashboards and two supporting sheets:
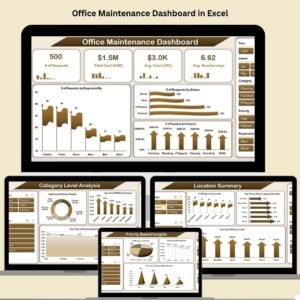
🧭 Overview Page
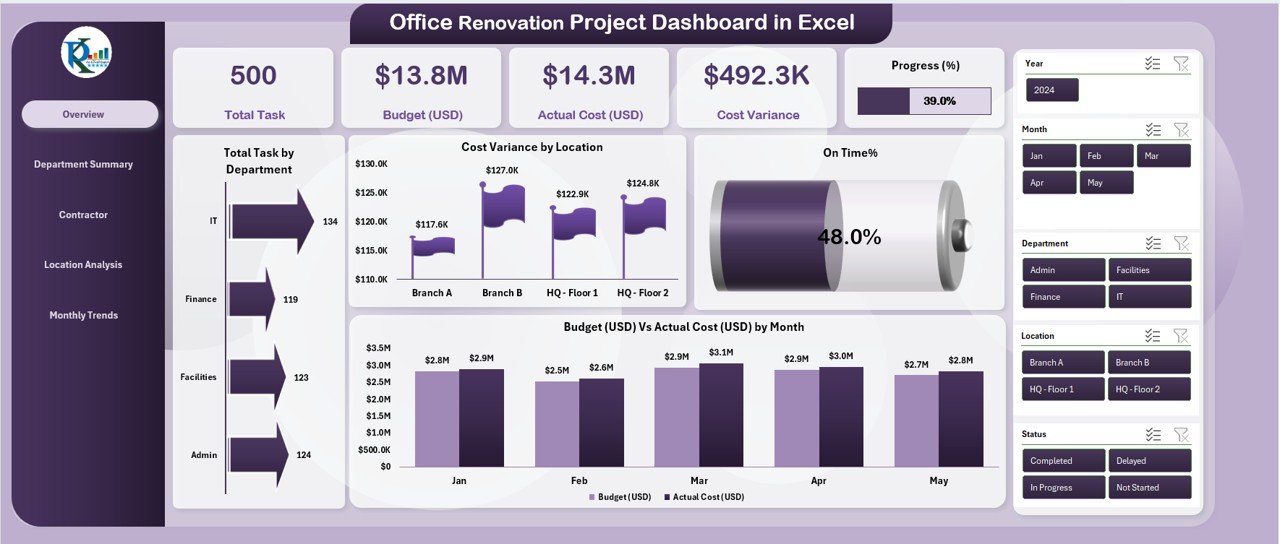
Your command center. Features 5 summary KPIs and 4 charts showing:
-
Total Tasks by Department
-
Cost Variance by Location
-
On-Time %
-
Budget vs Actual Cost by Month
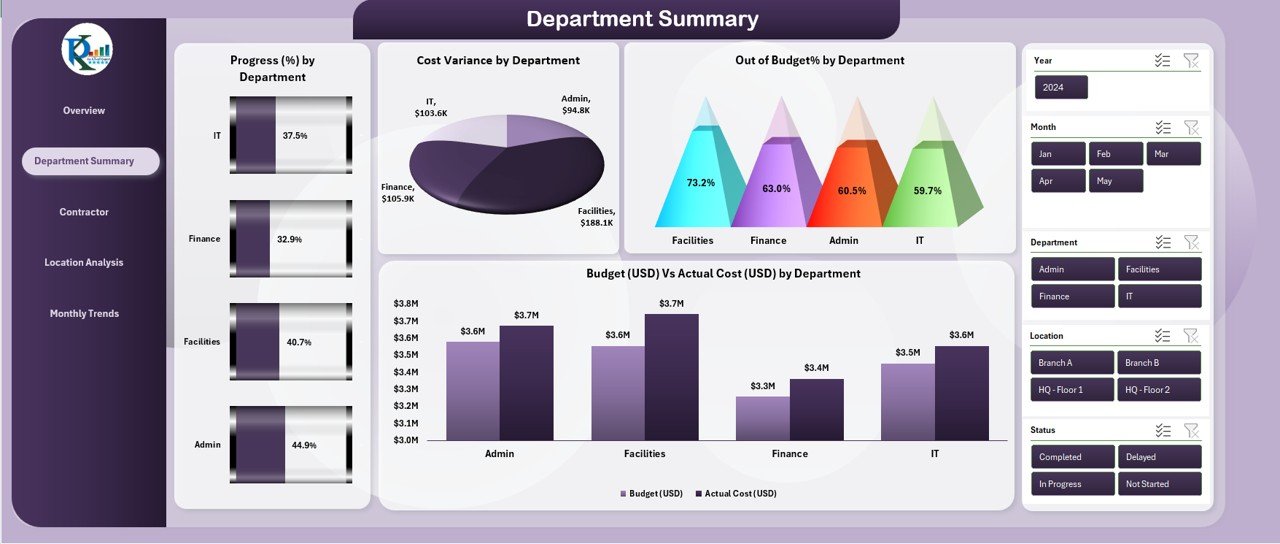
🏢 Department Summary
Analyze task and budget performance by department:
-
Progress %, Cost Variance, Out-of-Budget %, and Budget vs Actual Cost by Department
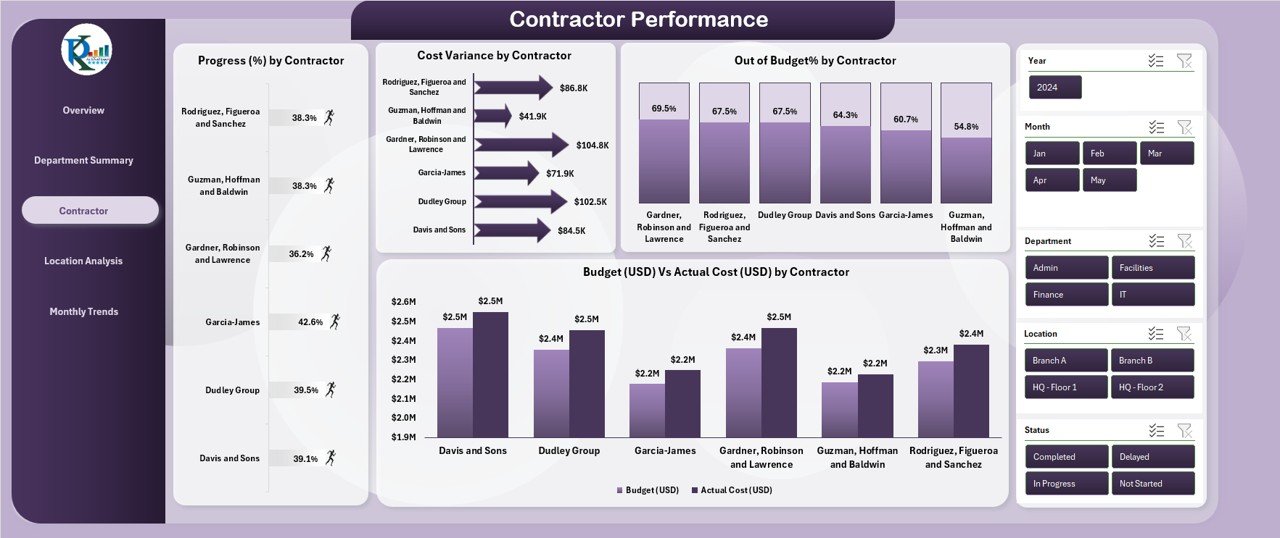
👷 Contractor Performance
Monitor contractor efficiency and spending:
-
Progress %, Cost Variance, Out-of-Budget %, and Budget vs Actual Cost by Contractor
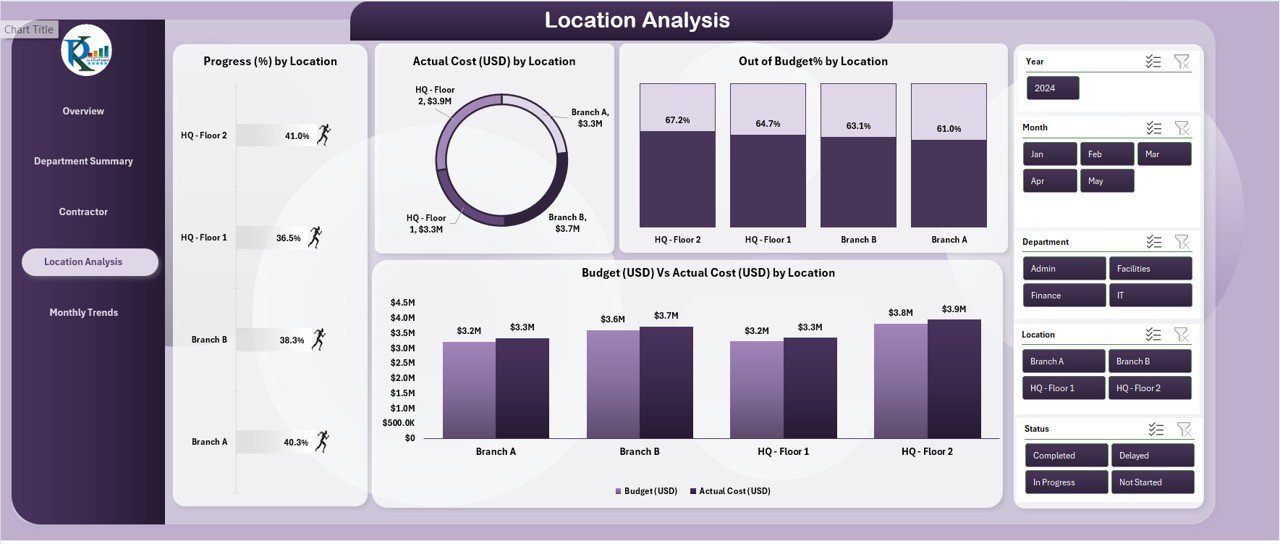
📍 Location Analysis
Track performance for multi-location renovations:
-
Progress %, Cost Variance, Out-of-Budget %, and Budget vs Actual by Location
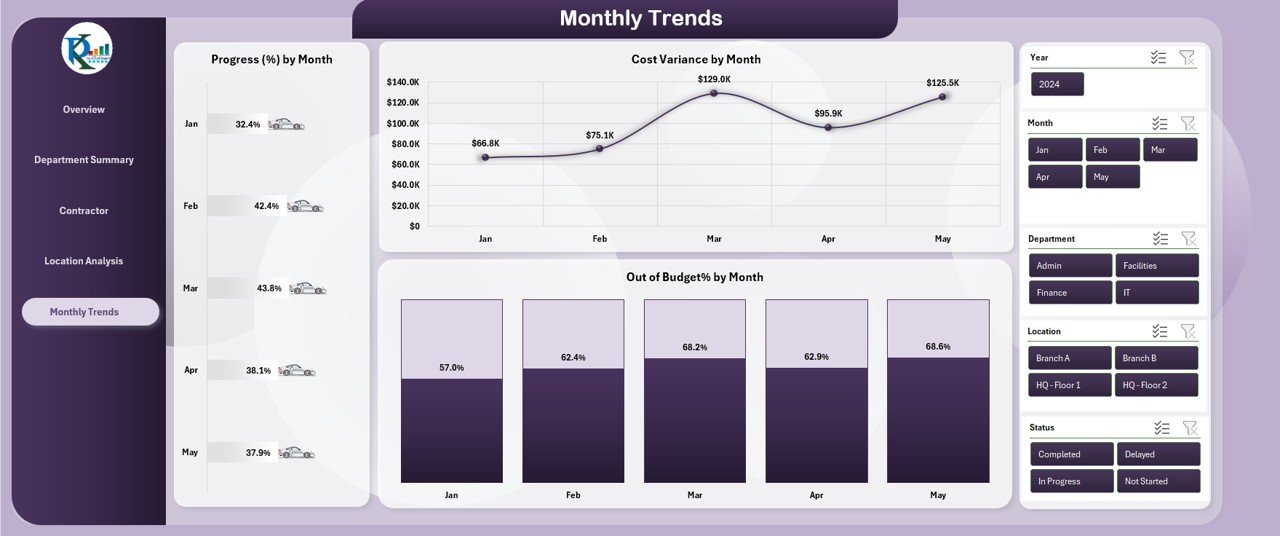
📆 Monthly Trends
Visualize progress over time:
-
Track changes in Progress, Cost Variance, Out-of-Budget %, and Budget vs Actual by Month
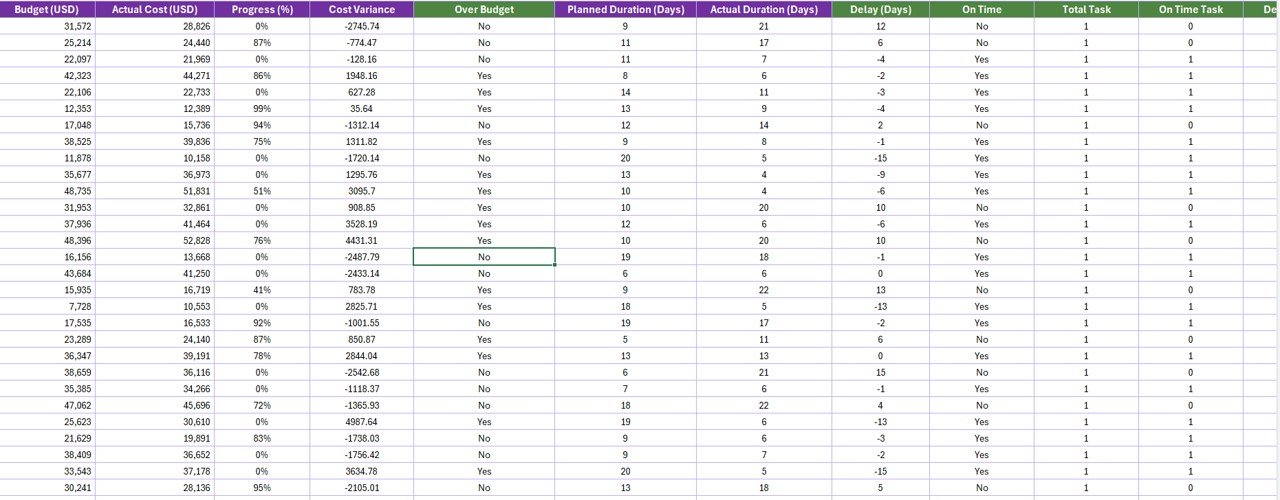
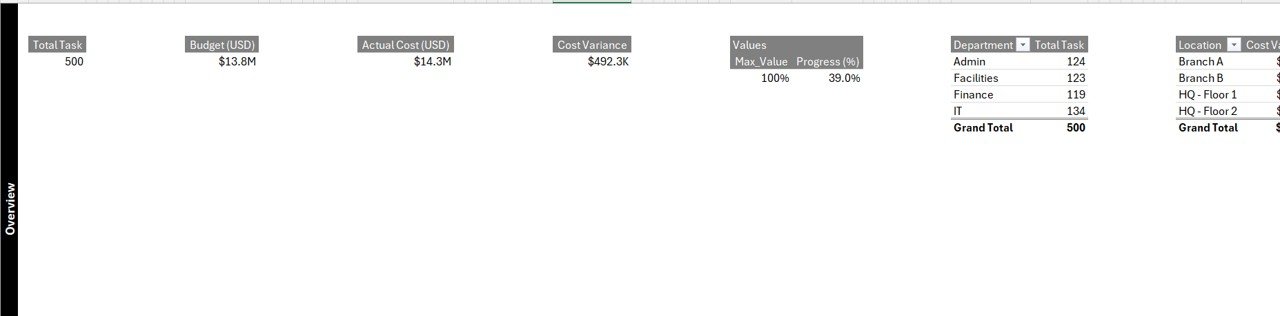
📋 Supporting Sheets
-
Data Sheet: Enter and update raw project data
-
Support Sheet: Manage drop-downs and maintain data integrity
🛠️ How to Use the Office Renovation Project Dashboard
-
Download the Excel Template and open in Excel Desktop App.
-
Input Project Data into the Data Sheet.
-
Explore KPIs & Trends across all five interactive dashboard pages.
-
Use Slicers to filter by location, contractor, or department.
-
Update Weekly or after every milestone for real-time insights.
No coding. No complexity. Just clean, visual project tracking! 🧑💼📊
👥 Who Can Benefit from This Dashboard
👷 Project Managers – Gain full control over renovation timelines and budgets.
🛠️ Facilities Managers – Coordinate departments and locations more efficiently.
💰 Finance Teams – Monitor real-time budget adherence.
👨💼 Executives & Leadership – View big-picture performance at a glance.
📅 HR Teams – Stay aligned on space readiness for return-to-office planning.
If you manage space, money, or teams during renovations—this dashboard is built for you.
🔗 Click here to read the Detailed blog post
🔗 Visit our YouTube channel to learn step-by-step video tutorials
Watch the step-by-step video tutorial:


Reviews
There are no reviews yet.