

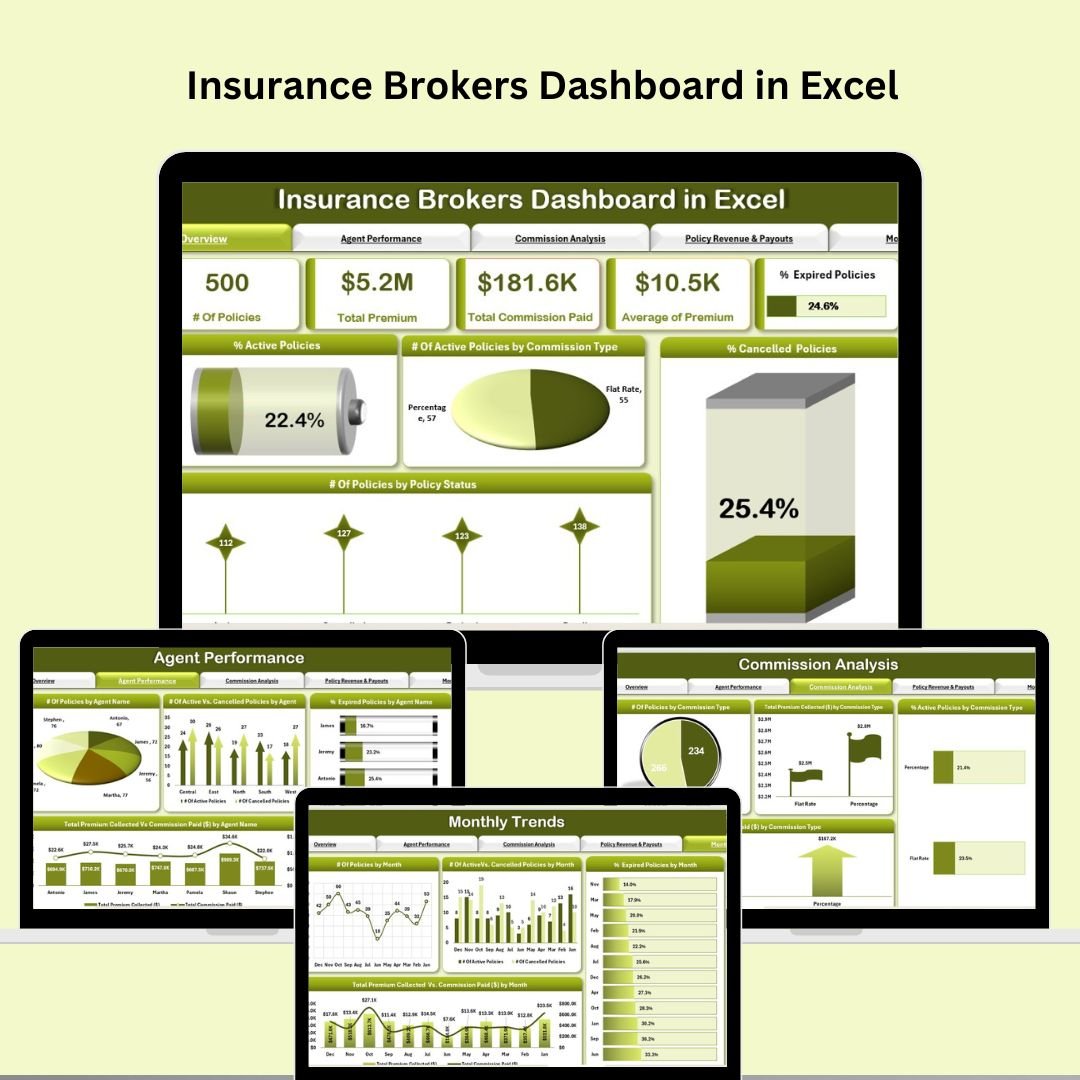
Managing insurance operations can be complex – tracking commissions, monitoring policy performance, managing agents, and ensuring timely payments all at once is no small task. That’s why we’ve created the Insurance Brokers Dashboard in Excel, a professionally designed, plug-and-play dashboard template that puts real-time insights at your fingertips.
Whether you’re an individual broker or managing a team of agents, this dashboard helps you transform raw data into actionable intelligence.
🧩 Key Features of the Insurance Brokers Dashboard in Excel
💼 All-in-One Broker Dashboard
From policy tracking to commission management – get a 360° view of your insurance business performance in a single place.
📊 Interactive Charts & Slicers
Visually analyze performance across key dimensions like agent name, region, commission type, policy status, and more.
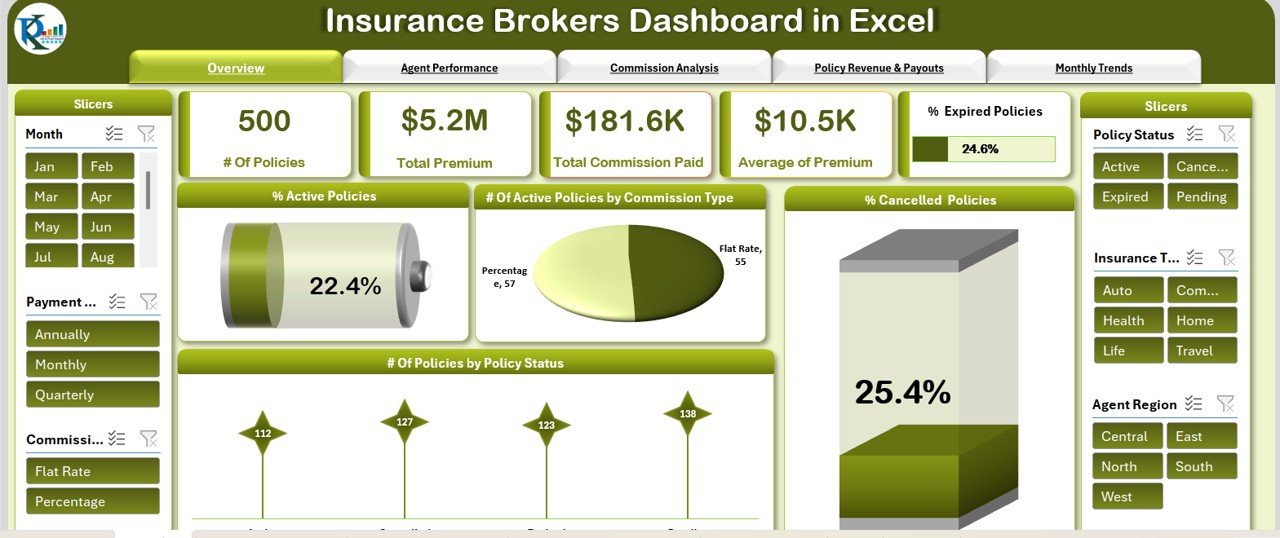
📌 Real-Time Cards
Instantly see KPIs like:
Number of Policies
Total Premium Collected
Total Commission Paid
Average Premium Amount
% of Expired Policies
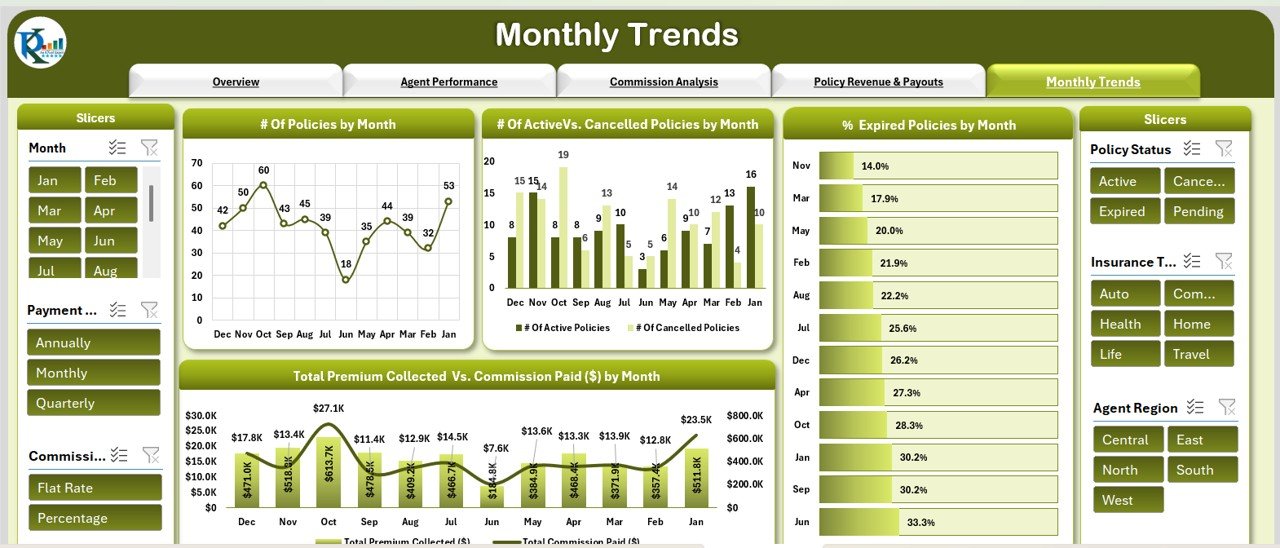
📅 Monthly Trends Analyzer
Track policy growth, cancellations, and commission payouts across months to forecast trends and improve future planning.
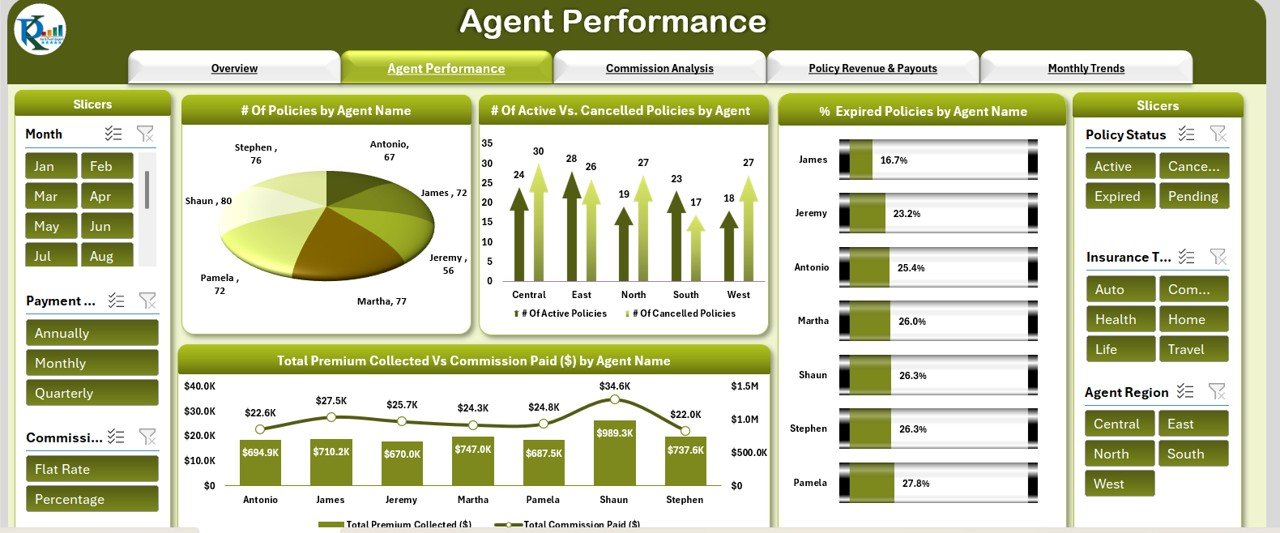
👥 Agent Performance Monitor
Evaluate agent effectiveness by comparing policies handled, commissions earned, and percentage of expired policies.
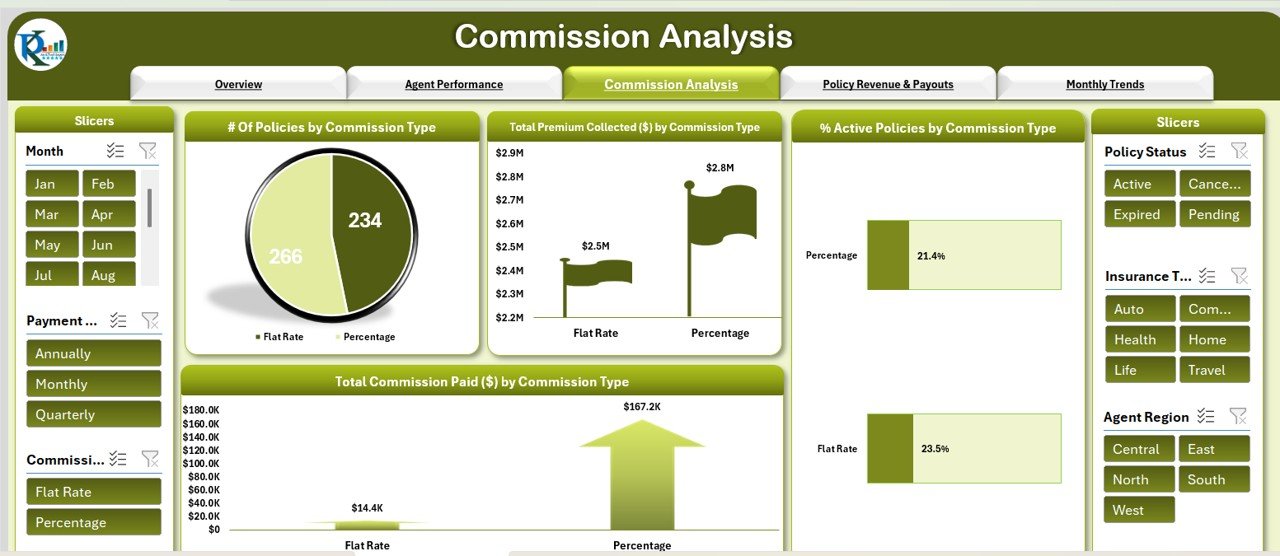
💰 Commission Type Breakdown
Analyze how different commission structures affect premium collection and broker earnings.
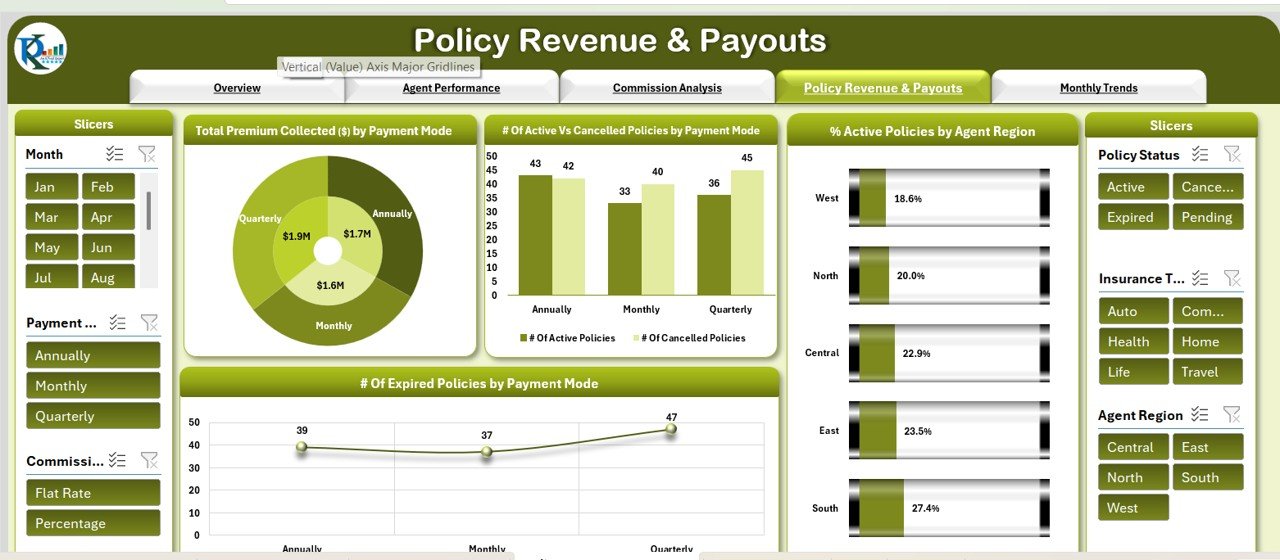
📍 Policy Payout & Revenue Tracker
Understand revenue sources and policy statuses based on payment modes and agent regions.
📦 What’s Inside the Insurance Brokers Dashboard
🔹 Overview Sheet
Get a snapshot of your entire brokerage in one glance. Visual indicators for policy statuses, KPIs, and charts for active, cancelled, or expired policies.
🔹 Agent Performance Sheet
Break down performance by agent and region. Use this sheet to reward top performers and coach low performers.
🔹 Commission Analysis Sheet
Understand which commission models are bringing in the highest returns and track their efficiency.
🔹 Policy Revenue & Payouts Sheet
Segment performance based on payment mode (bank transfer, online, etc.) and discover overdue or cancelled policies.
🔹 Monthly Trends Sheet
Forecast revenue and payout cycles with month-wise policy and commission tracking.
🔹 Data Sheet
This is your master data input sheet. Feed in all your policy data, agent details, and payment statuses – everything auto-calculates!
🛠️ How to Use the Insurance Brokers Dashboard
Enter Your Data – Fill in the Data Sheet with policy details, agent names, premium amounts, and payment statuses.
Customize As Needed – Add or remove fields, change KPIs, or adjust chart visuals to match your business model.
Filter & Analyze – Use built-in slicers to filter by region, commission type, or agent and instantly see the updated insights.
Track Monthly Trends – Identify dips or peaks in policy count, payments, or commission earnings.
Review Agent Output – Evaluate who’s bringing the most value – and who needs improvement.
🎯 Who Can Benefit from This Dashboard?
✅ Independent Insurance Brokers
Stay organized, make strategic decisions, and boost your client servicing capacity.
✅ Insurance Brokerage Firms
Improve agent accountability, optimize commissions, and strengthen team performance.
✅ Insurance Managers & Admin Teams
Get structured reporting, identify overdue policies, and manage payments with ease.
✅ Financial Advisors
Track client policy lifecycle, premium inflows, and advisor payout efficiently.
🔗 Click here to read the Detailed blog post
▶️ Visit our YouTube channel to learn step-by-step video tutorials































Reviews
There are no reviews yet.