


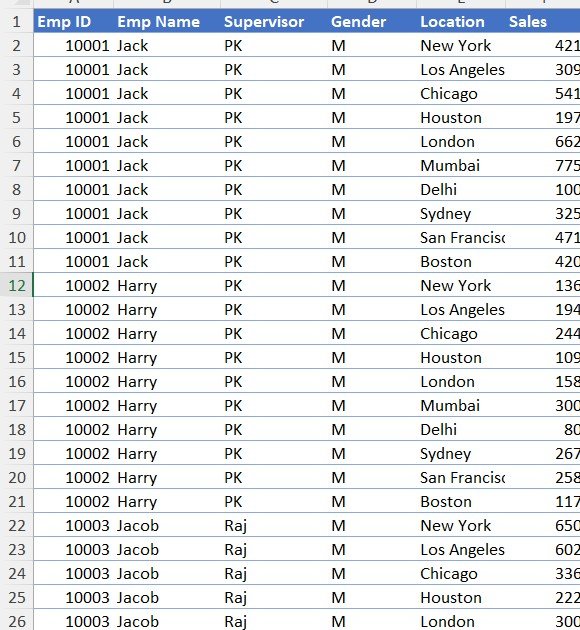

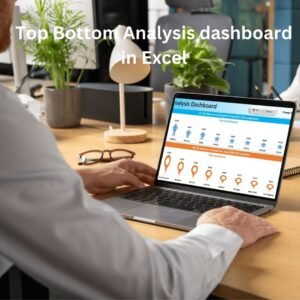
The Top Bottom Analysis Dashboard in Excel is an interactive tool that helps businesses analyze and compare their best- and worst-performing employees and locations based on sales data. It is built for sales managers, business analysts and decision-makers who want a quick, visual way to see who is driving sales, where sales come from, and which areas need attention. Dynamic filters, clear visualizations and real-time updates support data-driven decisions that improve sales performance and business strategy.
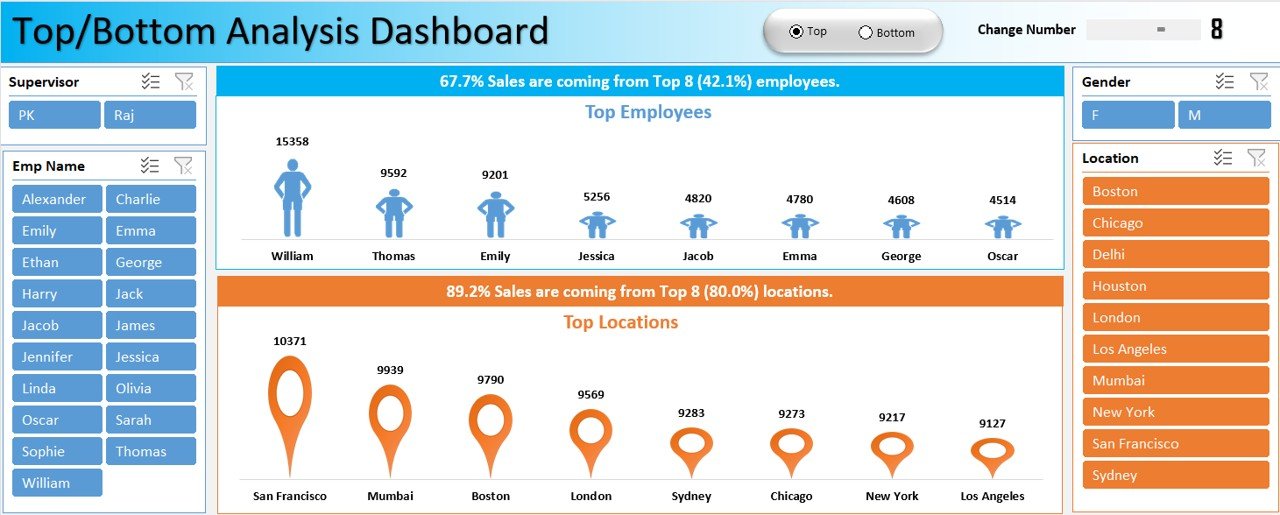
Key Features of the Top Bottom Analysis Dashboard in Excel
Dynamic Top/Bottom Analysis
- Switch between top and bottom performers with an intuitive toggle button.
- View top-performing employees and locations, or identify underperforming areas that need attention.
Adjustable Data Range
- Customize how many employees or locations are displayed using a simple scroll bar.
- Analyze performance trends across different timeframes and organizational hierarchies.
Interactive Controls for Custom Insights
- Use slicers to filter by supervisor, employee name, gender or location.
- Instantly refine the data visualization based on your selections for more targeted analysis.
Real-Time Data Updates
- The dashboard updates dynamically as new sales data is entered, helping keep results accurate.
- Get an instant overview of sales contributions from top employees and locations.
Comprehensive Sales Overview
- Understand where sales are coming from and who is contributing the most.
- Identify key growth opportunities by analyzing sales distribution across employees and regions.
Ready-to-Use Sales Insights
- Based on real sales data, the dashboard delivers actionable insights at a glance.
- Designed for easy customization, so you can tailor it to your business needs.
What’s Inside the Dashboard
This Excel dashboard brings the main controls and visuals for sales analysis together in one view:
| Component | What it does |
|---|---|
| Top/Bottom toggle button | Switches the view between top and bottom performers |
| Scroll bar | Sets how many employees or locations are shown |
| Slicers | Filter by supervisor, employee name, gender and location |
| Employee view | Shows sales contribution from top or bottom employees |
| Location view | Shows sales contribution from top or bottom locations |
| Visual analytics | Turns sales data into clear, interactive visualizations that update as data changes |
Together these components act as a compact sales performance dashboard, turning complex sales analysis into actionable intelligence.
Who This Dashboard Is For
- Sales managers who need to spot top and bottom performers quickly and act on the results.
- Business analysts who want a ready-made, interactive way to break down sales by employee, supervisor and location.
- Decision-makers looking for a quick, effective way to evaluate performance and optimize business strategy.
- Teams tracking employee performance who want to see who contributes most to sales and where support is needed.
How to Use It
- Enter your sales data – the dashboard updates dynamically as new data is added.
- Choose Top or Bottom with the toggle button to focus on best performers or underperforming areas.
- Set the range with the scroll bar to control how many employees or locations appear.
- Filter with slicers by supervisor, employee name, gender or location for targeted analysis.
- Review the visuals to understand where sales come from and who contributes the most, then act on the insights.
Read the detailed guide and watch the tutorial
Click here to read the detailed blog post
Watch the step-by-step video tutorial:
Frequently Asked Questions
What does the Top Bottom Analysis Dashboard in Excel do?
It analyzes sales data to compare the best- and worst-performing employees and locations, showing who contributes the most to sales and which areas need attention.
How do I switch between top and bottom performers?
Use the toggle button on the dashboard. One click switches the view between top performers and bottom performers.
Can I change how many employees or locations are shown?
Yes. A simple scroll bar lets you adjust the number of employees or locations displayed in the analysis.
Which filters are available?
Slicers let you filter by supervisor, employee name, gender and location, and the visuals refresh instantly to match your selection.
Does the dashboard update when I add new data?
Yes. The dashboard updates dynamically as new sales data is entered, so your top and bottom analysis stays current.
Can I customize the dashboard for my business?
Yes. It is designed for easy customization, so you can tailor it to your specific sales analysis needs.
Also check our Inventory Management Form in Excel
Last updated: October 2026
Compatibility and Requirements
- Works in Microsoft Excel desktop (Excel 2016 or later, or Microsoft 365).
- The toggle button, scroll bar and slicers are standard Excel controls. Microsoft explains slicers in Use slicers to filter data.
Related Sales Analysis Templates
- Daily Sales Dashboard in Excel: day by day sales results
- Sales Dashboard in Excel: an overall sales dashboard
- Channel Sales Dashboard in Excel: sales broken down by channel
- Sales Target Dashboard in Excel: sales against targets
- Data Analyst’s Chart & Visualization Pack: 10 premium Excel and Google Sheets chart templates
Browse all Excel analysis templates or the Excel dashboards.










Reviews
There are no reviews yet.