

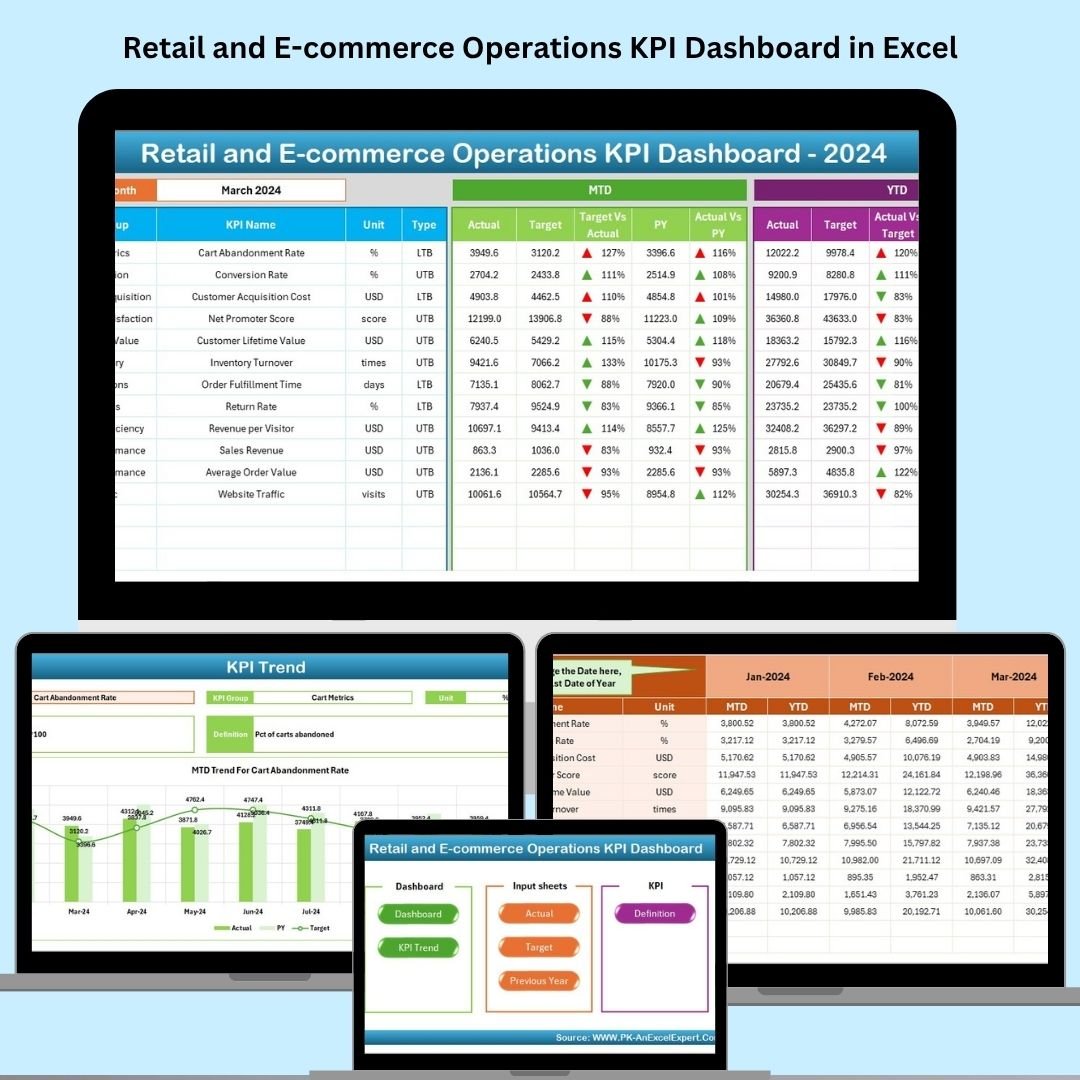
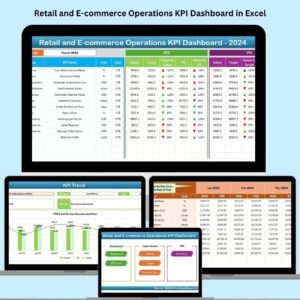
This dynamic Retail and E-commerce Operations KPI Dashboard Excel-based dashboard allows you to track your most critical KPIs across sales, operations, and customer service in real time. With 7 structured sheets, monthly and YTD comparisons, and visual cues like variance arrows and sparklines, this tool helps retail teams make smarter decisions faster.
Whether you’re managing online orders, brick-and-mortar sales, or omnichannel operations, this dashboard gives you everything you need to optimize performance, reduce errors, and scale confidently.
📊 Key Features
✅ 7 Structured Worksheets:
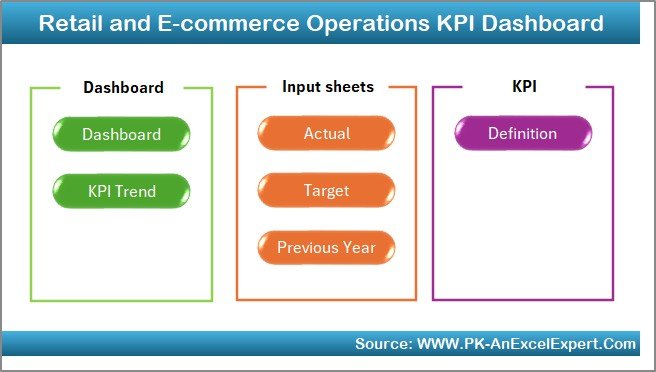
Home Sheet: Navigation panel with quick-access buttons to all major sections.
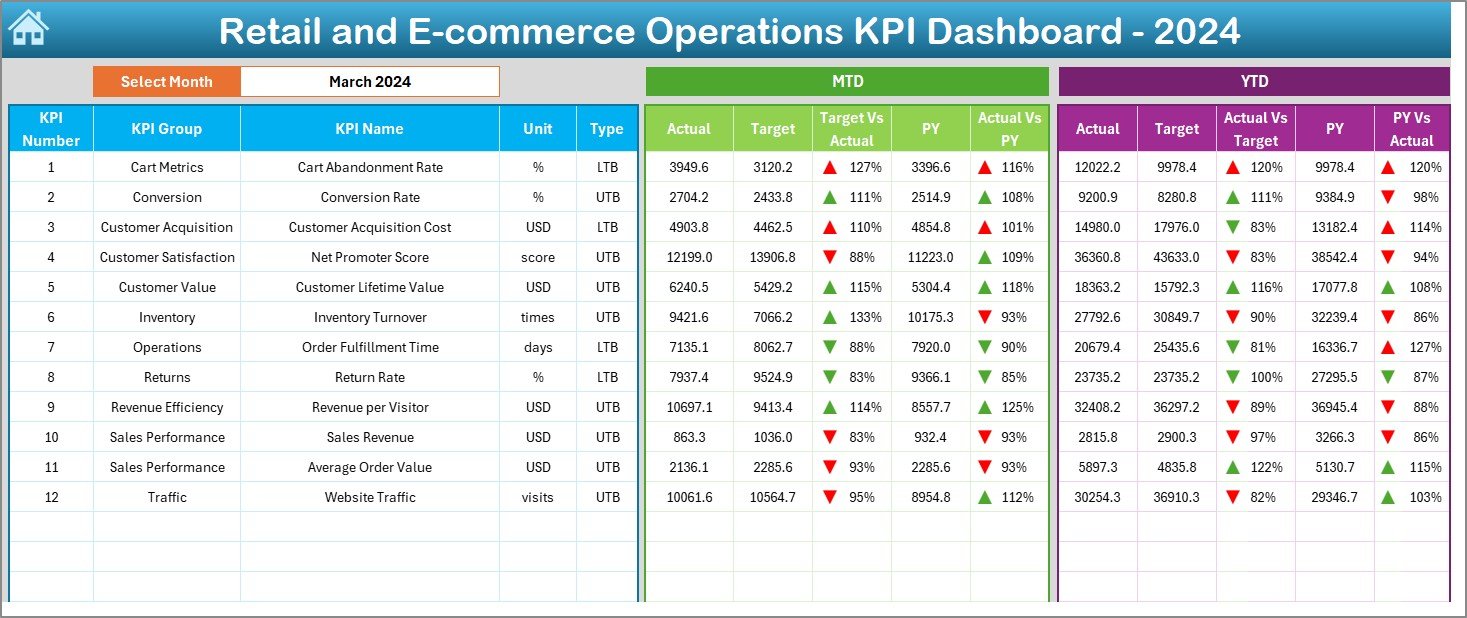
Dashboard Sheet: Visual cards and charts for MTD/YTD data, targets, and PY comparisons.
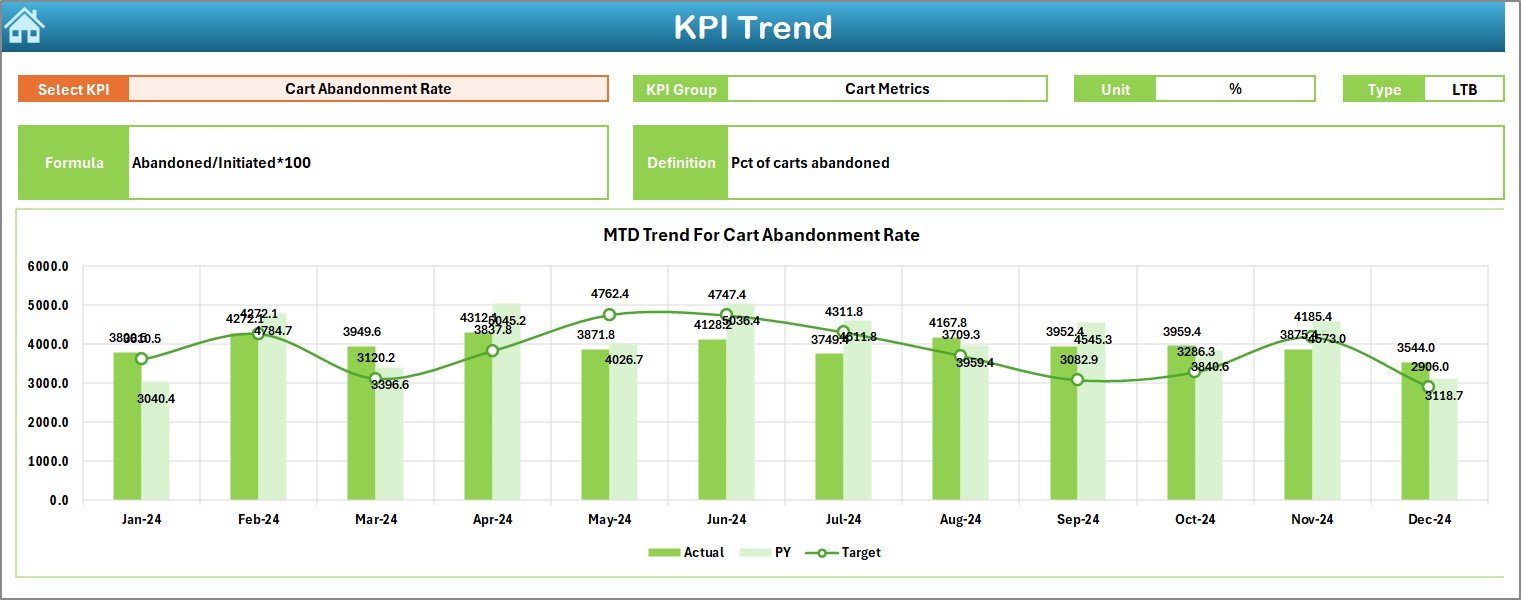
KPI Trend Sheet: Line charts comparing Actual vs. Target vs. Previous Year.
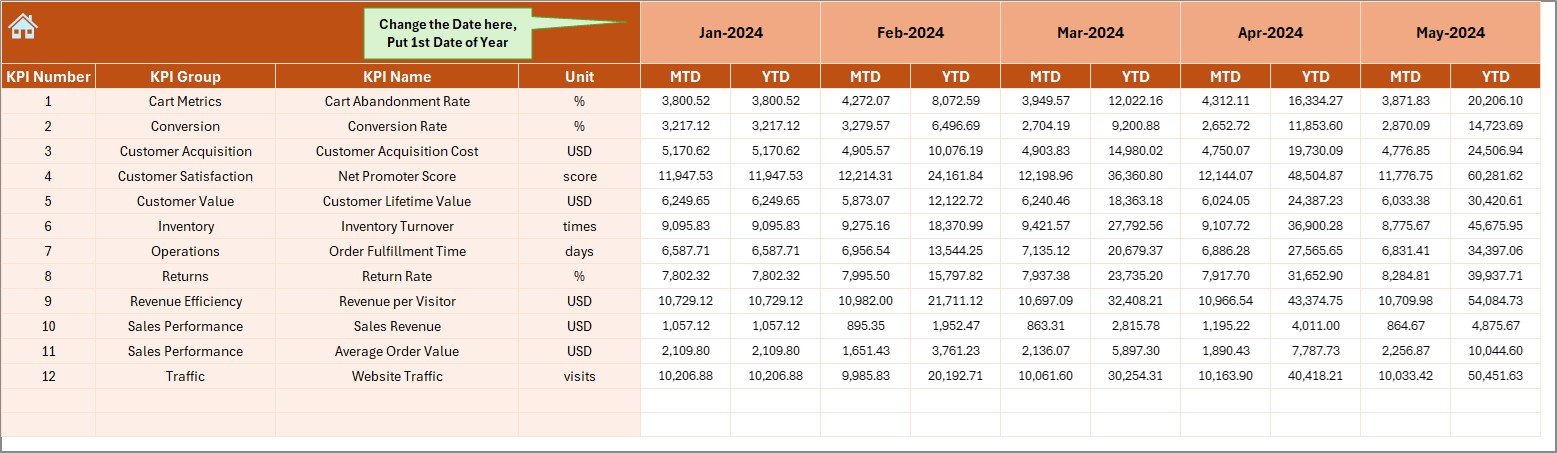
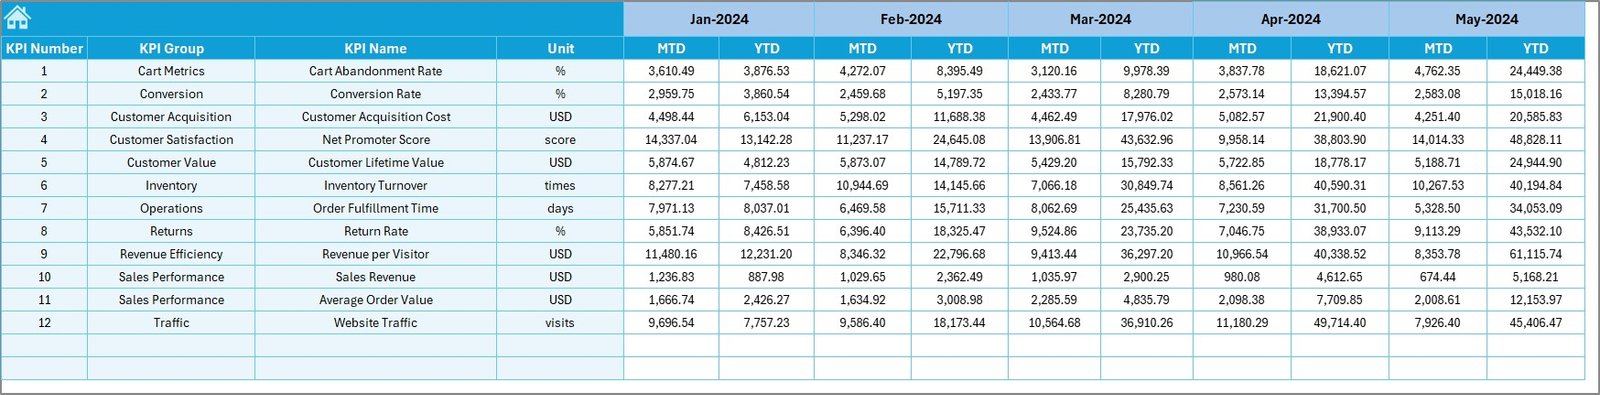
Actual Numbers Input: Log monthly MTD/YTD values for each KPI.
Target Sheet: Enter monthly and yearly performance goals.
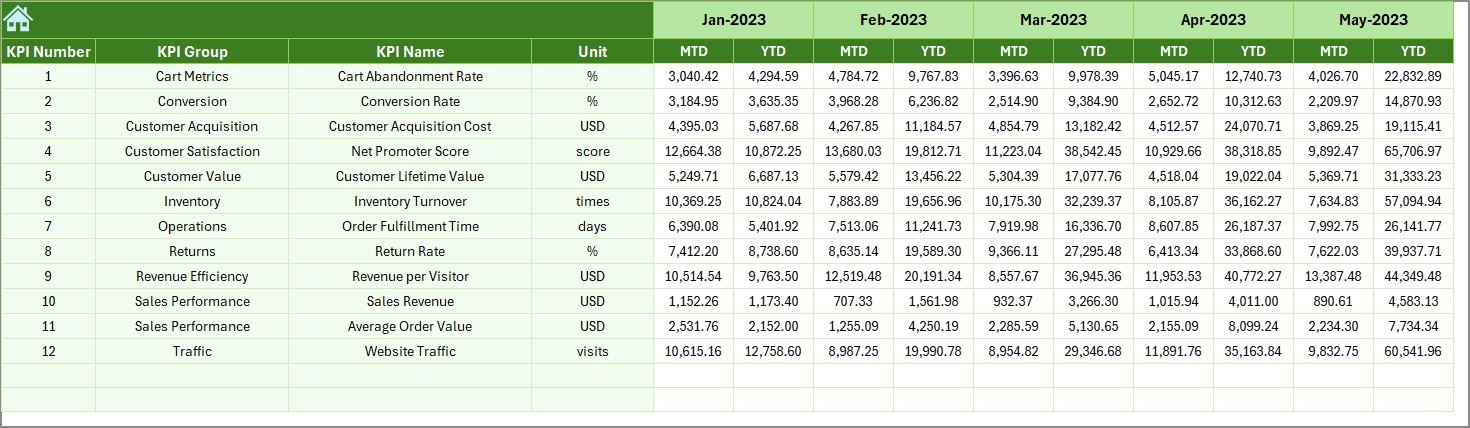
Previous Year Data: Maintain historical performance benchmarks.
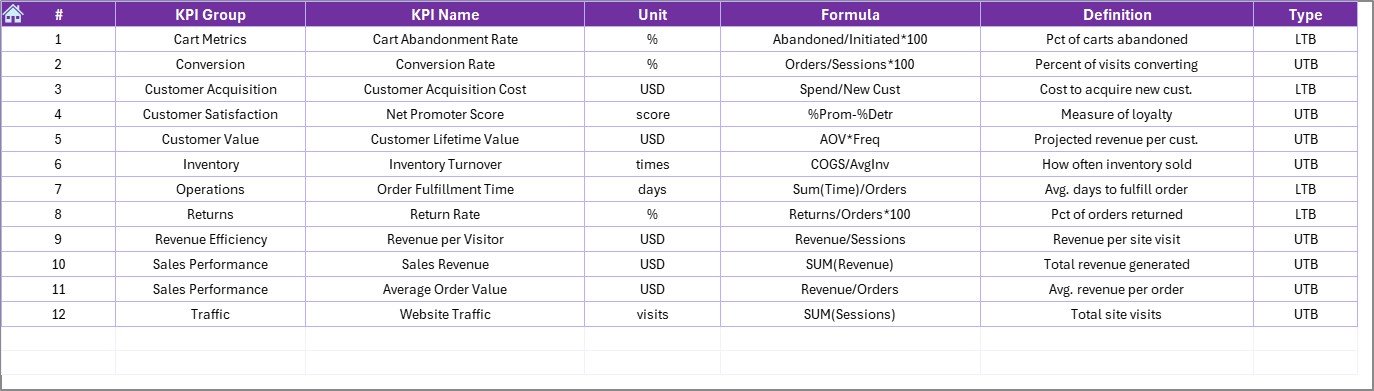
KPI Definition Sheet: Track formulas, definitions, and performance types (UTB/LTB).
📈 KPI Metrics Covered (Examples):
Sales Revenue
Average Order Value
Conversion Rate
Inventory Turnover
Cart Abandonment Rate
Customer Satisfaction
⚙️ Smart Functionalities:
Month selector that updates the full dashboard automatically
Conditional formatting with up/down arrows for quick variance tracking
Drop-down validations to prevent data entry errors
Interactive slicers for trend-based KPI selection
Sparkline charts to track momentum
🚀 Benefits of Using This Dashboard
✅ One-Click Analysis – Instantly see how your KPIs are trending across months
✅ All-in-One Reporting – Combine actuals, targets, and prior year data in one place
✅ No Learning Curve – Built in Excel with intuitive navigation and easy customization
✅ Proactive Decision-Making – Identify underperforming areas early and act fast
✅ Cost-Effective – Skip expensive BI tools—do it all in Excel
✅ Scalable – Add new KPIs without redesigning your workbook
🛠 Use Cases
Monitor daily store or online sales performance
Analyze fulfillment efficiency and order value trends
Compare current vs. previous year progress
Set realistic targets for sales, returns, and customer experience KPIs
Share automated reports with teams using Excel’s share options
👨💼 Who Should Use This?
E-commerce Managers
Retail Store Owners
Sales Analysts
Inventory Planners
Operations Leaders
Business Consultants
📘 How It Works
Enter your actual monthly data in the Actual Numbers sheet
Input KPI targets in the Target Sheet
Populate last year’s numbers for comparison in the Previous Year tab
Choose any month from the drop-down in the Dashboard tab
Use the KPI Trend page to view performance for any specific metric
Review key visuals and act on real-time performance feedback
🎓 Need help? Watch our tutorials at
📺 YouTube.com/@PKAnExcelExpert





























Reviews
There are no reviews yet.