



Managing office supplies doesn’t have to be chaotic. Whether you’re handling dozens of requests every week or trying to balance supply budgets across departments, the Office Supplies Dashboard in Excel puts you back in control. Designed for office managers, admins, and finance teams, this powerful dashboard simplifies everything from monitoring requests to analyzing costs—right inside Excel.
🔍 What Is the Office Supplies Dashboard?
The Office Supplies Dashboard in Excel is a ready-to-use, interactive template that tracks and visualizes every aspect of your supply management workflow. With easy-to-use slicers, dynamic charts, and real-time metrics, it’s your go-to solution for identifying spending patterns, delivery performance, and department-wise consumption.
Perfect for small to mid-sized offices, this tool helps reduce waste, avoid delays, and improve visibility into supply operations.
📊 Key Features of the Dashboard
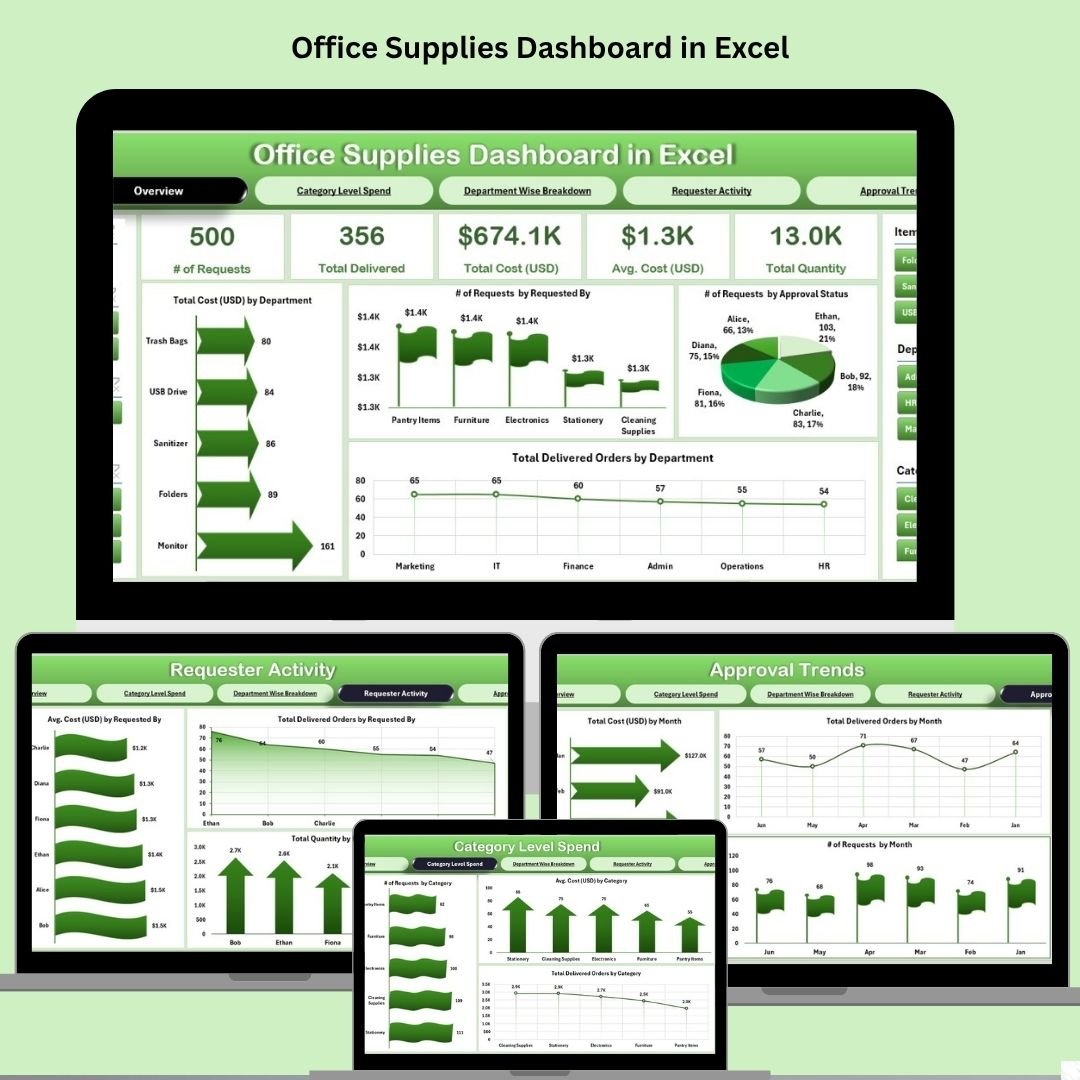
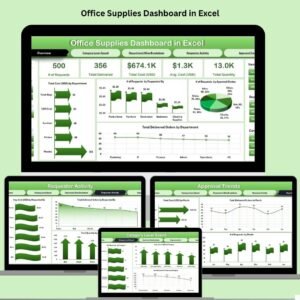
🏠 Overview Page – All Metrics in One Place
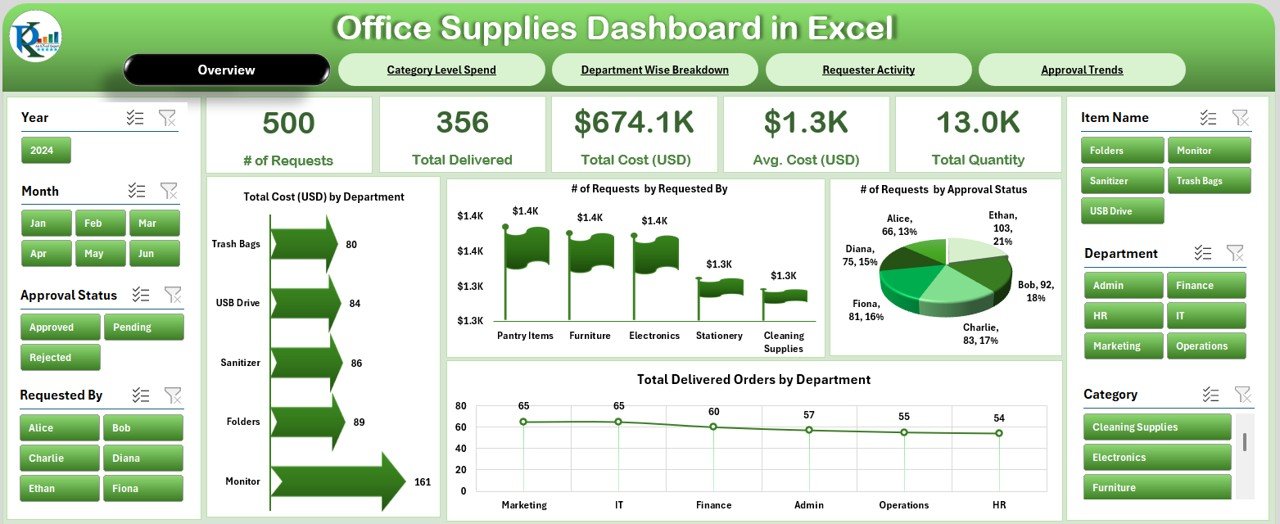
Cards: Total Requests, Approved Requests, Delivered Orders, Total Spend, Avg. Cost
Charts:
▪ Total Cost by Department
▪ Requests by Employee
▪ Requests by Approval Status
▪ Delivered Orders by Department
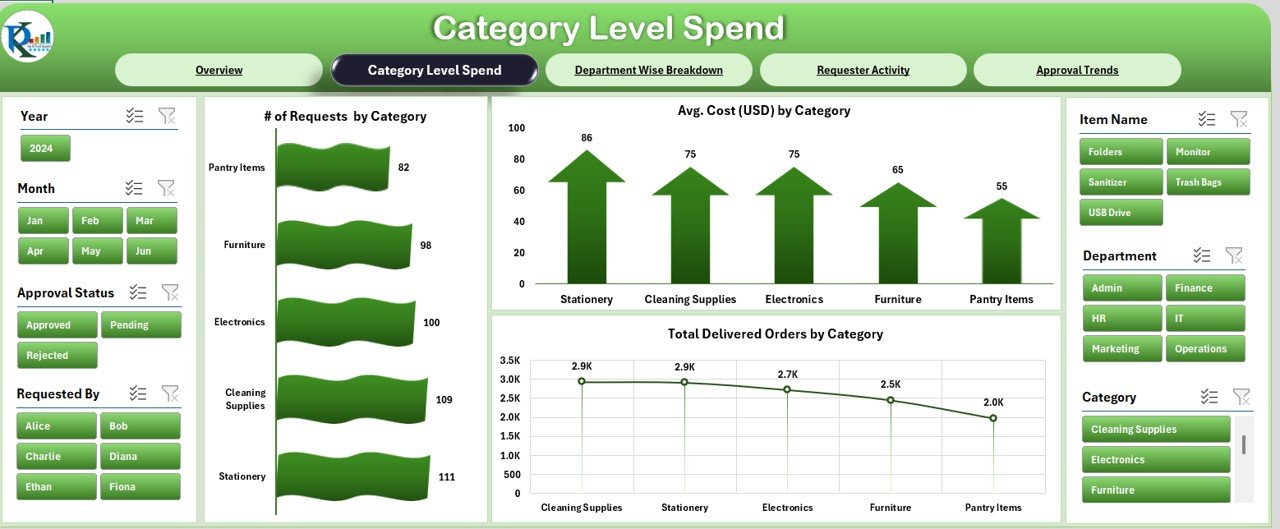
🗂️ Category-Level Spend
Breakdown of supply usage by category
Charts:
▪ Requests by Category
▪ Average Cost per Category
▪ Delivered Orders by Category
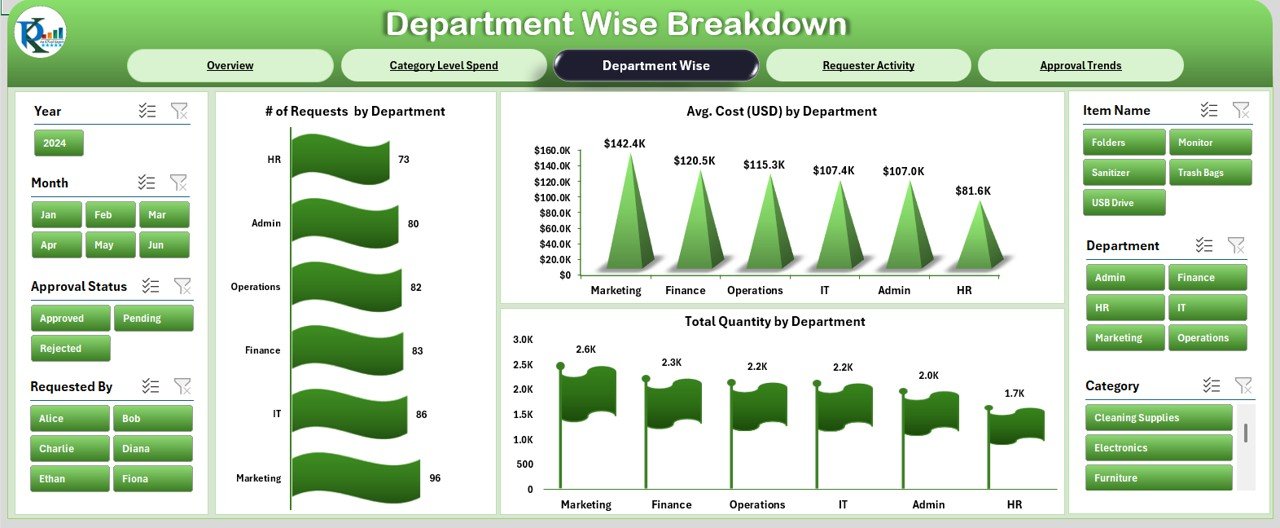
🏢 Department-Wise Analysis
Identify how each department utilizes office supplies
Charts:
▪ Requests by Department
▪ Avg. Cost per Department
▪ Quantity Ordered per Department
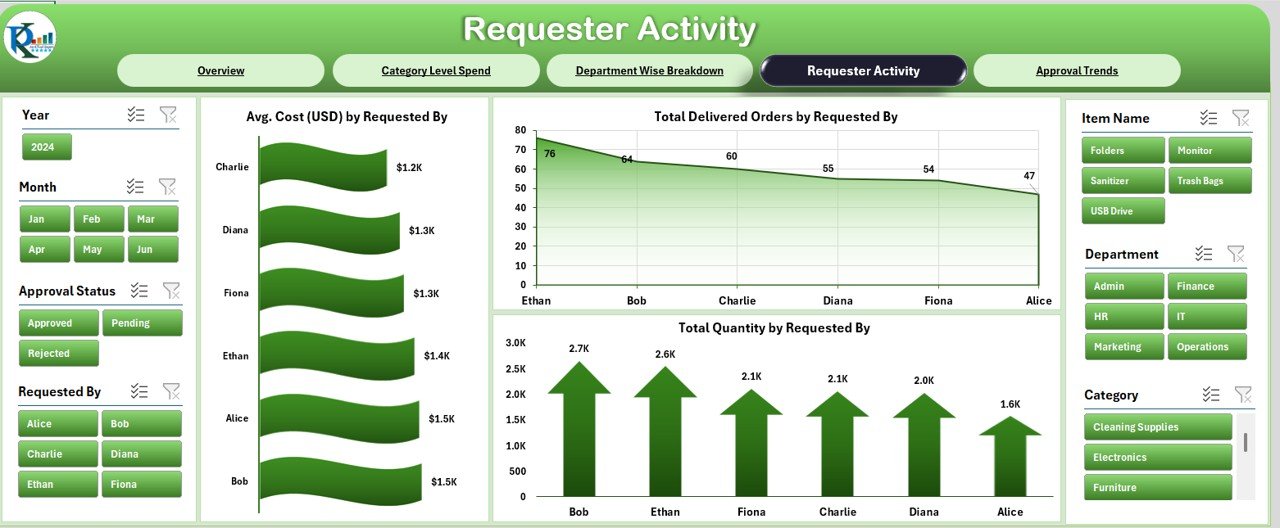
👤 Requester Activity
Track the most active requesters and their impact
Charts:
▪ Avg. Cost by Requester
▪ Delivered Orders by Requester
▪ Total Quantity Requested
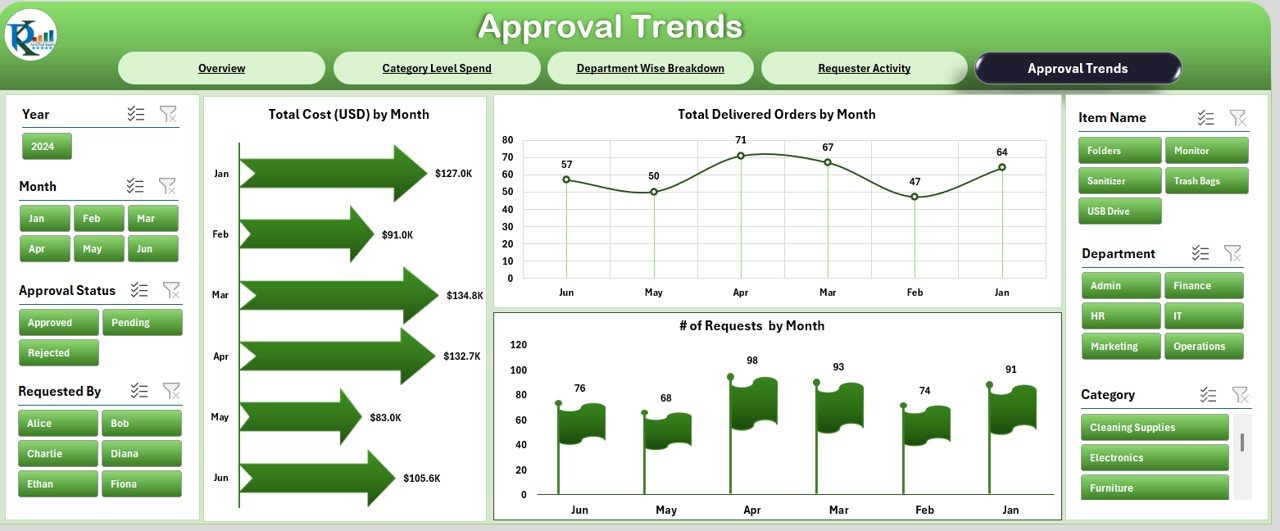
📅 Approval Trends
Monitor monthly patterns in requests, approvals, and deliveries
Charts:
▪ Monthly Total Spend
▪ Delivered Orders Over Time
▪ Requests by Month
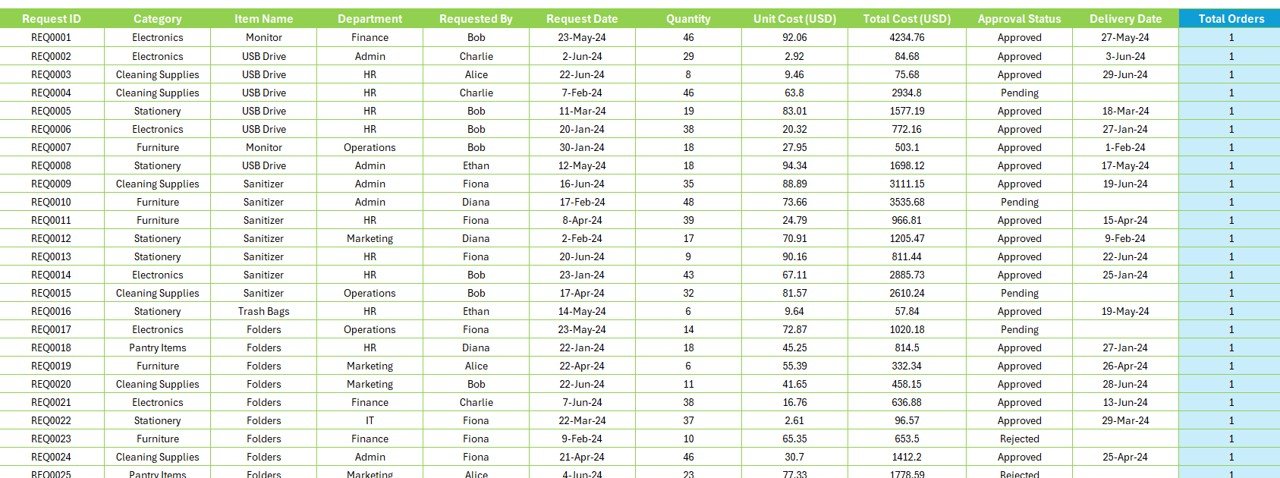
📋 What’s in the Data Sheet?
Your data powers the dashboard. Key columns include:
Request ID, Category, Item Name
Department, Requested By, Request Date
Delivery Date, Quantity, Unit Cost, Total Cost
Approval Status, Delivered Orders
Month, Year
This structured format ensures the dashboard remains clean, dynamic, and reliable.
🚀 Why Use This Excel Dashboard?
🔍 Improved Visibility
Quickly identify which departments or categories are using the most supplies.
📉 Cost Control
Spot trends that lead to overspending and adjust budgets accordingly.
⏳ Faster Approvals
Track bottlenecks in approval workflows and fix delays.
📦 Inventory Monitoring
Compare ordered vs. delivered items at a glance.
📈 Data-Driven Insights
Make smarter, informed decisions backed by real-time visual analysis.
🧠 Best Practices
✅ Update the Data Sheet Weekly or Monthly
Keep your reports accurate with timely data updates.
✅ Standardize Data Entries
Use dropdowns or validation to ensure consistent naming for departments and categories.
✅ Use Slicers Smartly
Focus your analysis using Excel slicers for department, category, requester, or approval status.
✅ Set SLAs for Approvals
Use the Approval Trends page to hold teams accountable.
✅ Always Back Up Before Editing
Save your file before making bulk changes to avoid data loss.
🛠️ Customize as Needed
Add new supply categories or departments
Change KPIs based on company goals
Insert company branding and colors
Expand chart options via PivotTables
Add fields like PO Number or Vendor Name for purchase tracking
👥 Who Should Use This?
🧑💼 Admin Teams – Manage supply requests and delivery timelines
💵 Finance Departments – Monitor budgets, track costs
🏢 Office Managers – Optimize procurement processes
📦 Inventory Managers – Ensure supplies are ordered and delivered on time
🔗 Visit Our YouTube Channel for Step-by-Step Guidance
🔗 Click here to read the Detailed blog post




























Reviews
There are no reviews yet.