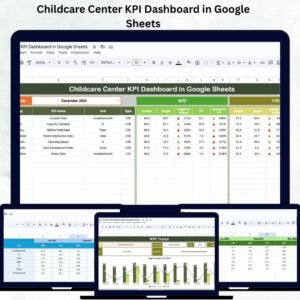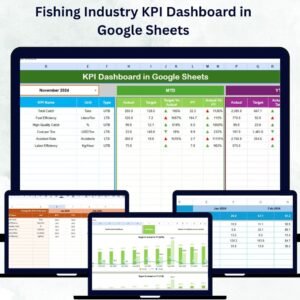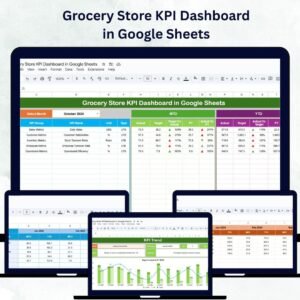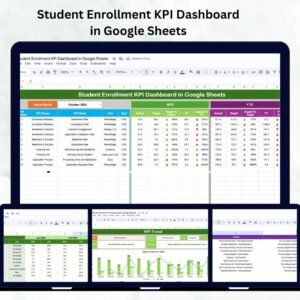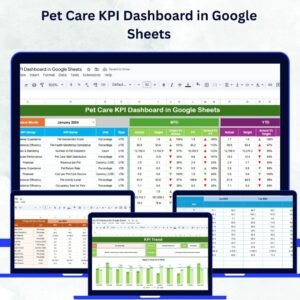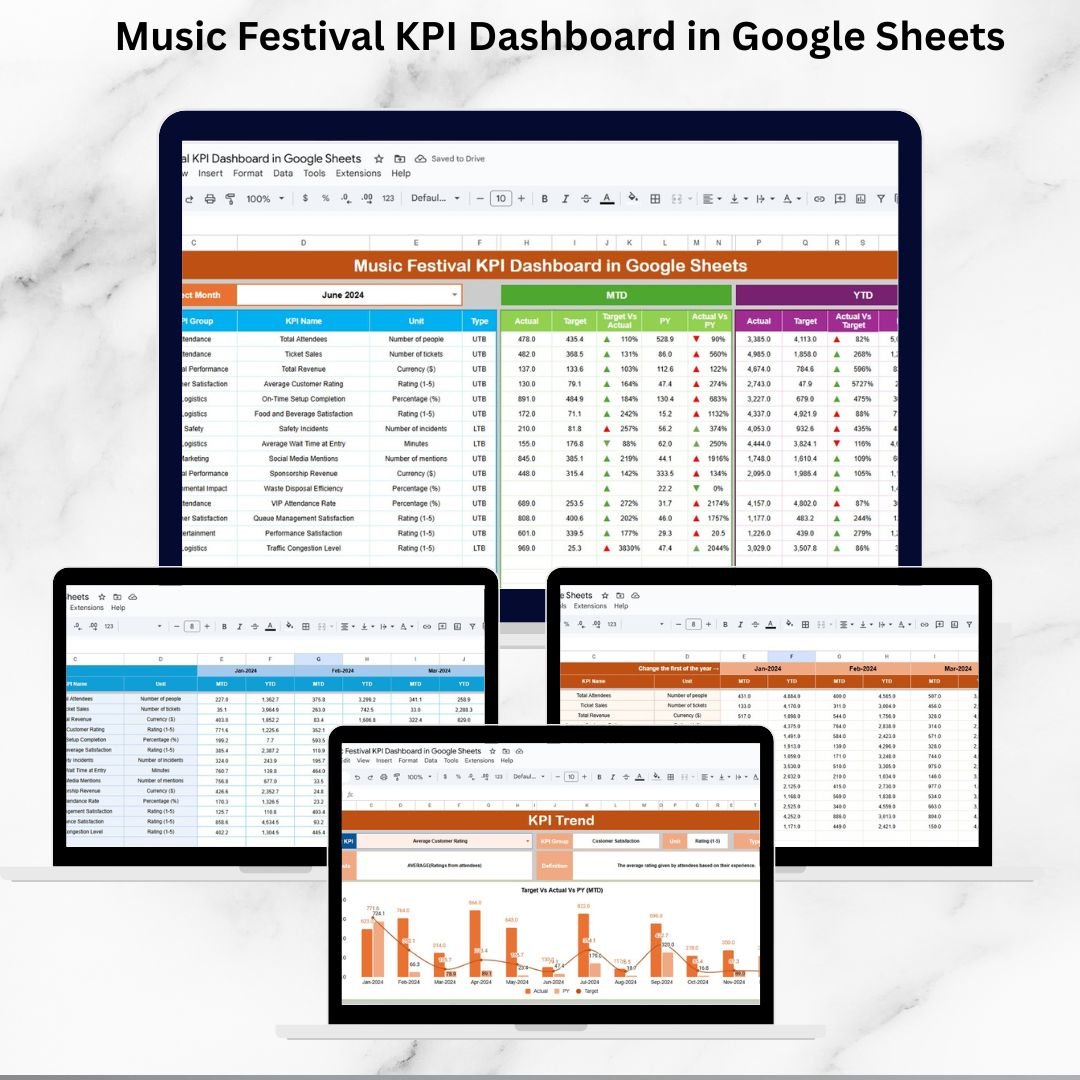
Running a music festival is no easy task — from ticket sales and artist performance to audience engagement and operational logistics, there are countless moving parts to manage. The Music Festival KPI Dashboard in Google Sheets is a ready-to-use solution that brings all these elements together in one interactive and visual platform. 🎶📊Music Festival KPI Dashboard in Google Sheets
With this dashboard, festival organizers can monitor key performance indicators (KPIs) in real-time, track progress against targets, and compare results with previous years. It is designed to simplify decision-making, highlight opportunities, and ensure each event is both profitable and memorable.Music Festival KPI Dashboard in Google Sheets
🔑 Key Features of Music Festival KPI Dashboard in Google Sheets
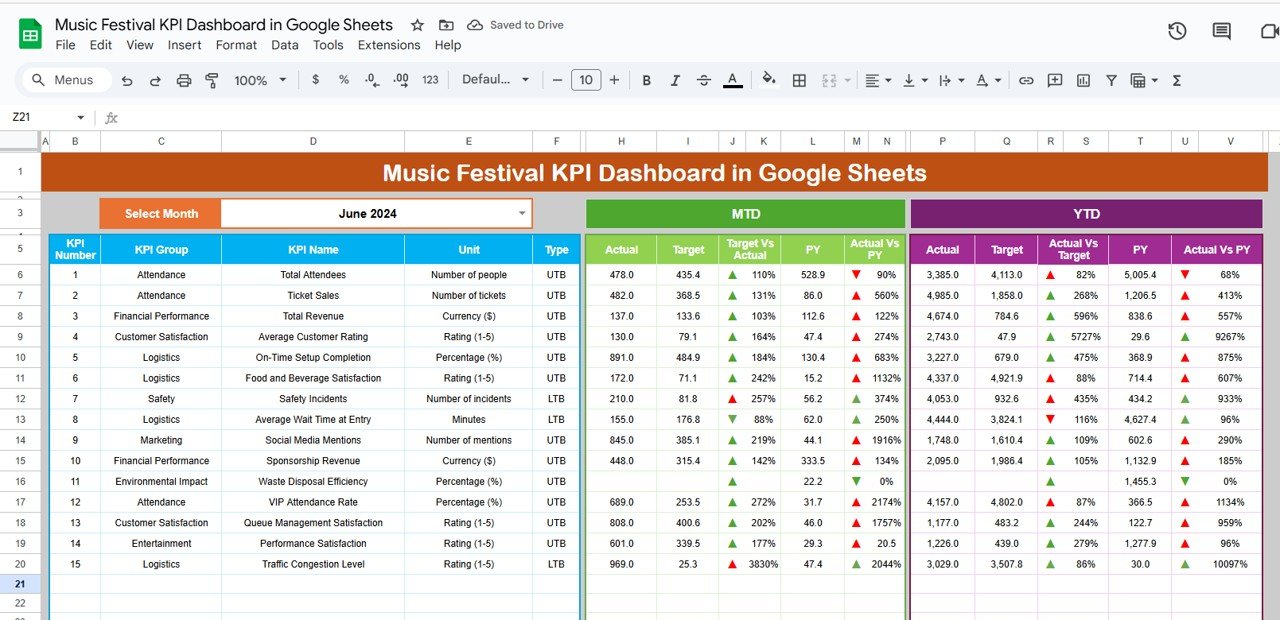
📋 Dashboard Sheet
High-level festival overview with Month Selector (D3).
MTD (Month-to-Date) and YTD (Year-to-Date) metrics for Actual vs Target vs Previous Year.
Conditional formatting arrows for quick performance insights.
Instantly see how ticket sales, revenue, and attendance are trending.
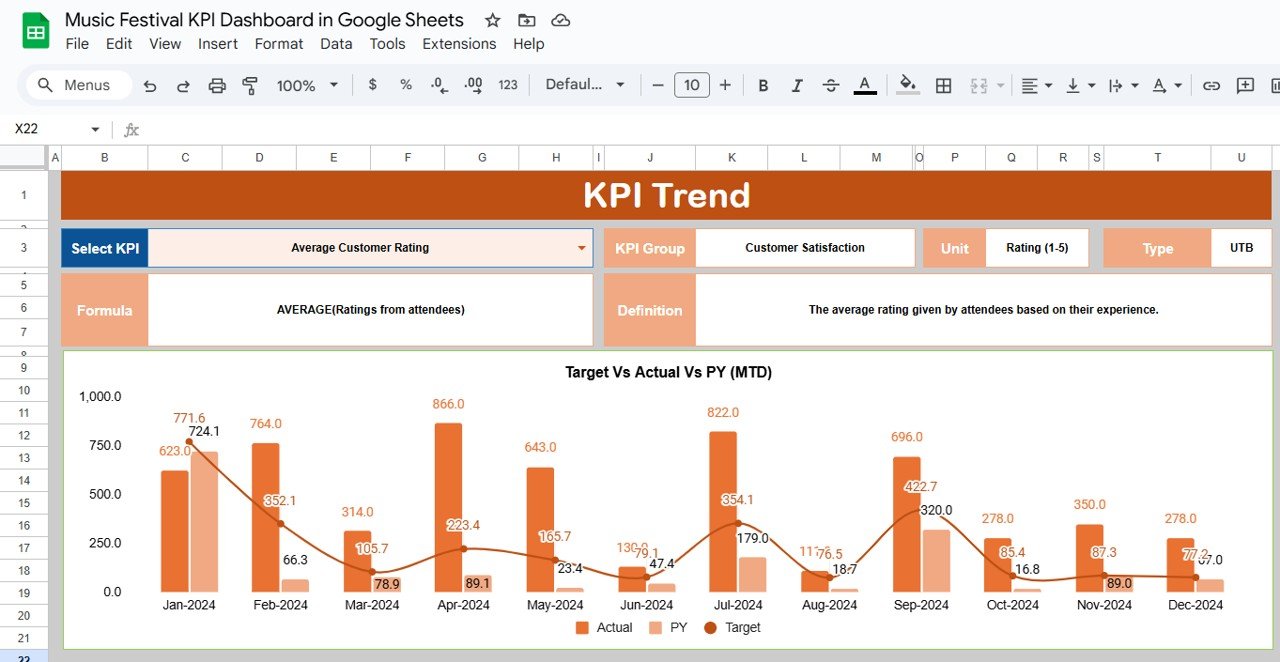
📈 KPI Trend Sheet
Choose a KPI from a dropdown (C3) to analyze performance over time.
Displays KPI Group, Unit, Type (UTB/LTB), Formula, and Definition.
Charts visualize improvements, bottlenecks, or declines across months.
🧾 Actual Numbers Sheet
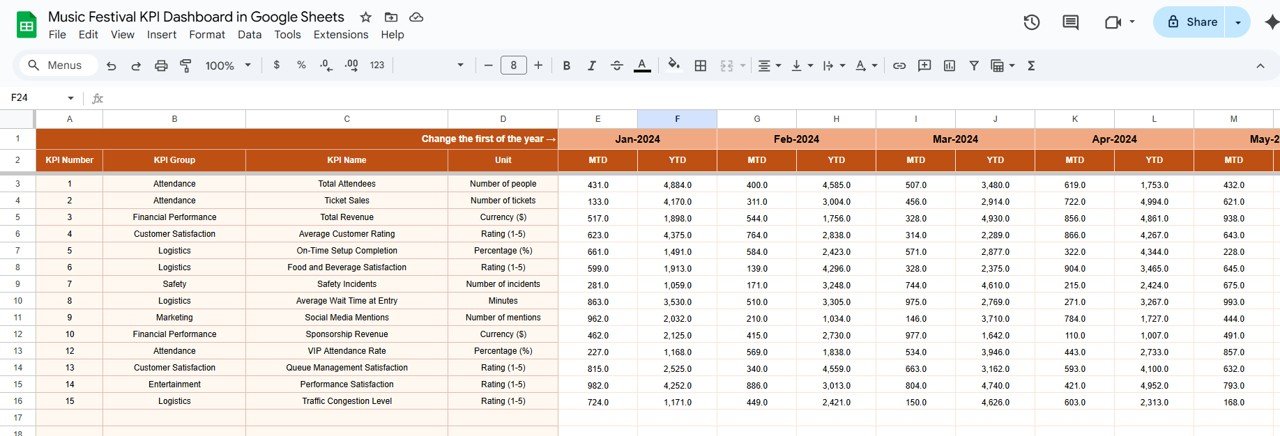
Enter actual KPI values for MTD and YTD.
Change the first month of the year (E1) to auto-adjust calculations.
Keeps your dashboard always up-to-date.
🎯 Target Sheet
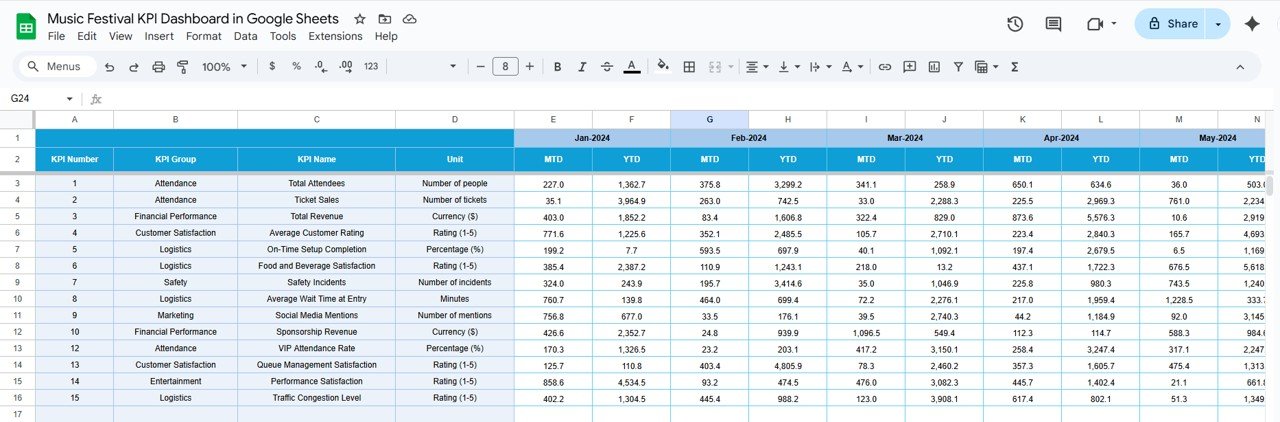
Define monthly and yearly targets for KPIs.
Compare actual numbers against planned goals.
Perfect for measuring success and spotting gaps early.
📊 Previous Year Numbers Sheet
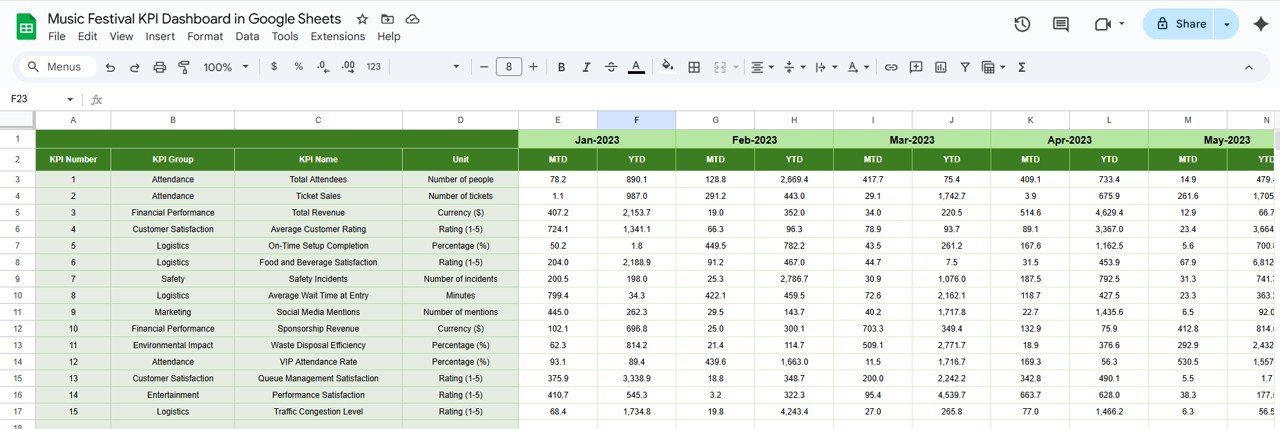
Input last year’s performance data.
Enables YOY (Year-over-Year) analysis to track growth.
Provides historical context for seasonality and trends.
📘 KPI Definition Sheet
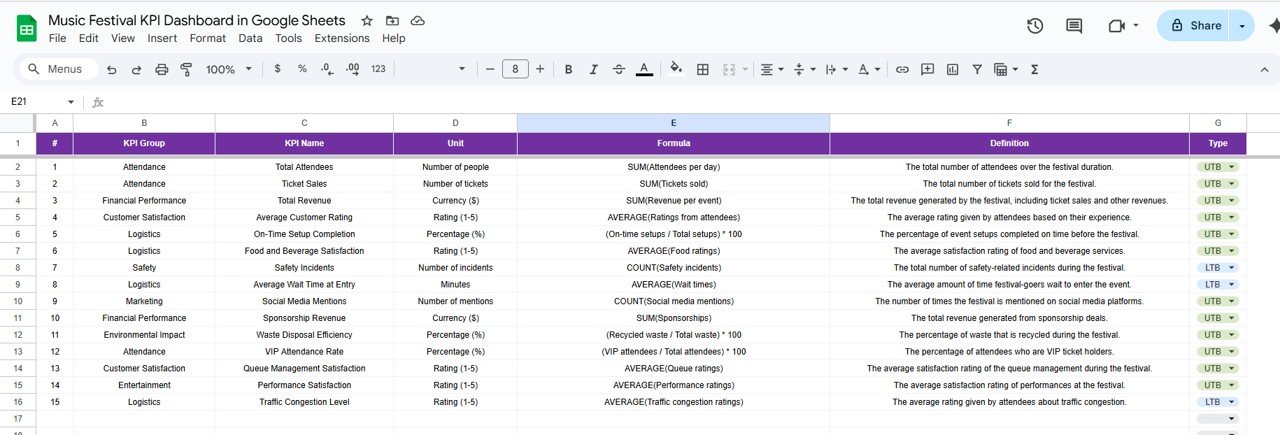
Includes KPI name, group, unit, formula, definition, and type.
Ensures all organizers, partners, and teams work with consistent metrics.
📦 What’s Inside the Dashboard?
✅ 6 Tabs – Dashboard, KPI Trend, Actual Numbers, Targets, Previous Year, KPI Definitions
✅ Pre-Configured KPIs – Ticket Sales, Attendance, Artist Performance, Revenue per Show, Satisfaction, Operational Costs, Marketing Effectiveness
✅ Visual Insights – Charts, arrows, and indicators for fast interpretation
✅ Sample Data – Preloaded for easy setup and understanding
✅ Customizable Layout – Add or remove KPIs to fit your festival needs
🎯 Who Can Benefit from This Dashboard?
🎶 Festival Organizers – Gain full control of performance tracking.
💼 Event Managers – Optimize scheduling, resources, and artist line-ups.
📊 Finance Teams – Monitor revenue, costs, and profitability.
📣 Marketing Teams – Measure campaign conversion and audience reach.
🌍 Large-Scale Festival Chains – Compare performance across multiple locations or stages.
🧠 How to Use the Music Festival KPI Dashboard
Input ticket sales, attendance, and engagement metrics into the Actual Numbers Tab.
Define goals in the Target Tab for both monthly and annual performance.
Enter historical data in the Previous Year Tab to track growth.
Review high-level insights on the Dashboard Tab.
Use the KPI Trend Tab for deeper analysis of individual KPIs.
Refer to the KPI Definition Tab for clarity on formulas and metrics.
🚀 Advantages of Using This Dashboard
Centralized Data – All festival metrics in one place.
Real-Time Updates – See instant results with every data entry.
Trend Analysis – Compare MTD, YTD, and previous year performance.
Target Tracking – Stay aligned with revenue and engagement goals.
Customizable – Adjust KPIs, charts, and definitions easily.
Decision Support – Back up every move with data-driven insights.
🔗 Click here to read the Detailed blog post
Watch the step-by-step video Demo: