


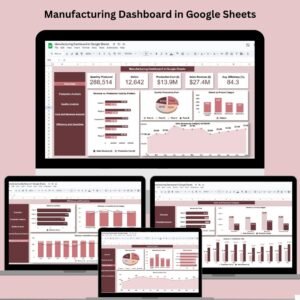
In today’s fast-paced manufacturing environment, real-time visibility into production, quality, and cost is not just helpful—it’s essential. That’s why we’ve created the Manufacturing Dashboard in Google Sheets, a ready-to-use, interactive dashboard that gives manufacturers instant access to key performance indicators across the production lifecycle.
Whether you’re a plant manager, production analyst, or business owner, this tool simplifies complex manufacturing data into actionable insights—all within Google Sheets.

📊 Key Features of the Manufacturing Dashboard
✅ 1. Overview Sheet Tab
The main control center of your dashboard—this sheet gives you high-level visibility through smart visualizations:
Quantity Produced: Units manufactured over time
Defects: Number of issues identified during production
Production Cost ($): Total manufacturing expenses
Sales Revenue ($): Revenue from product sales
Avg. Efficiency (%): Snapshot of operational performance
Charts Included:
Revenue vs. Production Cost by Product
Quantity Produced by Plant
Defects by Product Category
Sales Revenue by Category & Month
🏗️ 2. Production Analysis Sheet
Zoom into specific production performance using these key visualizations:
Quantity Produced by Product
Quantity Produced by Category
Monthly Production Trend
This sheet helps teams identify underperforming product lines and seasonal trends.
📦 3. Quality Analysis Sheet
Manage product and process quality with detailed insights:
Defects by Plant
Defects by Product Category
Defects by Product
Defects Trend Over Time
Perfect for pinpointing quality issues before they escalate.
💰 4. Cost & Revenue Analysis Sheet
Track profitability at every level:
Revenue by Plant
Revenue vs. Cost by Category
Revenue vs. Cost Monthly Trend
Use this sheet to identify cost-saving opportunities and profitable product lines.
⚙️ 5. Efficiency and Downtime Sheet
Focus on performance and time optimization:
Defects by Plant
Efficiency % vs. Downtime (hrs) by Category
Efficiency % vs. Downtime (hrs) by Month
This helps eliminate inefficiencies and improve plant-wide productivity.
📂 6. Data Sheet Tab
The source of all the insights—this raw data sheet powers the entire dashboard with editable fields for:
Date, Product, Plant, Quantity, Defects, Cost, Revenue, Efficiency, Downtime
Keep it updated regularly to maintain accurate visualizations.
🎯 Advantages of Using This Dashboard
📈 Real-Time Production Tracking
Keep your team updated with live performance indicators from anywhere.
💸 Cost Optimization
Track production cost vs. revenue to increase profitability.
📊 Better Decision-Making
Make informed, data-driven decisions with clearly visualized metrics.
🛠️ Customizable for Any Plant
Easily adjust charts, metrics, and layout based on your unique production setup.
🌐 Access Anywhere
Hosted in Google Sheets—no special software required.
🔧 Best Practices to Maximize Value
✅ Update regularly: Daily/weekly updates ensure data is always relevant.
🎯 Customize to your workflow: Tailor KPIs to reflect your plant’s goals.
🔍 Use conditional formatting: Quickly spot anomalies or quality issues.
📅 Track trends: Monthly production and defect charts highlight recurring patterns.
🚀 Opportunities for Improvement
Want to take your dashboard further?
🔗 Integrate with ERP systems: Pull live data automatically.
🧠 Add smart alerts: Notify supervisors when KPIs fall below targets.
📊 Use advanced charts: Upgrade with heat maps or 3D visuals in Data Studio or Looker.
👨🏭 Real-Life Applications
🏭 Plant Managers: Monitor output, quality, and costs in real-time
💼 Business Owners: Evaluate profitability and ROI by product line
👷 Quality Teams: Spot defects early and improve compliance
🔧 Operations Teams: Reduce downtime and boost performance
📥 What’s Included in Your Download
✔️ Pre-built Google Sheet with 6 dashboard tabs
📈 Pre-linked charts & formulas
💼 Ready-to-fill data sheet
🧭 Easy-to-navigate interface
🔗 Click here to read the Detailed blog post
Watch the step-by-step video Demo:






























Reviews
There are no reviews yet.