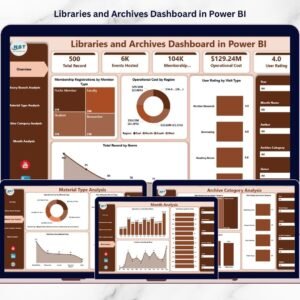

Modern libraries and archives manage far more than books. Today’s institutions handle digital collections, memberships, operational expenses, events, and user engagement simultaneously. However, when performance data remains scattered across spreadsheets and manual reports, administrators struggle to identify trends and make informed decisions.
The Libraries and Archives Dashboard in Power BI provides a powerful, ready-to-use analytics solution that transforms institutional data into interactive visual insights. Instead of spending hours preparing reports, library managers can monitor operations, analyze performance, and improve services using one centralized dashboard.
Built with dynamic visuals, slicers, and automated analytics, this dashboard helps institutions move toward smarter, data-driven library management.
⭐ Key Feature of Libraries and Archives Dashboard in Power BI
📊 Centralized Operational Monitoring – Track memberships, archives, costs, and engagement in one dashboard.
⚡ Interactive Power BI Visuals – Dynamic filtering with slicers and drill-down analysis.
📈 Real-Time Performance Insights – Automatically updated visuals after data refresh.
🏢 Branch Performance Comparison – Evaluate library locations easily.
📚 Material Usage Analytics – Understand resource demand and popularity.
🗂 Archive Engagement Tracking – Measure archive usage and event performance.
📅 Monthly Trend Analysis – Monitor seasonal patterns and operational changes.
🎯 Executive KPI Overview – Instant snapshot of institutional performance.
📂 What’s Inside the Libraries and Archives Dashboard in Power BI
The dashboard contains five analytical pages, each designed to answer specific operational questions.
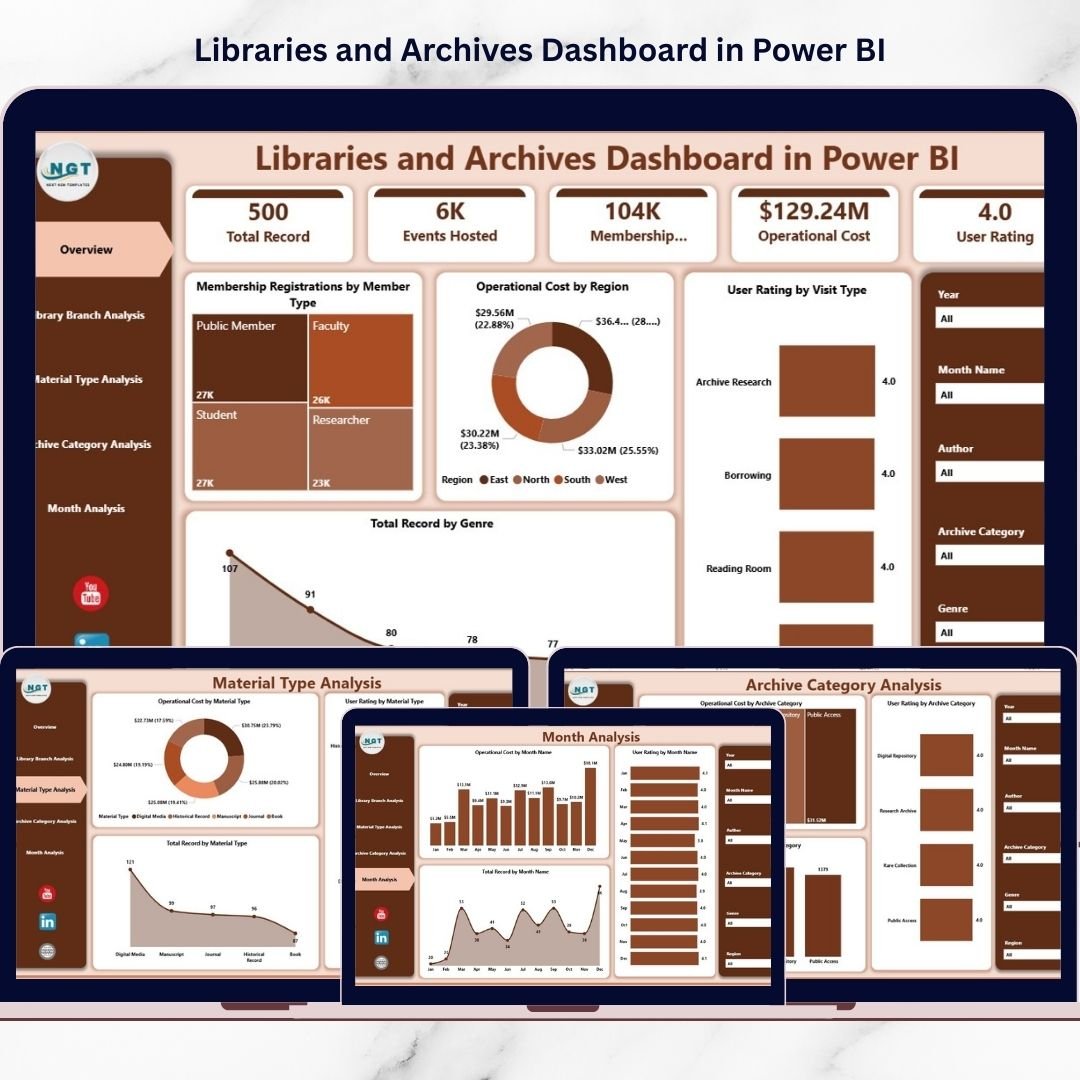
🏠 Overview Page – Instant Institutional Performance
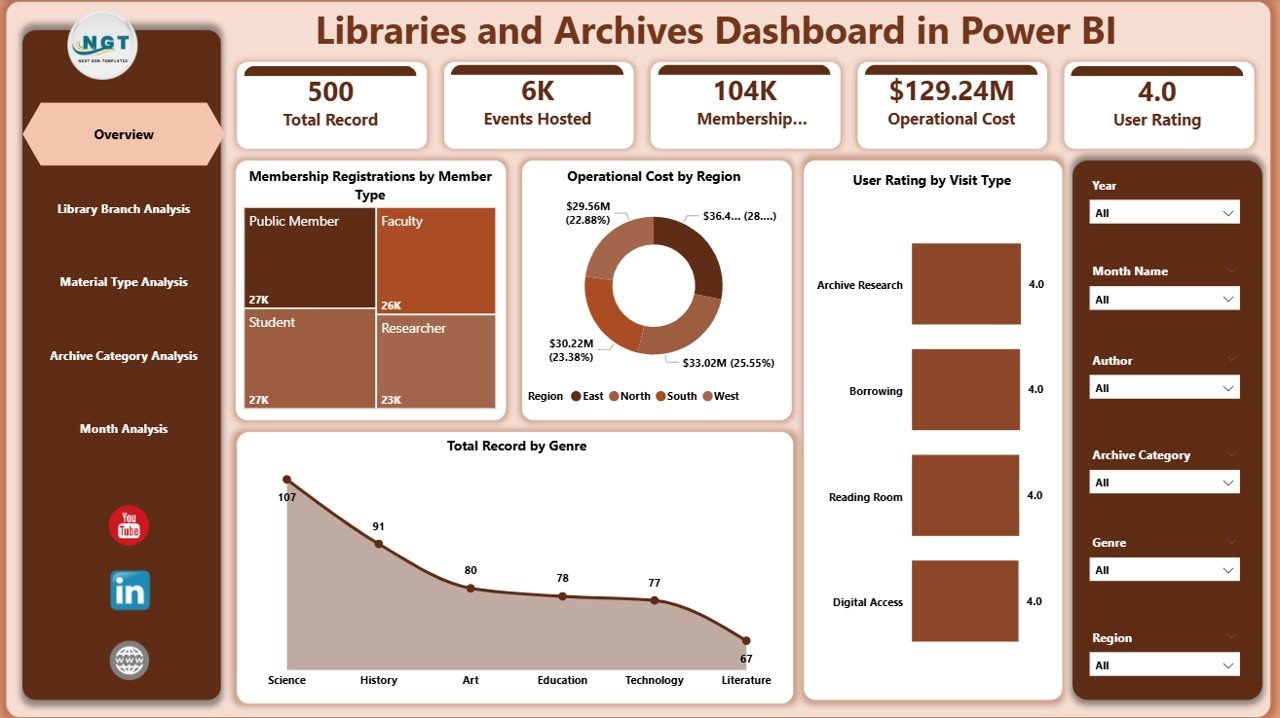
The Overview Page acts as the dashboard’s command center.
Key Visuals
Membership Registration by Member Type
Operating Cost by Region
User Rating by Visit Type
Total Records by Genre
Why It Matters
Provides instant performance visibility
Supports executive decision-making
Enables quick filtering using interactive slicers
Administrators can understand overall performance within seconds.
🏢 Library Branch Analysis – Compare Branch Performance
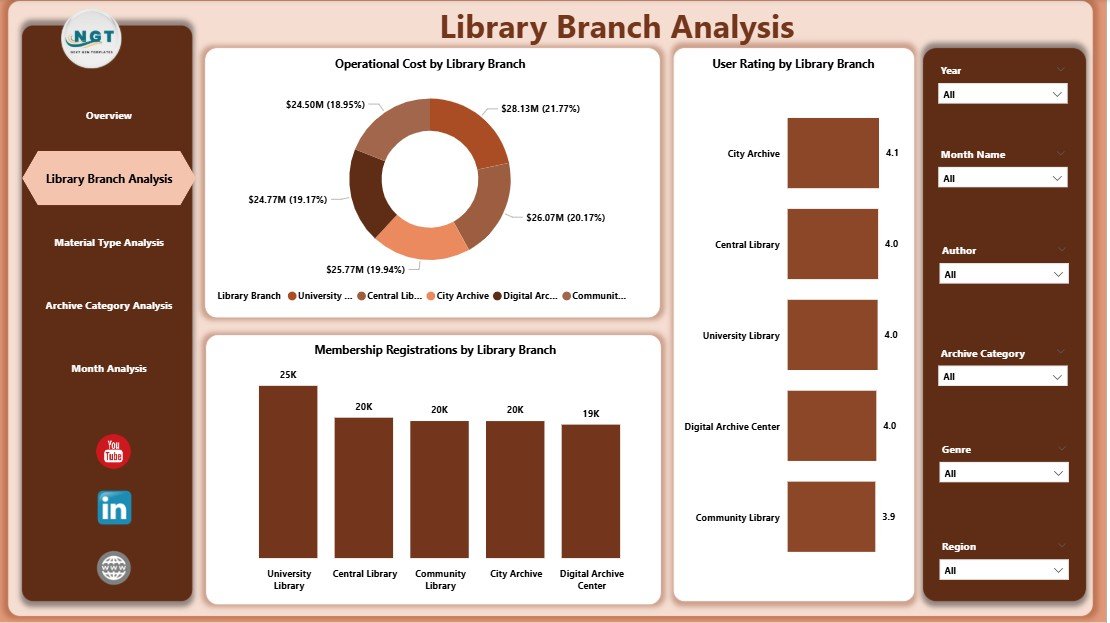
This page evaluates performance across multiple library locations.
Charts Included
Membership Registration by Library Branch
Operating Cost by Library Branch
User Rating by Library Branch
Insights You Gain
Identify top-performing branches
Detect cost inefficiencies
Compare user satisfaction across locations
Managers can allocate budgets and staff more effectively.
📚 Material Type Analysis – Resource Usage Insights
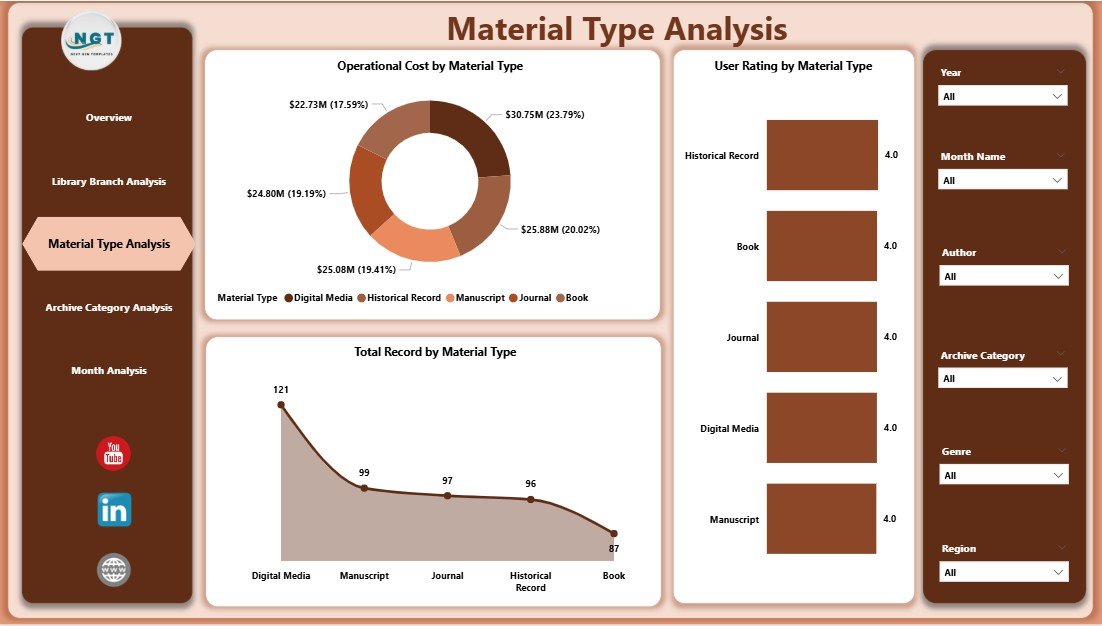
Libraries manage diverse material formats such as books, journals, manuscripts, and digital media.
Dashboard Visuals
Total Records by Material Type
Operating Cost by Material Type
User Rating by Material Type
Benefits
Understand user preferences
Optimize acquisition planning
Reduce spending on low-demand materials
This analysis aligns collections with community needs.
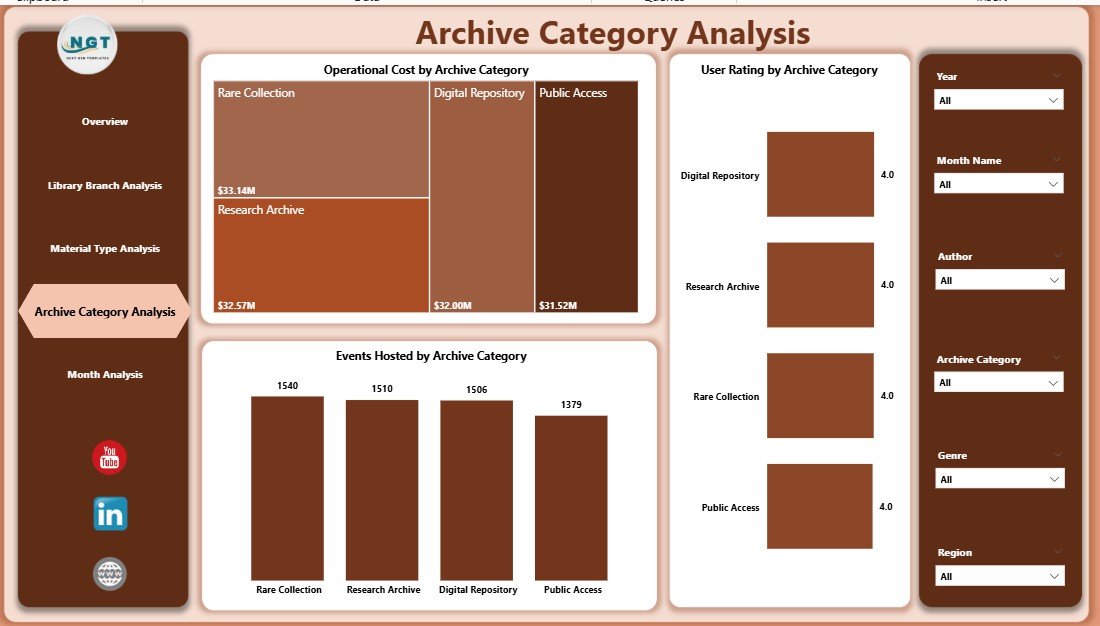
🗂 Archive Category Analysis – Archive Engagement Evaluation
Archives require careful monitoring to balance preservation costs and public engagement.
Charts Included
Event Hosting by Archive Category
Operating Cost by Archive Category
User Rating by Archive Category
Operational Value
Measure archival engagement
Evaluate cultural program success
Support preservation strategy decisions
Archivists can prioritize high-impact collections.
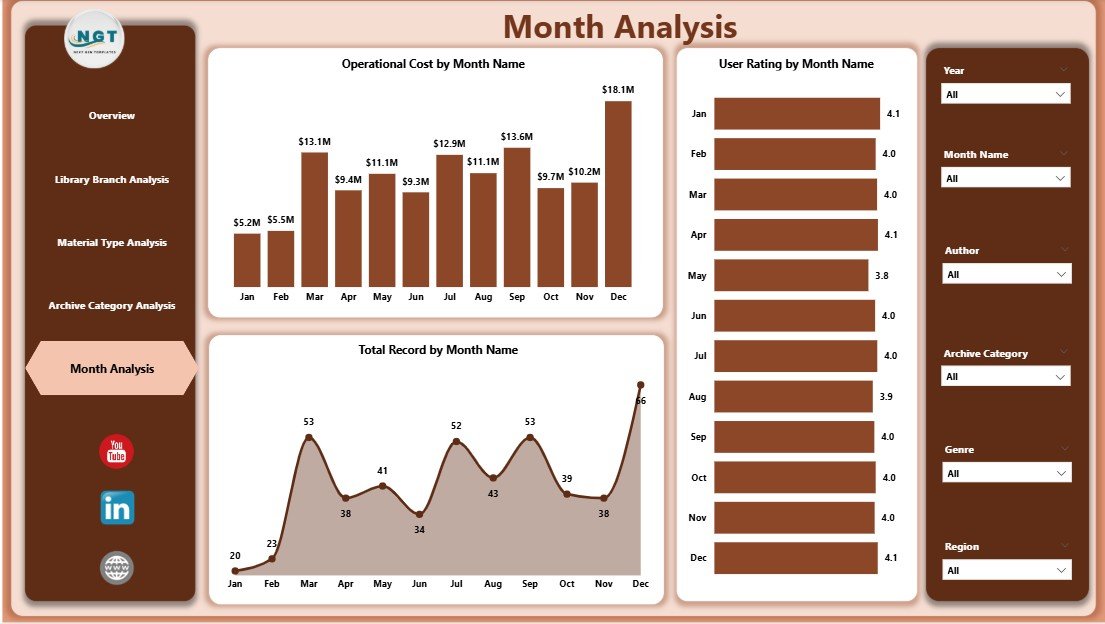
📅 Month Analysis – Performance Trends Over Time
The Month Analysis page reveals seasonal and operational patterns.
Monthly Metrics
Total Records by Month
Operating Cost by Month
User Rating by Month
Practical Outcomes
Forecast visitor demand
Plan seasonal programs
Control operational expenses
Institutions shift from reactive reporting to proactive planning.
🗂 Data Requirements
The dashboard works using structured datasets such as:
Library Branch
Member Type
Visit Type
Material Type
Archive Category
Operating Cost
Membership Records
User Ratings
Month / Date
Once connected, Power BI automatically generates interactive analytics.
🚀 How to Use the Libraries and Archives Dashboard in Power BI
1️⃣ Prepare institutional datasets
2️⃣ Clean and standardize data structure
3️⃣ Import data into Power BI
4️⃣ Apply relationships between tables
5️⃣ Explore insights using slicers and visuals
6️⃣ Share dashboards securely with stakeholders
No advanced coding skills are required.
👥 Who Can Benefit from This Dashboard
Library Administrators
Archive Managers
Educational Institutions
Government Cultural Departments
Research Centers
Community Libraries
Both technical and non-technical users can operate the dashboard easily.
✅ Advantages of Libraries and Archives Dashboard in Power BI
📊 Centralized analytics visibility
⏱ Faster reporting and decision-making
💰 Improved cost control and budgeting
👥 Enhanced user experience monitoring
📈 Data-driven strategic planning
🔄 Automated and real-time insights
🌐 Scalable institutional analytics solution
💡 Best Practices for Maximum Results
Maintain clean and consistent data
Track only actionable KPIs
Keep visuals simple and readable
Schedule regular data refresh
Train staff on dashboard usage
Validate metrics before publishing
🧠 How This Dashboard Improves Library Management
With automated analytics:
Staff update data once
Visuals refresh automatically
Leadership reviews insights instantly
Departments collaborate using shared analytics
As a result, libraries spend less time reporting and more time improving services.
🏁 Conclusion
The Libraries and Archives Dashboard in Power BI transforms traditional library reporting into modern institutional analytics. Instead of managing fragmented spreadsheets, organizations gain a centralized system that tracks memberships, operational costs, archive engagement, material usage, and performance trends in real time.
With five analytical pages — Overview, Library Branch Analysis, Material Type Analysis, Archive Category Analysis, and Month Analysis — administrators gain complete operational visibility.
Ultimately, this dashboard empowers libraries and archives to improve efficiency, enhance user satisfaction, and support long-term strategic growth through data-driven decision-making.
### Click hare to read the Detailed blog post
Visit our YouTube channel to learn step-by-step video tutorials
👉 Youtube.com/@PKAnExcelExpert