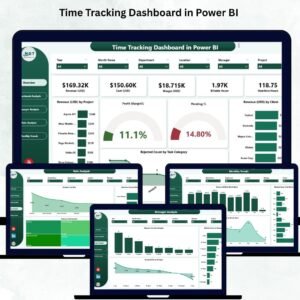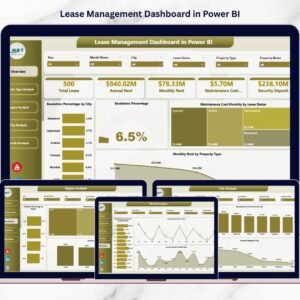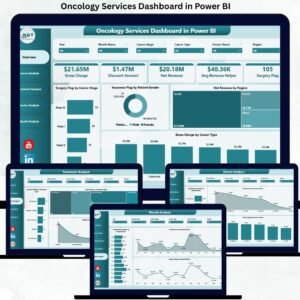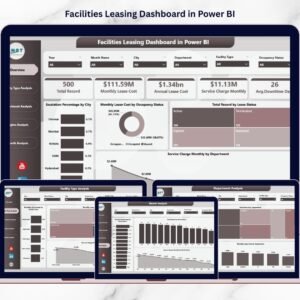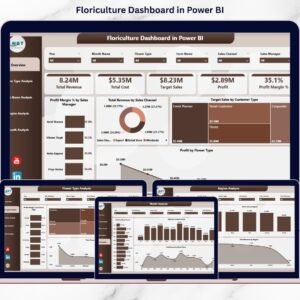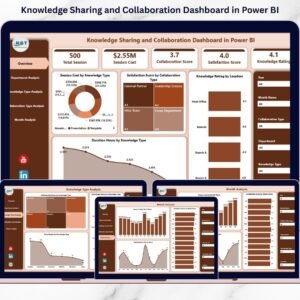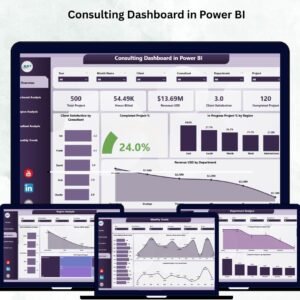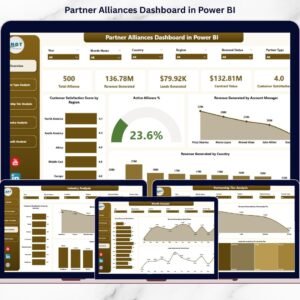
In today’s data-driven policy environment, think tanks must manage research programs, funding utilization, publications, regional activities, and policy impact simultaneously. However, when information is spread across multiple spreadsheets and manual reports, organizations struggle to gain clear insights and make timely strategic decisions.
The Think Tanks Dashboard in Power BI provides a modern, centralized analytics solution that transforms complex research data into interactive visual intelligence. Instead of compiling reports manually, decision-makers can monitor performance instantly through dynamic dashboards, KPI visuals, and real-time analytics.
This ready-to-use Power BI dashboard helps research organizations improve transparency, optimize funding strategies, and strengthen policy outcomes using structured data visualization.
⭐ Key Feature of Think Tanks Dashboard in Power BI
📊 Centralized Research Analytics – Monitor funding, publications, regions, and policy impact in one platform.
⚡ Interactive Power BI Visuals – Dynamic charts update instantly with slicer selections.
🎯 Executive KPI Cards – Get quick organizational performance summaries.
🌍 Regional Performance Analysis – Compare research output across locations.
💰 Funding Source Insights – Evaluate funding effectiveness and allocation impact.
📚 Research Area Tracking – Identify high-impact policy domains.
📅 Monthly Trend Monitoring – Analyze performance changes over time.
🔄 Automatic Data Refresh – Always work with updated analytics.
📂 What’s Inside the Think Tanks Dashboard in Power BI
The dashboard includes five powerful analytical pages, each designed to answer critical organizational questions.
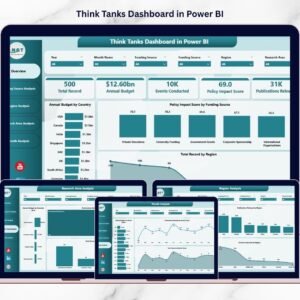
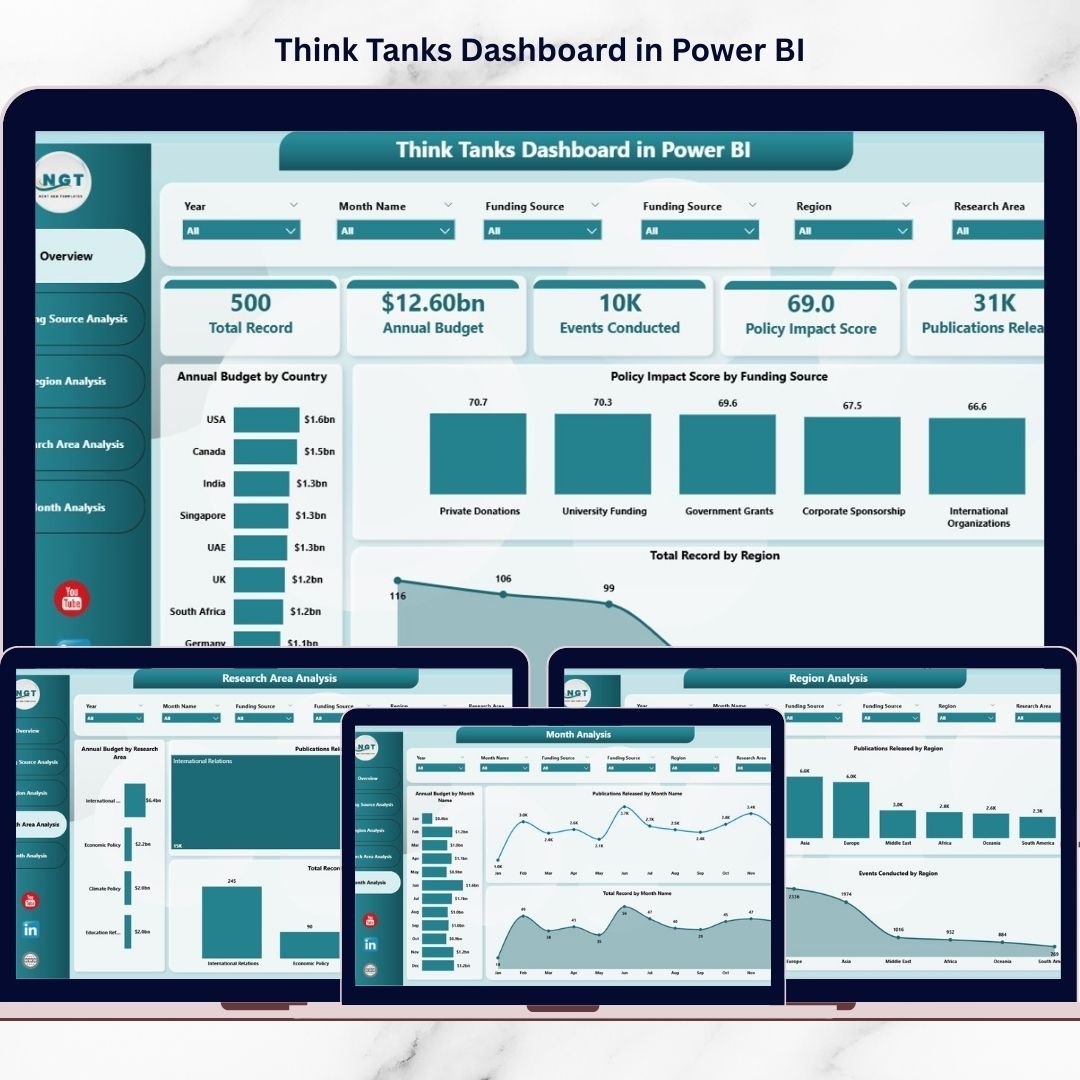
🏠 Overview Page – Organizational Performance Snapshot
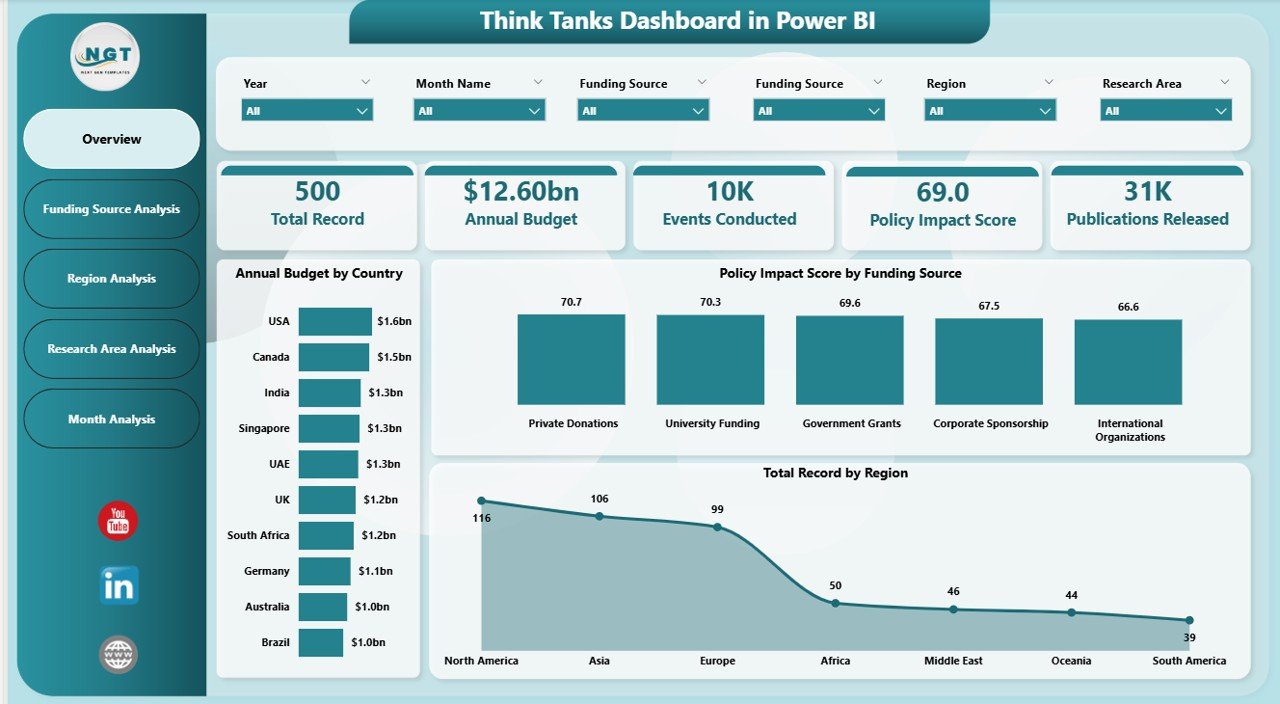
The Overview Page acts as the central command center for leadership.
Main Components
Interactive slicers for filtering data
KPI performance cards
High-level analytical visuals
Key Visuals
Annual Budget by Country
Policy Impact Score by Funding Source
Total Records by Region
Performance summary indicators
This page enables executives to understand performance instantly without reviewing multiple reports.
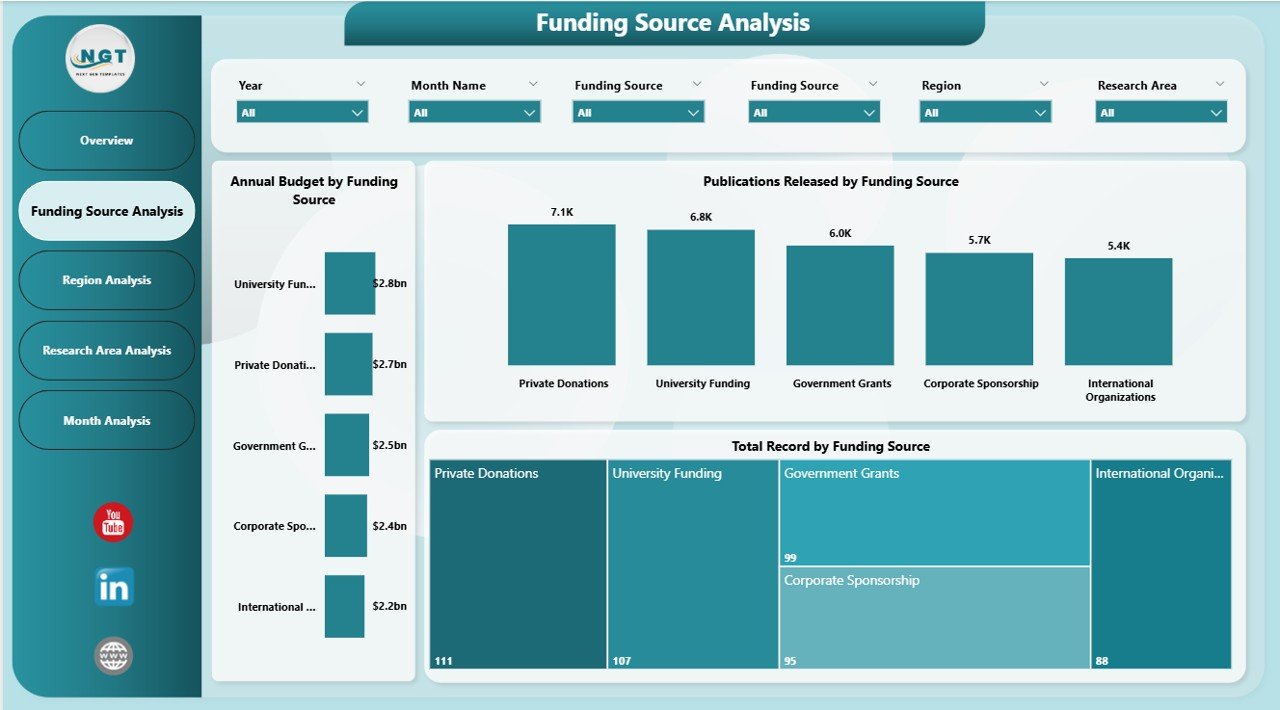
💰 Funding Source Analysis – Funding Effectiveness Insights
Funding drives research output and policy influence. This page evaluates funding performance clearly.
Charts Included
Annual Budget by Funding Source
Total Records by Funding Source
Publications Released by Funding Source
Insights Generated
Which funding sources drive results
Relationship between funding and publications
Donor effectiveness analysis
Organizations can optimize funding strategies using data-backed insights.
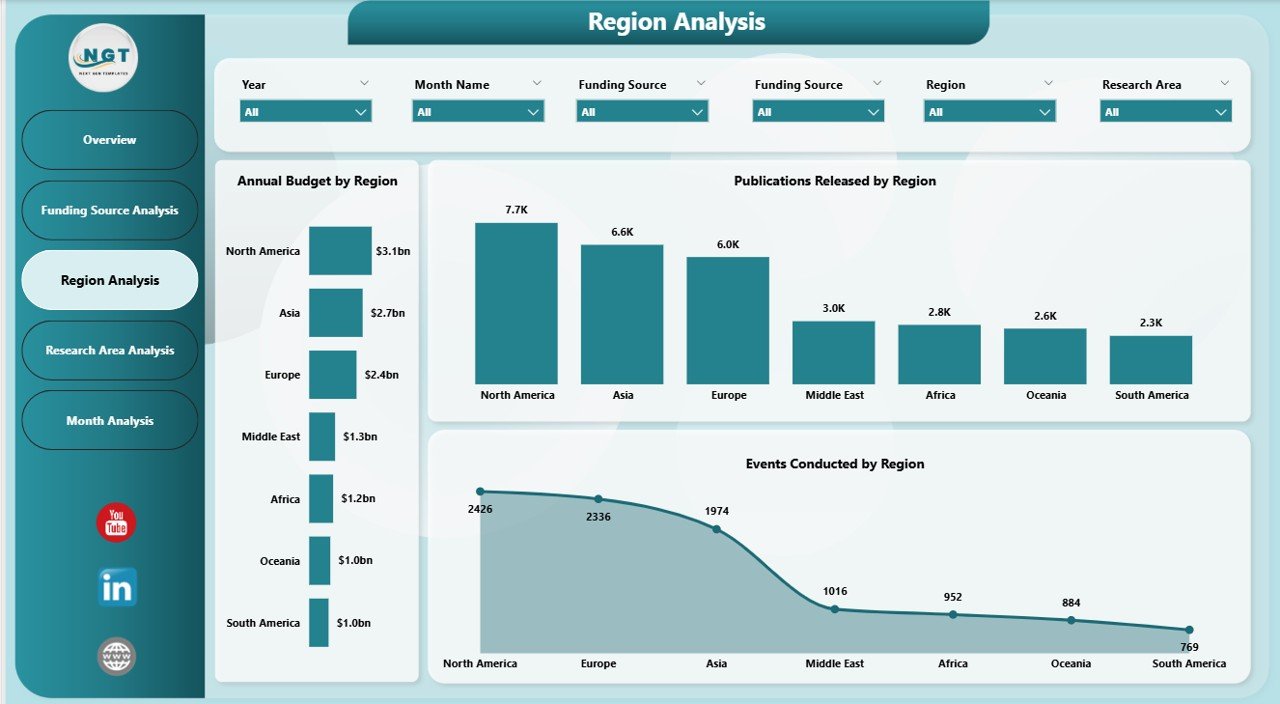
🌍 Region Analysis – Geographic Performance Evaluation
Designed for organizations operating across multiple regions.
Key Charts
Annual Budget by Region
Events Conducted by Region
Publications Released by Region
Benefits
Identify high-performing regions
Compare research productivity geographically
Improve regional investment planning
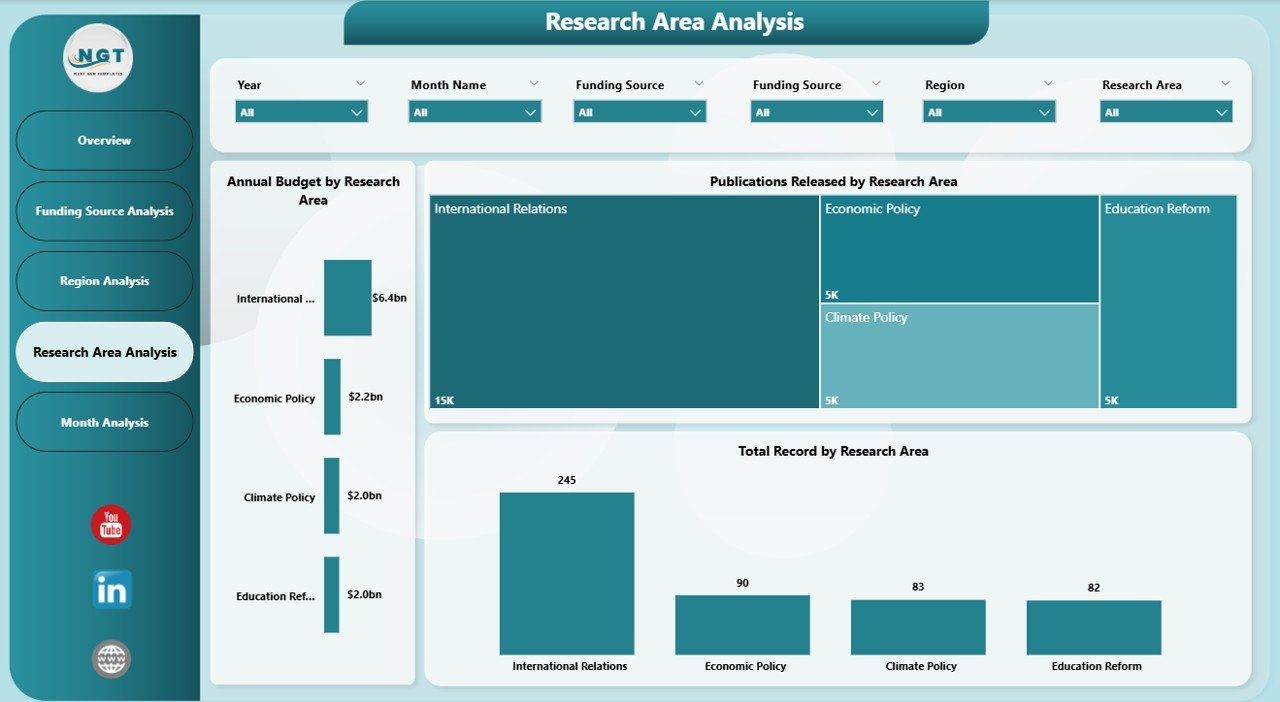
🧠 Research Area Analysis – Policy Topic Performance
Research domains determine strategic direction. This page evaluates performance by research area.
Visuals Included
Annual Budget by Research Area
Total Records by Research Area
Publications Released by Research Area
Insights
Most impactful research topics
Funding distribution by domain
Publication productivity trends
Leadership can prioritize initiatives that create measurable policy influence.
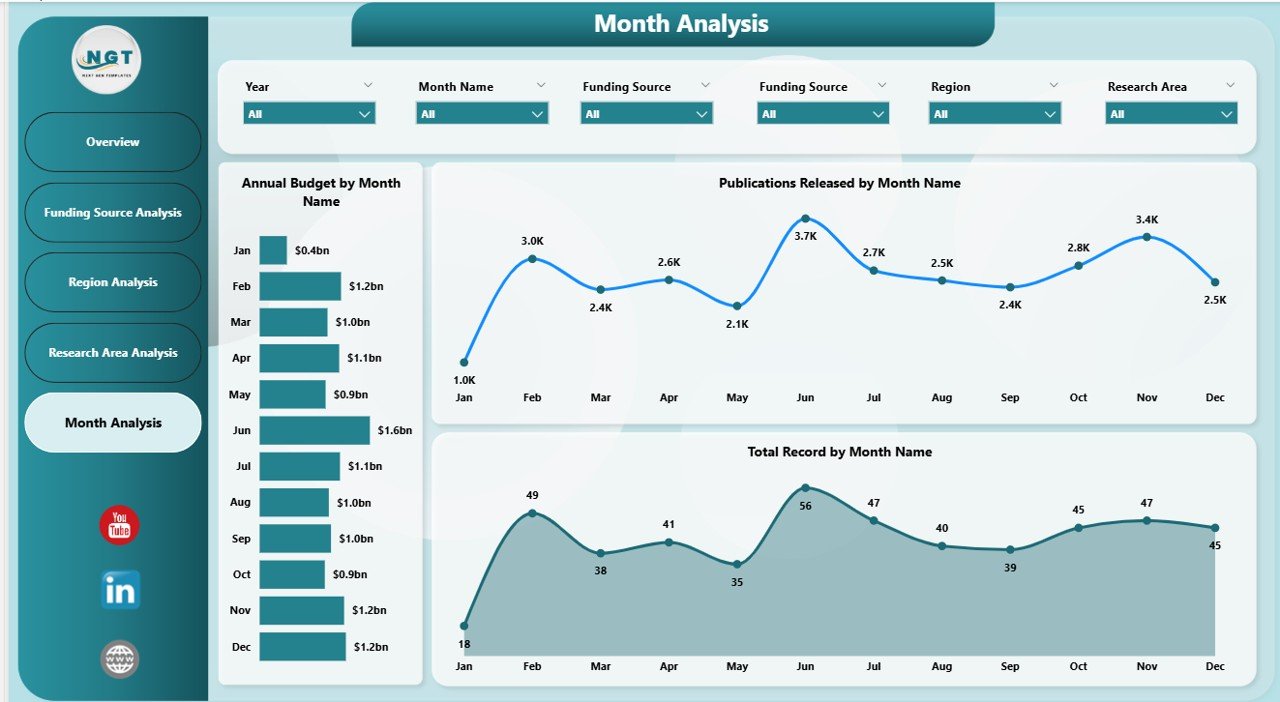
📅 Month Analysis – Time-Based Performance Trends
Trend analysis helps forecast organizational performance.
Charts Included
Annual Budget by Month
Total Records by Month
Publications Released by Month
What You Learn
Seasonal research activity patterns
Publication cycles
Monthly funding behavior
This analysis supports better planning and forecasting.
🗂 Data Requirements
The dashboard works using structured datasets such as:
Country
Region
Funding Source
Research Area
Publication Count
Event Details
Budget Allocation
Policy Impact Score
Month / Date
Once connected, Power BI automatically generates interactive analytics.
🚀 How to Use the Think Tanks Dashboard in Power BI
1️⃣ Import structured datasets into Power BI
2️⃣ Validate relationships between tables
3️⃣ Refresh data connections
4️⃣ Apply slicers for analysis
5️⃣ Review insights across analytical pages
6️⃣ Take data-driven strategic actions
👥 Who Can Benefit from This Dashboard
Policy Research Organizations
Non-Profit Think Tanks
Government Advisory Bodies
Academic Research Institutes
International Development Agencies
Strategy & Policy Consultants
Both technical and non-technical users can easily operate the dashboard.
✅ Advantages of Think Tanks Dashboard in Power BI
📊 Unified performance monitoring
⚡ Faster executive decision-making
🔍 Interactive data exploration
💰 Improved funding transparency
📈 Better research accountability
🔄 Real-time analytics visibility
🌐 Scalable enterprise-level reporting
💡 Best Practices for Maximum Value
Define clear KPIs (publications, funding utilization, policy impact)
Maintain clean and standardized datasets
Use consistent naming conventions
Avoid overcrowded visuals
Schedule regular data refresh cycles
Focus dashboards on storytelling insights
🧠 How This Dashboard Improves Research Management
With automated analytics:
Analysts update data once
Visuals refresh automatically
Leadership reviews insights instantly
Stakeholders access shared dashboards
As a result, teams spend less time reporting and more time influencing policy outcomes.
🏁 Conclusion
The Think Tanks Dashboard in Power BI transforms research management by converting complex datasets into actionable intelligence. Instead of relying on manual reporting, organizations gain a centralized analytical environment that tracks funding, publications, regional performance, and policy impact in real time.
With its structured five-page design — Overview, Funding Source Analysis, Region Analysis, Research Area Analysis, and Month Analysis — leaders gain complete organizational visibility.
Ultimately, this dashboard empowers think tanks to make faster, smarter, and more transparent policy decisions using data-driven insights.
### Click hare to read the Detailed blog post
Visit our YouTube channel to learn step-by-step video tutorials
👉 Youtube.com/@PKAnExcelExpert