

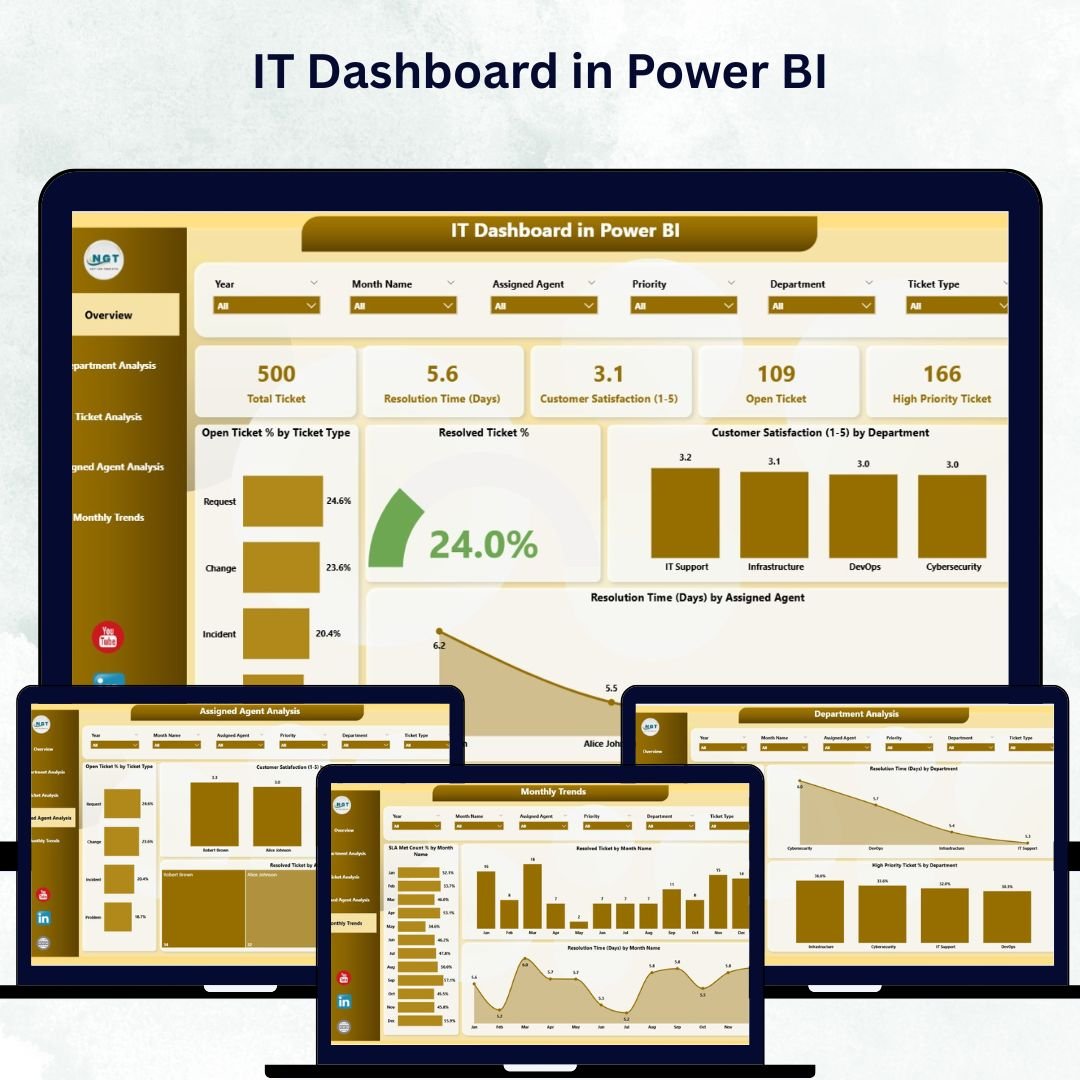

In today’s tech-driven world, IT teams are the backbone of every organization — ensuring smooth operations, quick support, and system reliability. But when performance data is scattered across tools, it becomes difficult to track results, spot trends, and make fast decisions.
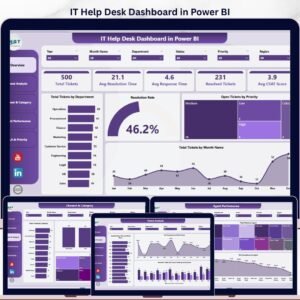
That’s where the IT Dashboard in Power BI comes in — a powerful, interactive solution that brings all your IT metrics into one dynamic view. With this ready-to-use Power BI template, you can track tickets, monitor SLAs, analyze agent performance, and measure customer satisfaction — all in real time and from a single dashboard.
Designed for IT leaders, helpdesk managers, and analysts, this dashboard delivers data-driven insights to help you identify recurring issues, manage workloads efficiently, and enhance service quality without manual reporting.
🚀 Key Features of IT Dashboard in Power BI
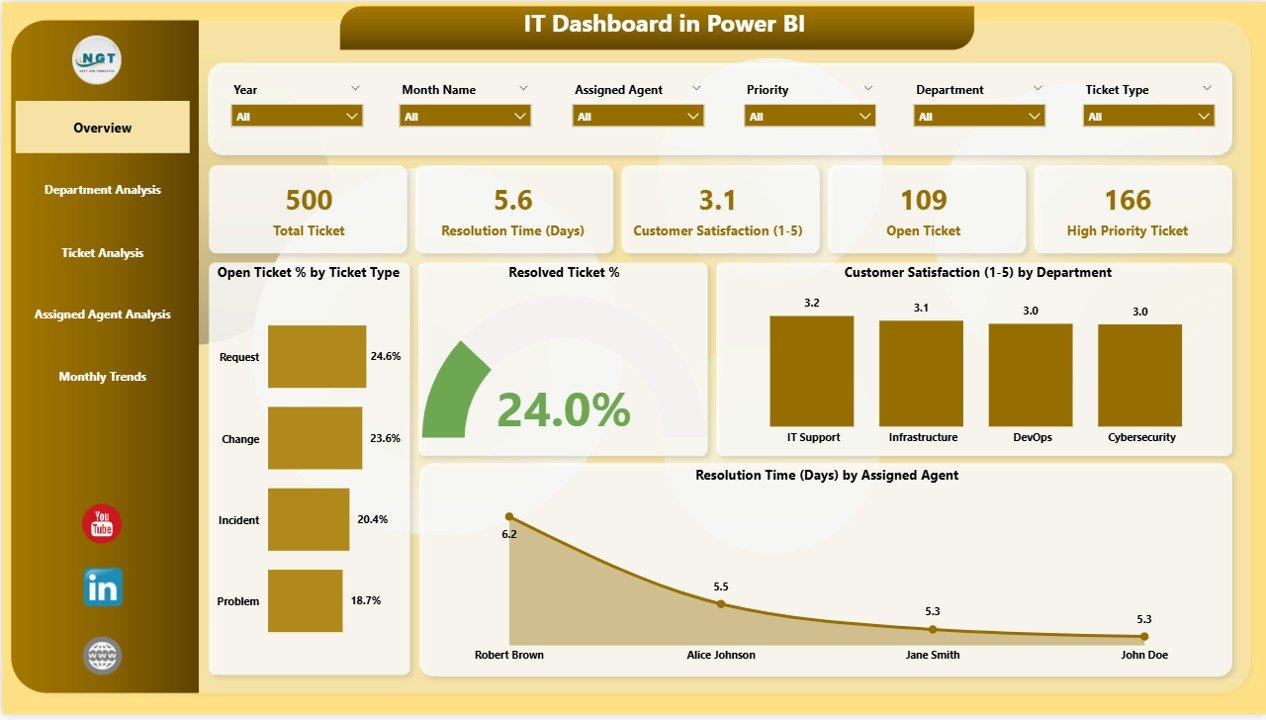
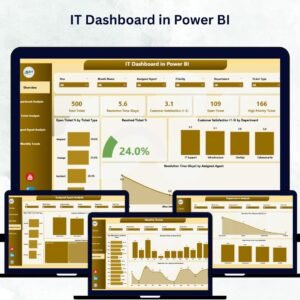
✅ 📊 Five Analytical Pages – Gain full control with 5 detailed pages: Overview, Department Analysis, Ticket Analysis, Assigned Agent Analysis, and Monthly Trends.
✅ 💡 Real-Time IT Insights – Monitor open vs resolved tickets, SLA adherence %, and satisfaction ratings using live, interactive visuals.
✅ 🎯 KPI Cards – Instantly track top KPIs such as Open Ticket %, Resolved Ticket %, SLA Met %, and Customer Satisfaction Score.
✅ 🧭 Smart Filters & Slicers – Filter by department, agent, month, or ticket type to dive deeper into specific data points.
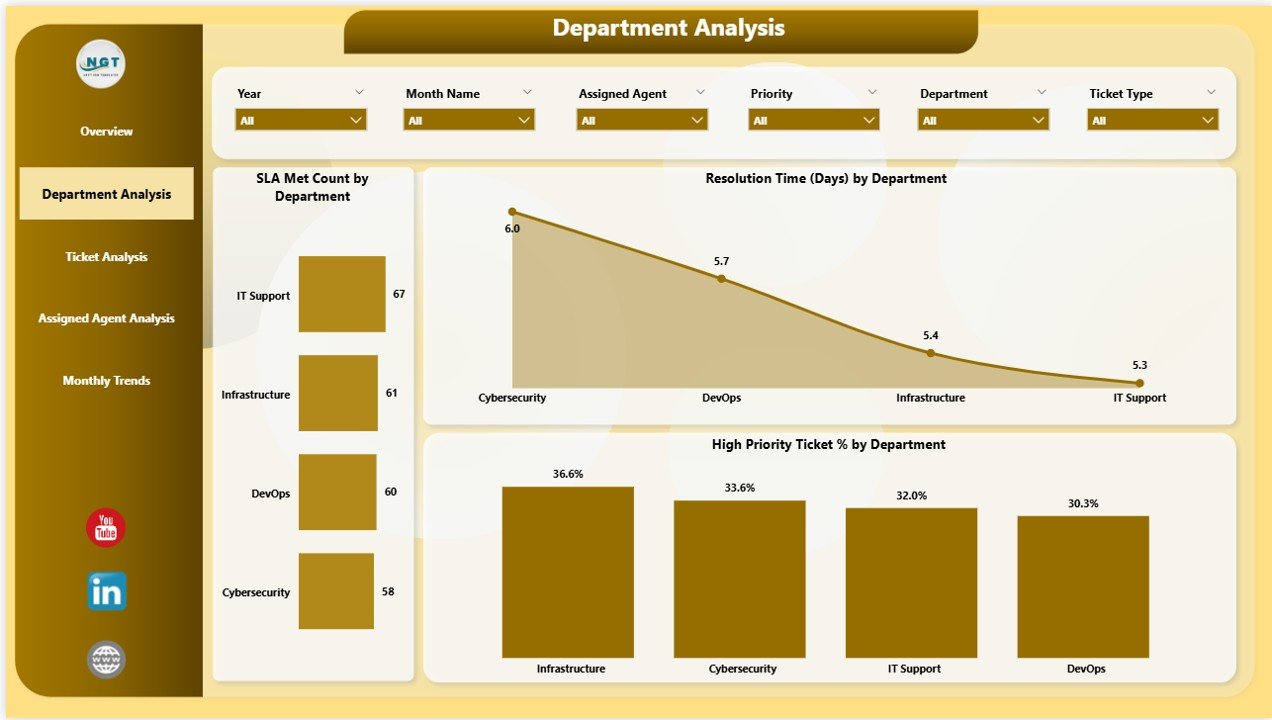
✅ 👩💻 Department Performance View – Compare ticket load, SLA compliance, and resolution times by department to identify process gaps.
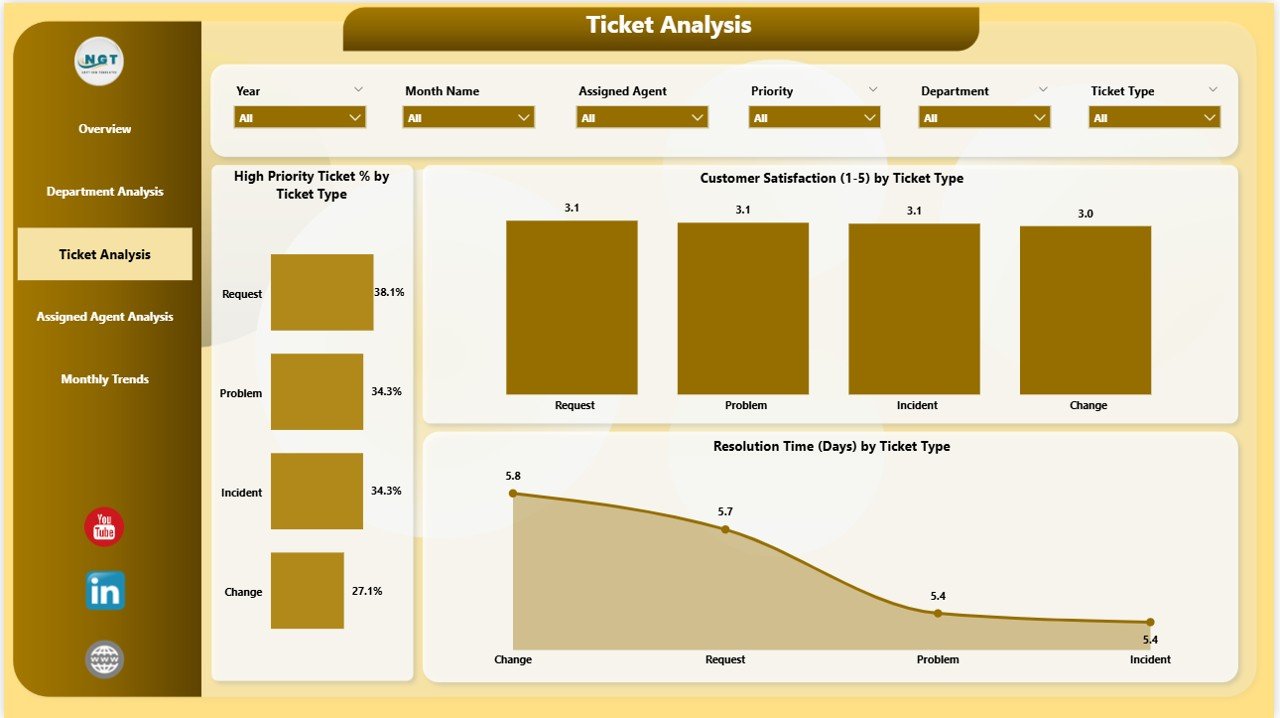
✅ 🧾 Ticket Analysis Page – See which categories take the longest to resolve, and where customer satisfaction is highest.
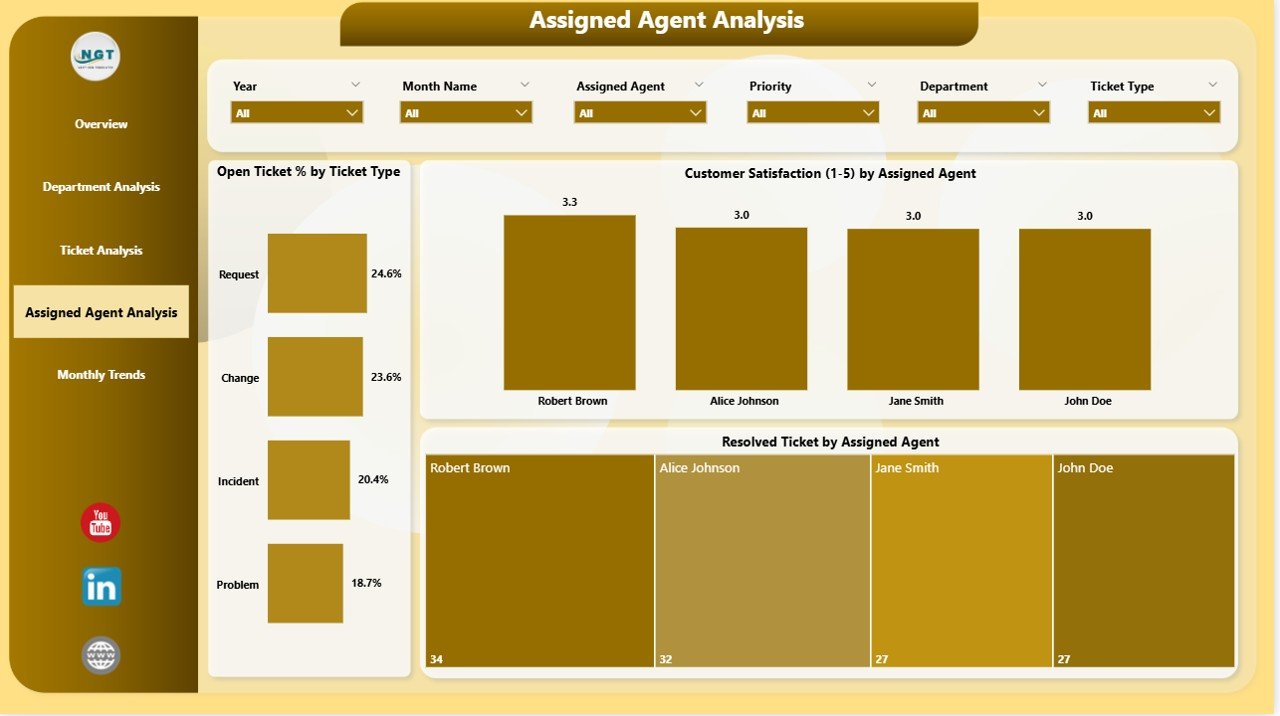
✅ 👥 Agent-Wise Analysis – Evaluate each agent’s performance, including workload, average resolution time, and satisfaction score — perfect for recognition or training.
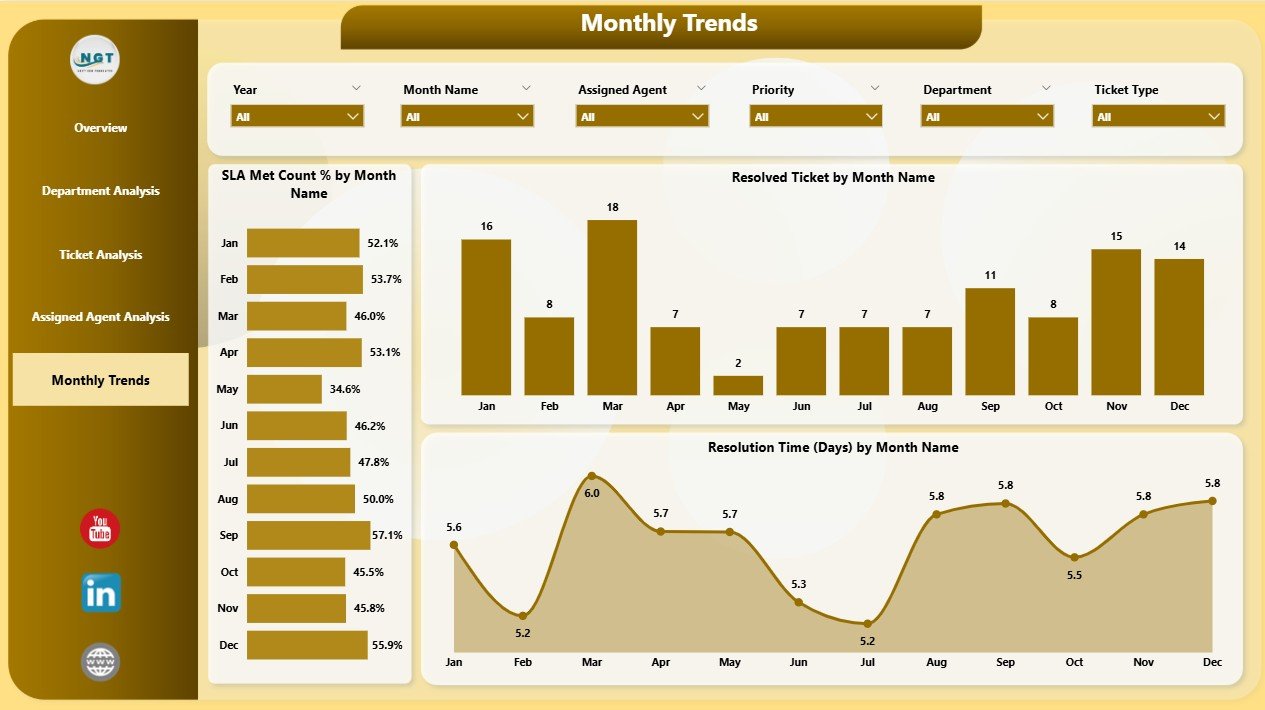
✅ 📆 Monthly Trends – Visualize changes in SLA performance and ticket resolution patterns throughout the year.
✅ ⚙️ Excel-Integrated Data Source – The dashboard pulls its data from an Excel sheet, making it simple to maintain, refresh, and customize.
✅ 🔒 Secure & Scalable – Add role-based access control and grow the dashboard as your IT operations expand.
💼 What’s Inside the IT Dashboard in Power BI
Inside this professional Power BI file, you’ll find everything pre-built and structured for maximum efficiency:
📁 Overview Page – The main snapshot of IT performance with 5 KPIs and 4 charts: Open Ticket % by Type, Resolved %, Customer Satisfaction by Department, and Resolved Time by Agent.
📁 Department Analysis Page – Drill down into SLA Met Count, Resolved Days, and High-Priority Ticket % across departments.
📁 Ticket Analysis Page – Understand category performance with visuals for High Priority Tickets, Satisfaction by Ticket Type, and Average Resolution Time.
📁 Assigned Agent Analysis Page – View workload balance, open ticket ratios, and satisfaction scores for each agent.
📁 Monthly Trends Page – Track SLA Met %, Resolved Tickets, and Resolution Time month by month for performance forecasting.
All visuals are fully dynamic — simply refresh your data to update the entire dashboard automatically.
🧭 How to Use the IT Dashboard in Power BI
1️⃣ Open Power BI Desktop and load your Excel dataset.
2️⃣ Navigate between pages using the sidebar for focused insights.
3️⃣ Use Slicers to filter data by department, agent, or month.
4️⃣ Analyze KPIs and trends using charts and visuals.
5️⃣ Drill Through to see detailed information on tickets or agents.
6️⃣ Share Reports securely across your organization for transparent IT performance tracking.
In minutes, you’ll have a live, data-driven IT dashboard ready to present in meetings or monitor daily operations.
👨💼 Who Can Benefit from This IT Dashboard in Power BI
💼 IT Managers – Monitor service levels, identify issues, and allocate resources efficiently.
🧾 Helpdesk Teams – Track and improve resolution speed and workload balance.
📊 Executives – Get high-level visibility into IT health and user satisfaction.
💡 Service Desk Analysts – Review personal metrics and improve performance.
🏢 Business Leaders – Understand how IT performance drives organizational efficiency.
Whether you manage a small support team or a full IT department, this dashboard will help you make faster, smarter, and more confident decisions backed by data.
🔗 Click here to read the Detailed blog post
📺 Visit our YouTube channel to learn step-by-step video tutorials
👉 YouTube.com/@PKAnExcelExpert
Watch the step-by-step video tutorial:
Compatibility and Requirements
- Works in Power BI Desktop, which is free to download from Microsoft. Get it from Get Power BI Desktop.
- The dashboard reads its data from an Excel sheet, so you need Excel to edit the source data.
Frequently Asked Questions
Which pages are included?
Five pages: Overview, Department Analysis, Ticket Analysis, Assigned Agent Analysis and Monthly Trends.
Where does the data come from?
The dashboard pulls its data from an Excel sheet. Add or change your records there, then refresh the report in Power BI Desktop to update every visual.
Which KPIs does it show?
The Overview page has KPI cards for Open Ticket %, Resolved Ticket %, SLA Met % and Customer Satisfaction Score.
Can I filter by department, agent or month?
Yes. Slicers let you filter by department, agent, month or ticket type, and you can drill through to see details on tickets or agents.
Can I see how each agent is performing?
Yes. The Assigned Agent Analysis page shows workload, open ticket ratios and satisfaction scores for each agent, and the Overview page includes Resolved Time by Agent.
Related Power BI Dashboard Templates
- Procurement Dashboard in Power BI: another operations dashboard on the same platform
- Resource Allocation Dashboard in Power BI: workload and capacity by team
- Training and Development Dashboard in Power BI: track team training and skills
- IT and Cybersecurity Operations Bundle: 8 Excel and Power BI templates for IT teams
- Power BI Dashboard Mega Collection: 15 Power BI templates in one download
Browse all Power BI dashboards.
















Reviews
There are no reviews yet.