

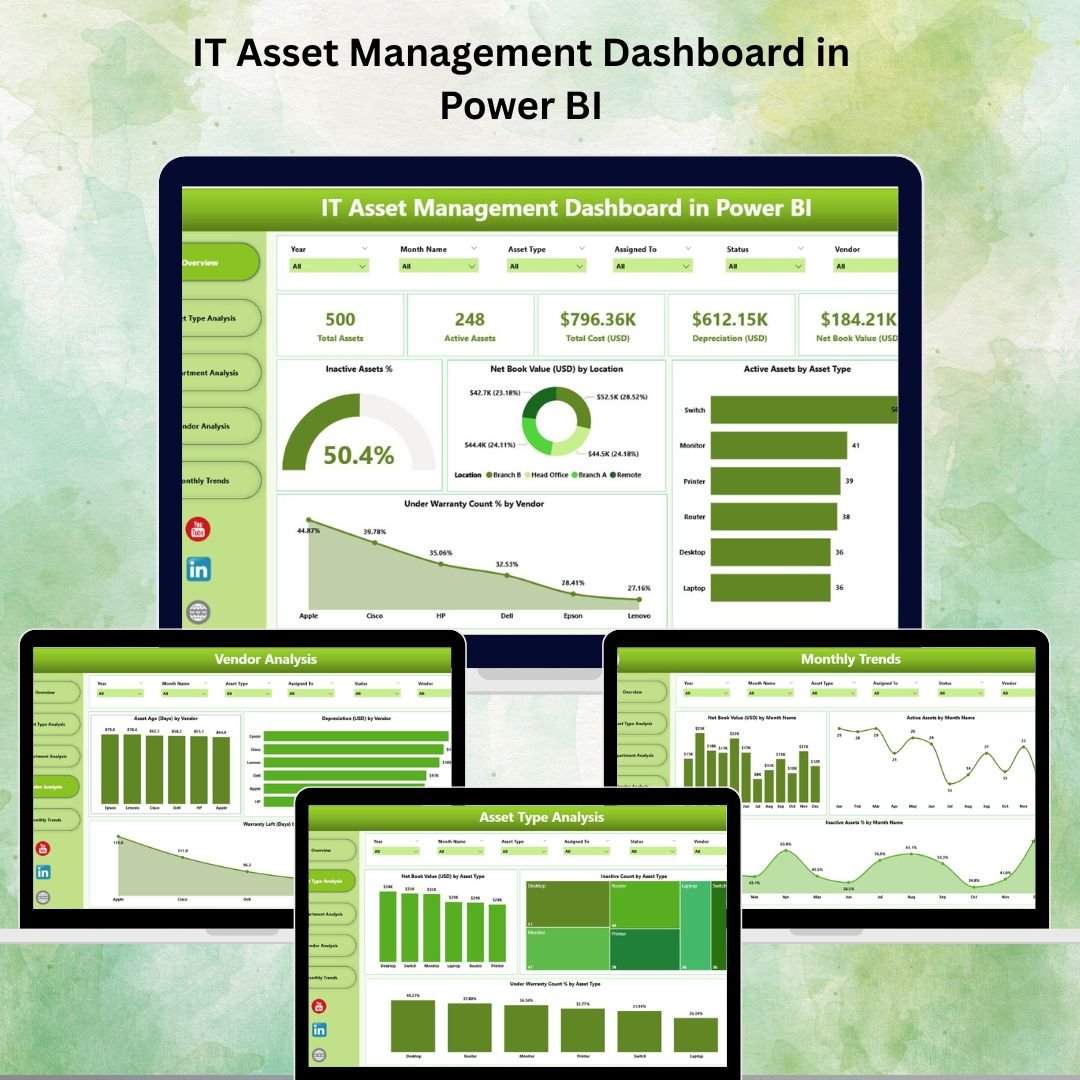

📊 IT Asset Management Dashboard in Power BI – Track, Analyze & Optimize Your IT Assets
Managing IT assets effectively is crucial in today’s tech-driven world. From laptops and servers to networking gear and software licenses, every asset impacts cost, compliance, and operational efficiency. Our IT Asset Management Dashboard in Power BI is a ready-to-use, interactive solution designed to give you complete visibility into your IT asset lifecycle – all in one centralized place.
With its sleek interface, real-time updates, and deep analytics, this dashboard empowers businesses to track asset performance, manage warranties, optimize spending, and improve vendor relationships with ease. Whether you’re a small business or a large enterprise, this tool provides the insights you need to make smarter, data-driven decisions.
✨ Key Features of IT Asset Management Dashboard in Power BI
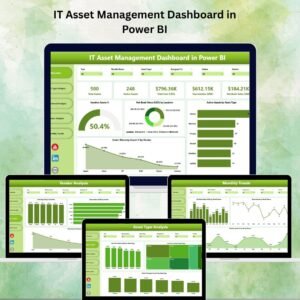
✅ 5 Powerful Analytical Pages – Overview, Asset Type Analysis, Department Analysis, Vendor Analysis, and Monthly Trends.
✅ Interactive Slicers – Filter data instantly by asset type, department, vendor, location, warranty status, and date range.
✅ KPI Cards for Quick Insights – View Active/Inactive Assets, Net Book Value, Assets Under Warranty, and Total Count in seconds.
✅ Drill-Through Analysis – Click on visuals to explore deeper asset-level details.
✅ Vendor Performance Tracking – Evaluate suppliers based on cost, warranty, and reliability.
✅ Warranty Management – Never miss an expiry with warranty tracking by asset type and vendor.
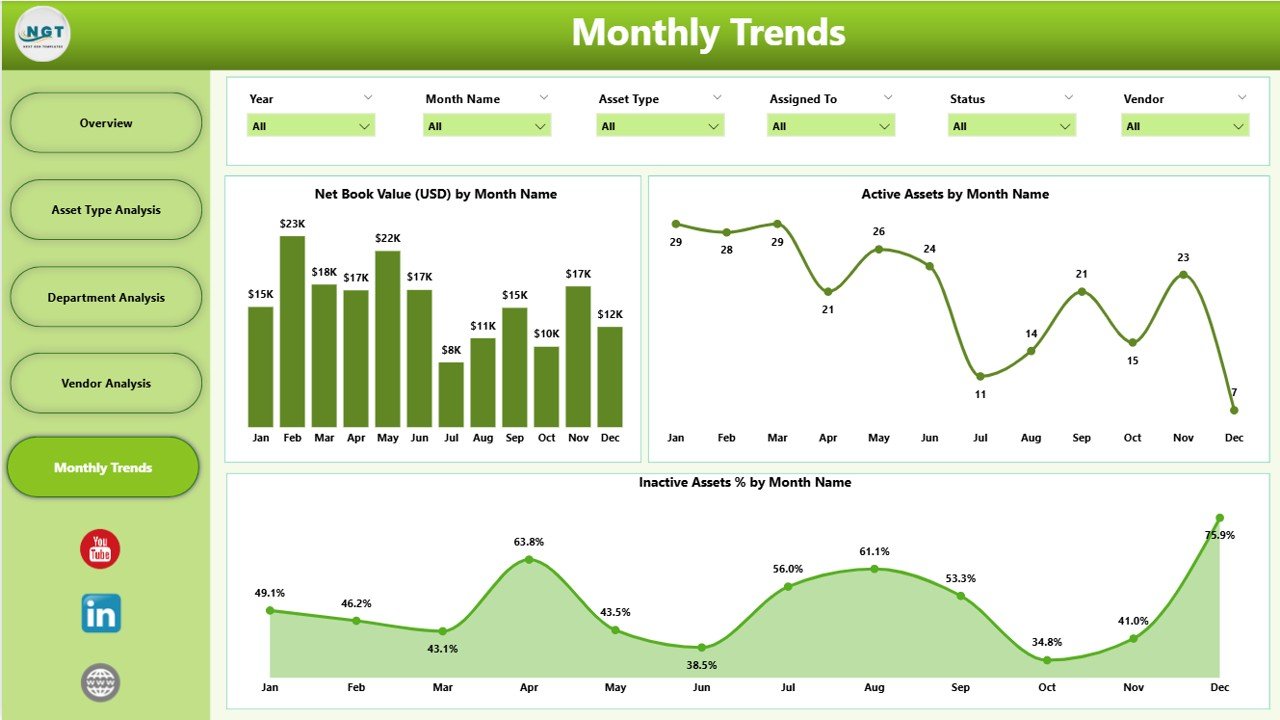
✅ Monthly Trend Analysis – Spot usage patterns and cost changes over time.
📂 What’s Inside the IT Asset Management Dashboard
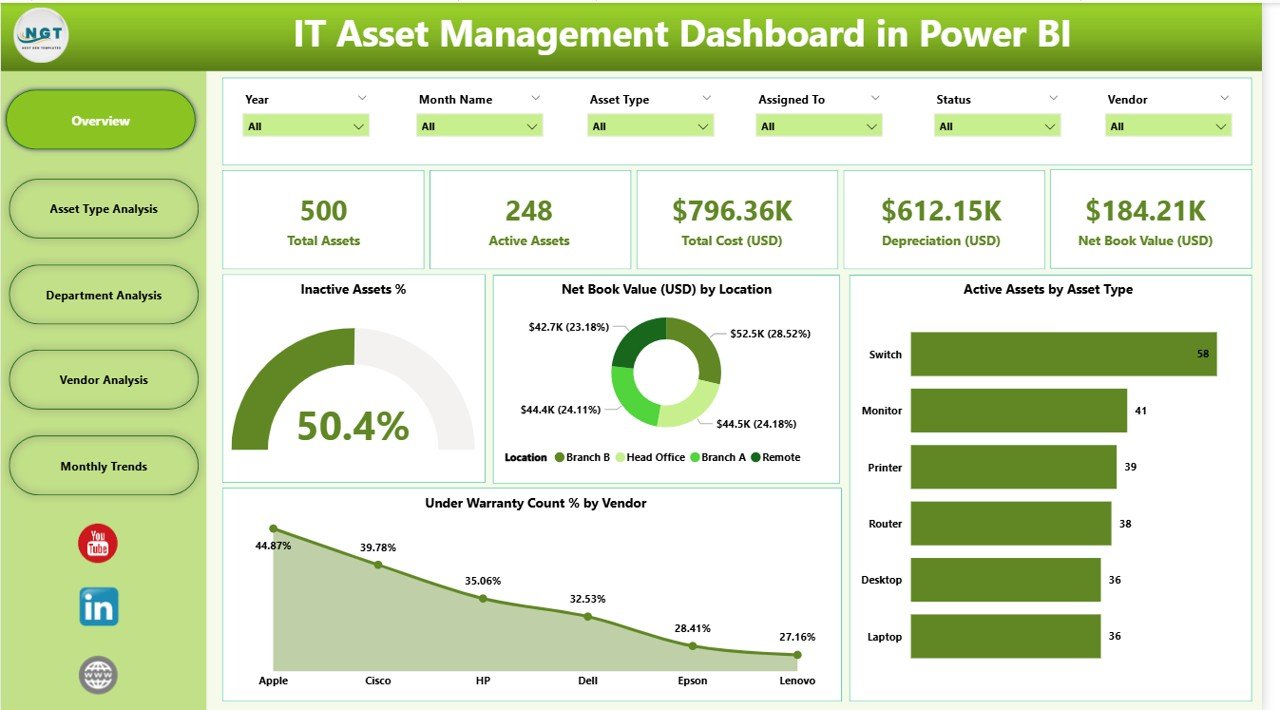
Overview Page – A high-level summary with KPI cards and charts to track active/inactive assets, warranty coverage, and asset value by location/vendor.
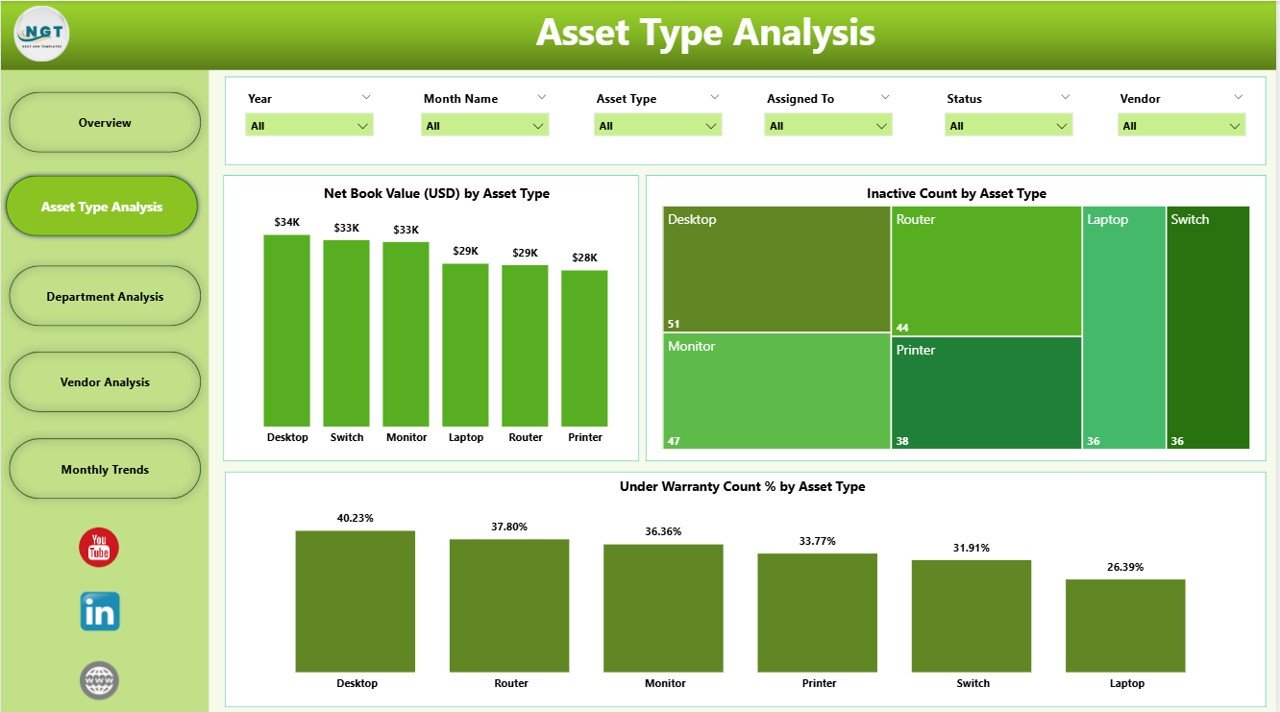
Asset Type Analysis – Understand distribution, cost impact, and warranty status by asset category.
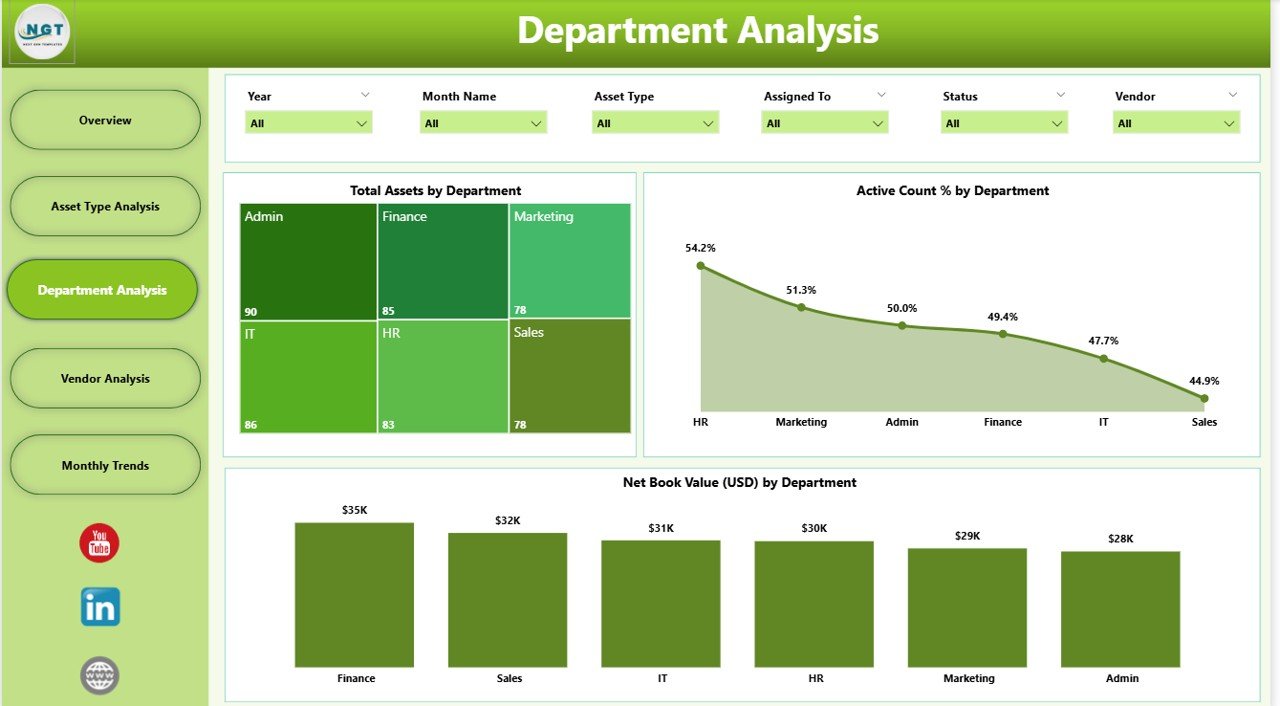
Department Analysis – Monitor departmental asset utilization, spending, and active/inactive rates.
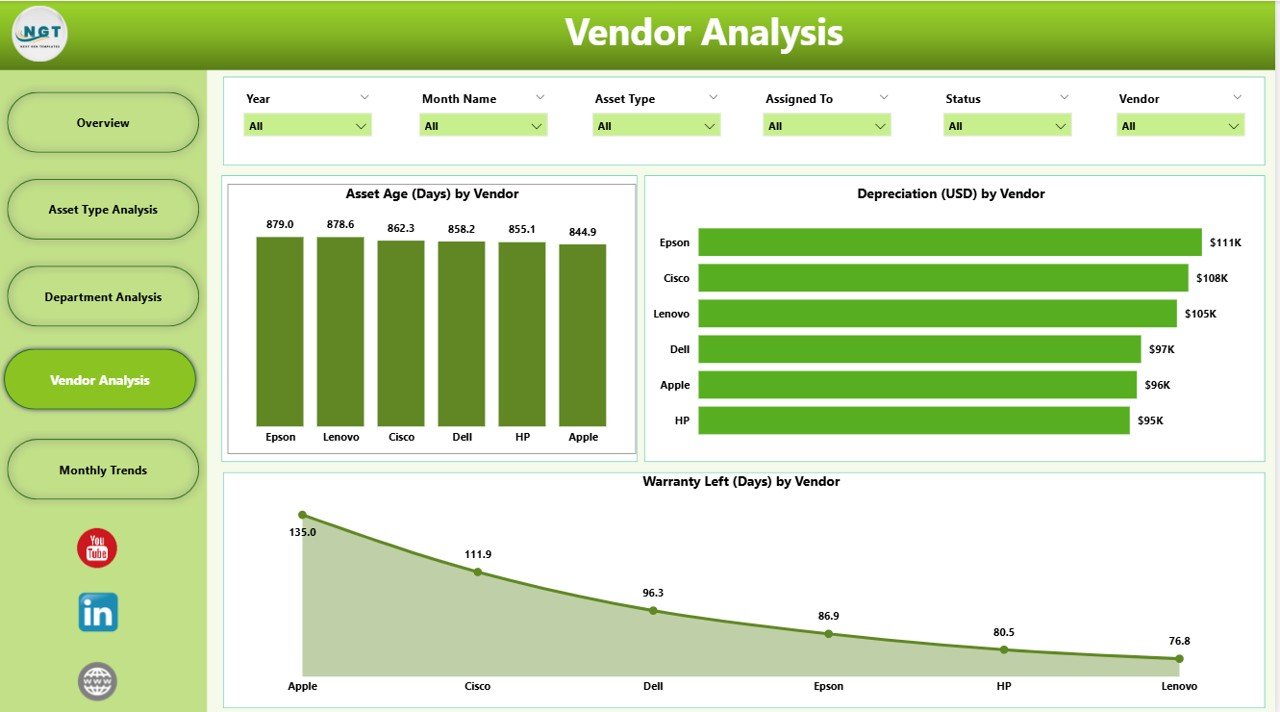
Vendor Analysis – Assess vendor reliability using asset age, spend, and warranty performance data.
Monthly Trends – Review month-by-month changes in asset counts, values, and utilization for forecasting.
🛠 How to Use the IT Asset Management Dashboard
1️⃣ Connect Your Data – Link your Excel file, database, or asset management tool to Power BI.
2️⃣ Apply Filters – Use slicers to drill down into specific departments, vendors, or asset categories.
3️⃣ Monitor KPIs – Keep an eye on asset counts, warranty coverage, and net book value.
4️⃣ Analyze Trends – Identify seasonal or departmental cost variations.
5️⃣ Share Reports – Export insights as PDFs or share interactive dashboards with your team.
👥 Who Can Benefit from This Dashboard
💼 IT Managers – Gain full visibility into asset lifecycle and performance.
🏢 Business Owners – Reduce operational costs with smarter asset allocation.
📊 Finance Teams – Track net book value, overspending, and cost-saving opportunities.
📦 Procurement Teams – Evaluate vendors and optimize purchase decisions.
🛠 Support Teams – Plan maintenance schedules with warranty and age data.
📌 Click here to read the Detailed Blog Post
📺 Visit our YouTube channel to learn step-by-step video tutorials
Watch the step-by-step video tutorial:
Compatibility and Requirements
- Opens in Power BI Desktop, which is free to download from Microsoft.
- Connect your own Excel file or database, or start from the data in the file. Reports can be exported as PDF or shared with your team.
- Get it from Microsoft: Get Power BI Desktop.
Frequently Asked Questions
Which pages are in the dashboard?
Five pages: Overview, Asset Type Analysis, Department Analysis, Vendor Analysis and Monthly Trends.
What can I filter by?
Slicers filter by asset type, department, vendor, location, warranty status and date range.
Which KPIs are on the cards?
Active and inactive assets, net book value, assets under warranty and total asset count.
Can I see asset-level detail?
Yes. Drill-through lets you click a visual and open the asset-level details behind it.
Related IT Asset Templates
- IT Asset Management Dashboard in Excel: the same topic in Excel
- IT Asset Management Dashboard in Google Sheets: for teams on Google Sheets
- IT Asset Management Report in Excel: a printable asset report
- IT Asset Management System Web App: a browser-based asset register
- IT and Cybersecurity Operations Bundle: 8 IT templates in Excel and Power BI
Browse all Power BI dashboards or the Excel IT templates.
































Reviews
There are no reviews yet.