

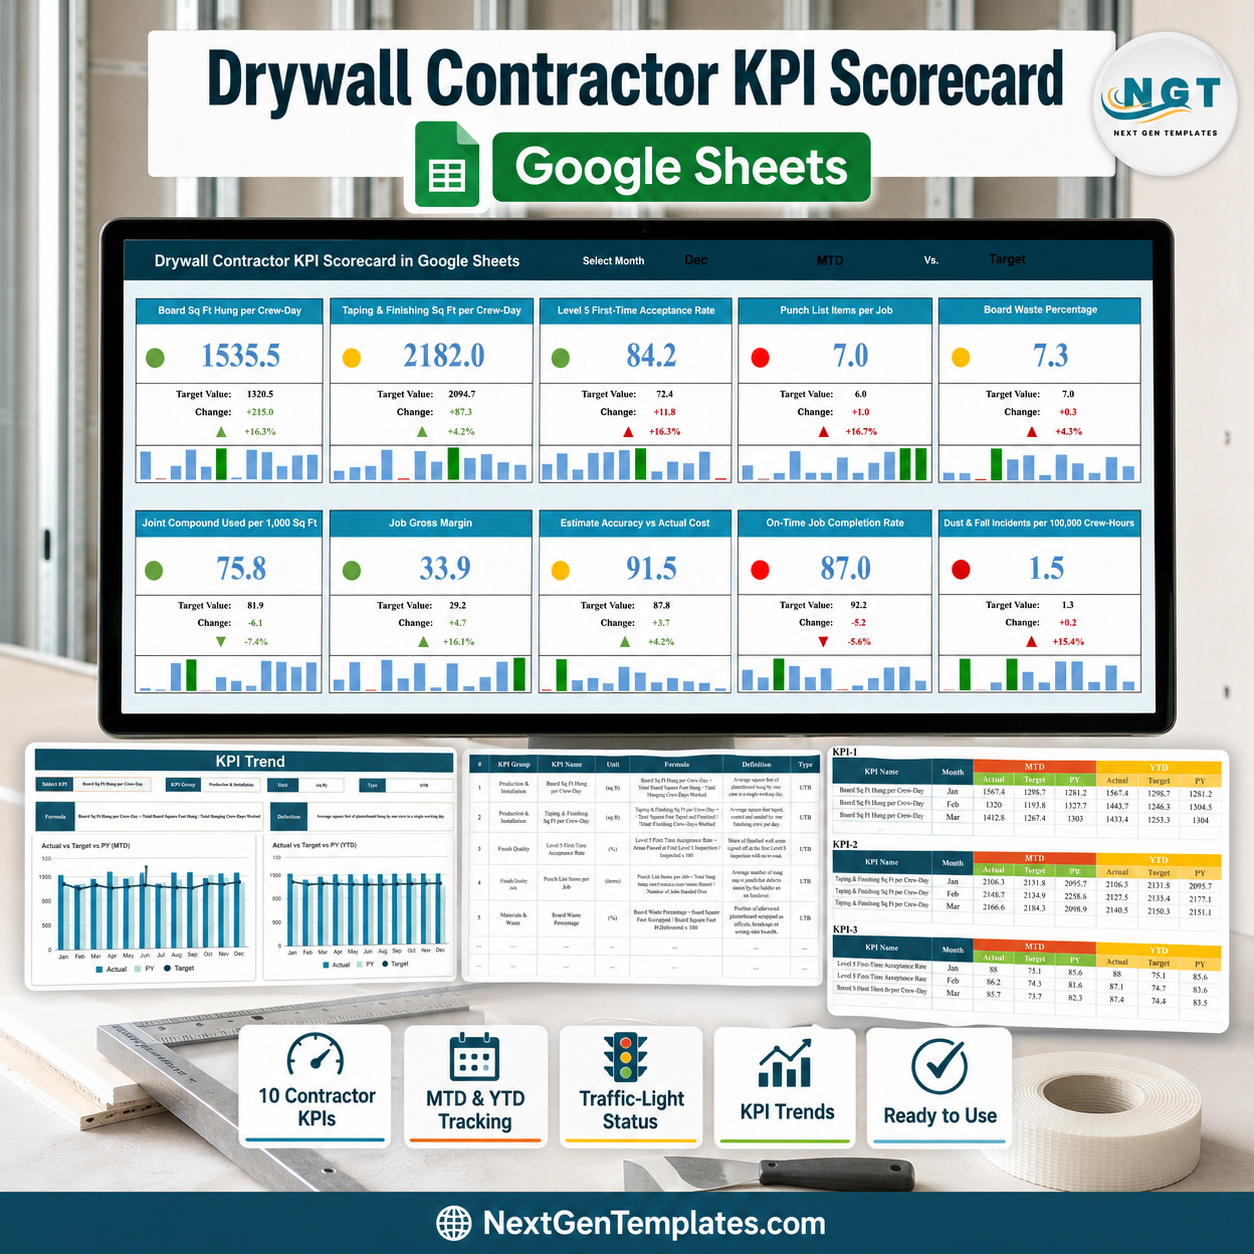

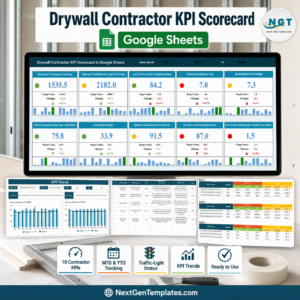
The Drywall Contractor KPI Scorecard in Google Sheets tracks 10 drywall performance indicators across 5 KPI groups on 4 sheets, with 12 months of Actual, Target and Prior-Year figures already loaded as sample data. Every KPI card carries a red/amber/green light, a variance line and a 12-month mini bar chart. Setup takes under 10 minutes: make your copy, replace the sample numbers on the KPI Data sheet, and every card, light and chart recalculates.
🌍 Join 8,400+ teams in 40+ countries using NextGenTemplates to replace paid SaaS tools with one-time-purchase Excel, Google Sheets, Power BI, and HTML templates.
✅ Instant download · One-time payment · No subscription · No per-user fees · Lifetime access
This is the KPI Scorecard build — ten KPI cards with RAG traffic lights, a comparison-switch dropdown and a single monthly data sheet, sized for a drywall subcontractor who wants one honest page per month. It is a different, lighter product from our KPI Dashboard line, which is a wider build with a traffic-light grid, a KPI Analysis page and several input sheets — see the HVAC Contractor KPI Dashboard in Google Sheets for that shape, and the analytical Construction Dashboard in Google Sheets for chart-led slicing. All three sit in our Google Sheets Templates library.
🔑 Key Features of the Drywall Contractor KPI Scorecard in Google Sheets
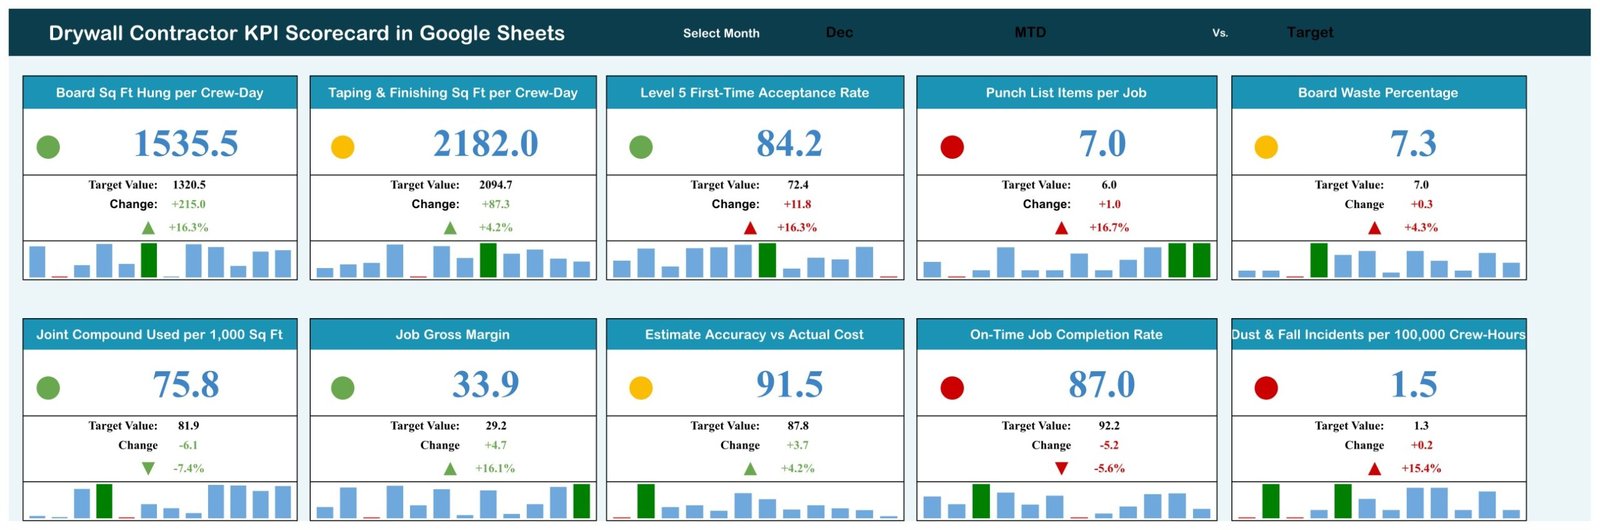
🚦 Ten KPI cards with traffic lights. The KPI Scorecard page shows all ten at once — Board Sq Ft Hung per Crew-Day, Taping & Finishing Sq Ft per Crew-Day, Level 5 First-Time Acceptance Rate, Punch List Items per Job, Board Waste Percentage, Joint Compound Used per 1,000 Sq Ft, Job Gross Margin, Estimate Accuracy vs Actual Cost, On-Time Job Completion Rate and Dust & Fall Incidents per 100,000 Crew-Hours. In the December sample month, four read green, three amber and three red.
🔀 Three dropdowns drive the whole page. A Select Month picker, an MTD / YTD switch and a comparison switch that measures each KPI against Target or against Prior Year. Change any one of them and all ten cards, all ten lights and all ten sparklines update together.
📉 Direction-aware scoring. Each KPI is flagged UTB (upper the better) or LTB (lower the better), so Board Waste Percentage, Punch List Items per Job, Joint Compound Used per 1,000 Sq Ft and Dust & Fall Incidents go green when they fall, while Job Gross Margin and Level 5 First-Time Acceptance Rate go green when they rise. The lights read correctly without you rewriting a single formula.
📈 A 12-month sparkline on every card. Under each KPI value sits a small bar chart of that KPI’s twelve months, with the selected month highlighted — so you see the trend and the current reading in the same glance.
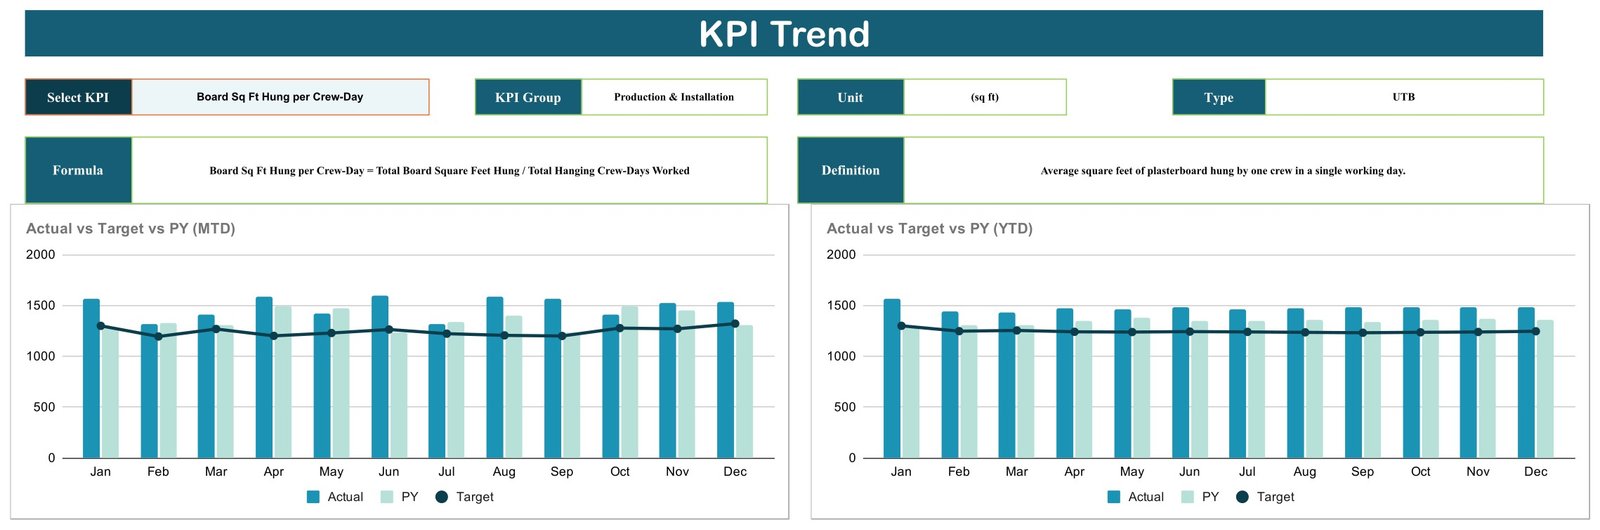
🔍 A dedicated KPI Trend page. Pick any one of the ten KPIs from a dropdown and the page shows its group, unit, direction type, formula and plain-English definition, plus two charts: Actual vs Target vs PY (MTD) and Actual vs Target vs PY (YTD), both across Jan to Dec.
📖 Every KPI is documented in the file. The KPI Definition sheet lists all ten with their group, unit, calculation formula, definition and direction type — for example, Board Waste Percentage = Board Square Feet Scrapped / Board Square Feet Delivered x 100.
📦 What Is Inside the Drywall Contractor KPI Scorecard in Google Sheets
Page 1: KPI Scorecard
The main page. Ten KPI cards laid out five across and two down, each showing the current value, its traffic light, the Target Value, the absolute Change, the percentage change with an up or down arrow, and a 12-month sparkline. The header carries the Select Month, MTD/YTD and Vs. Target/PY dropdowns. In the December sample, Board Sq Ft Hung per Crew-Day reads 1535.5 against a 1320.5 target and lights green, while On-Time Job Completion Rate reads 87.0 against a 92.2 target and lights red.
Page 2: KPI Trend
A single-KPI deep dive. Select the KPI and the page fills in its KPI Group, Unit, Type, Formula and Definition, then draws Actual vs Target vs PY (MTD) and Actual vs Target vs PY (YTD) as monthly column charts with a Target line across Jan to Dec.
Page 3: KPI Definition Master List
A reference table of all ten KPIs with columns for #, KPI Group, KPI Name, Unit, Formula, Definition and Type. The five groups are Production & Installation, Finish Quality, Materials & Waste, Job Cost & Margin, and Schedule & Crew Safety.

Page 4: KPI Data Sheet
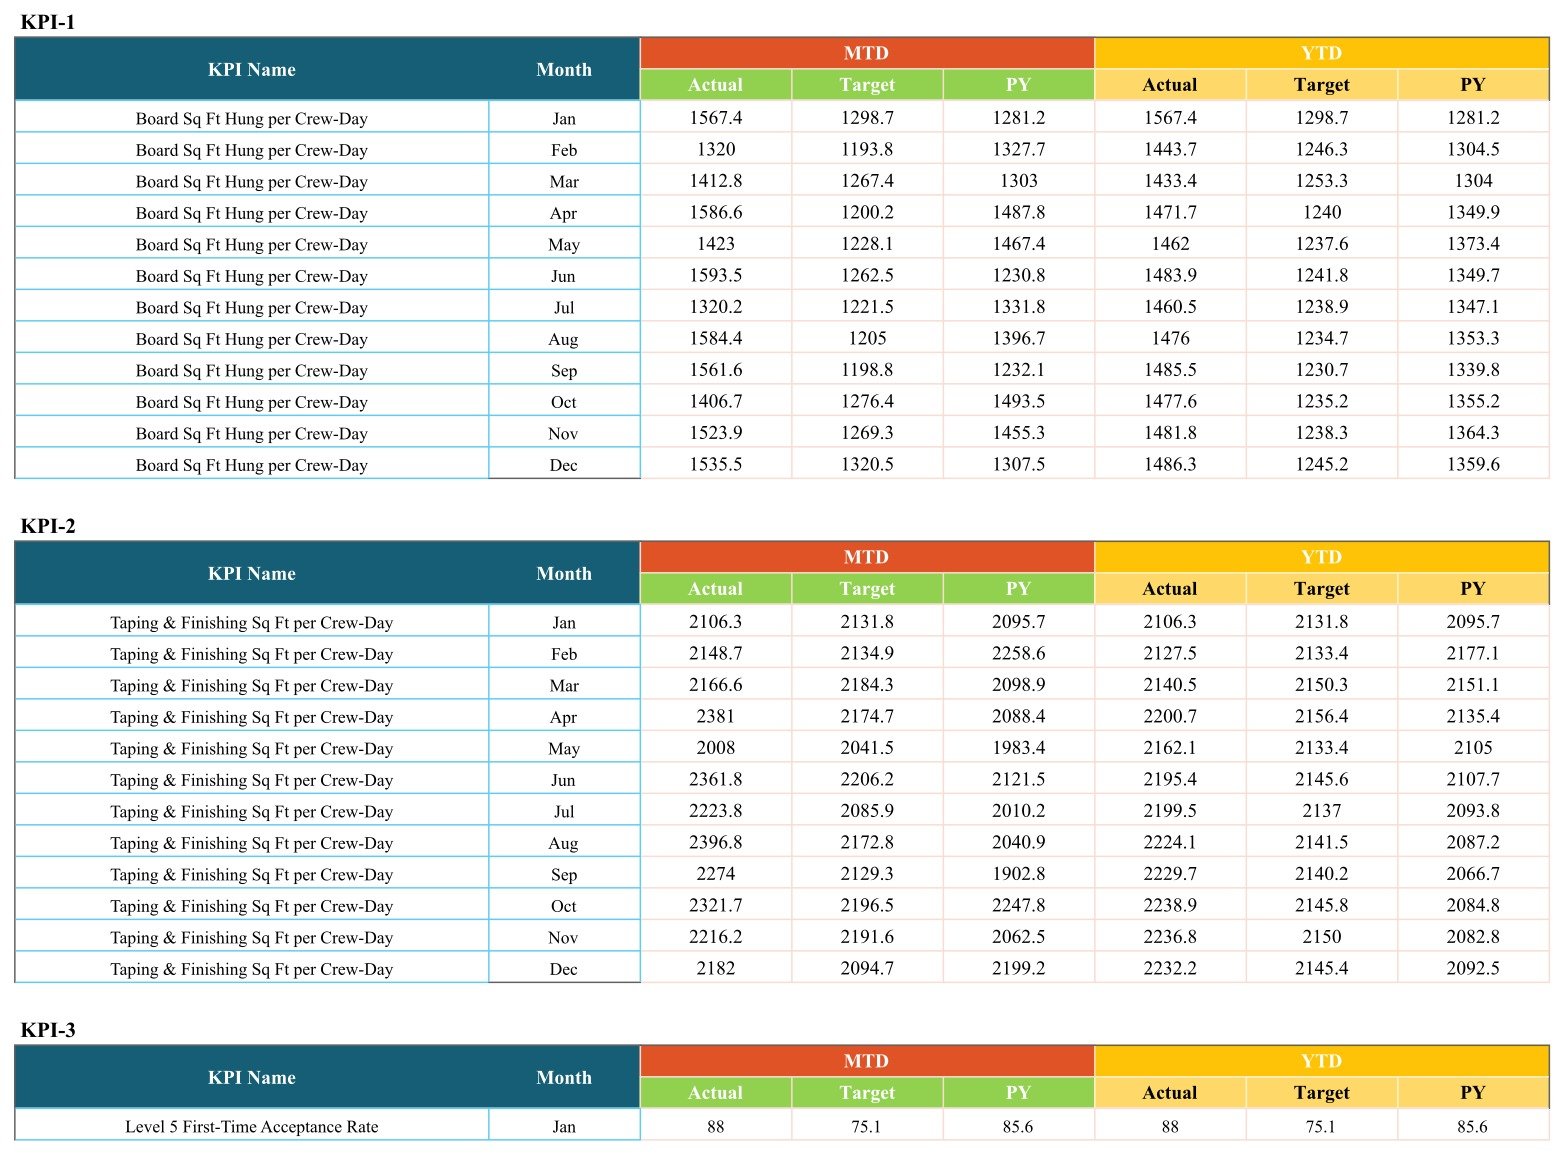
The only place you type. One input block per KPI, labelled KPI-1 to KPI-10, each holding twelve monthly rows with MTD Actual, Target and PY alongside YTD Actual, Target and PY. Replace these numbers with your own and the scorecard and trend pages follow.
📊 Drywall Contractor KPI Scorecard in Google Sheets vs. Microsoft Excel Dashboard vs. Buildertrend / Knowify — Where This Fits
| Feature | Drywall Contractor KPI Scorecard in Google Sheets | Microsoft Excel Dashboard | Buildertrend / Knowify |
|---|---|---|---|
| Cost | $8.99 one-time ✅ | $15-30 one-time plus an Office licence | Roughly $99-700 per month |
| Platform | Google Sheets, any browser ✅ | Excel desktop | Vendor cloud plus mobile app |
| Setup time | Under 10 minutes ✅ | 15-30 minutes | Days to weeks of onboarding |
| Real-time team collaboration | Built in ✅ | Only via OneDrive co-authoring | ✅ Yes |
| Mobile access | Google Sheets mobile app ✅ | Limited | ✅ Native app |
| Customisable KPIs and formulas | Fully open formulas ✅ | ✅ Open formulas | Vendor-defined metrics only |
| Share with a link | ✅ Yes | File attachment | A seat is usually required per viewer |
| Take-offs, scheduling and invoicing built in | No — reporting only | No | ✅ Yes |
| Year-1 cost for a small drywall crew | $8.99 total ✅ | About $25 plus licences | $1,200-8,400 |
For drywall subcontractors who want an honest monthly read on board production, waste, punch lists and margin without paying construction-software subscriptions, the Drywall Contractor KPI Scorecard in Google Sheets sits in the sweet spot.
👥 Who This Template Is For — and Who It Is Not For
✅ This template is built for:
- Owners of drywall and interior-finishing subcontracting firms running 2-30 hanging and finishing crews
- Project managers who report board production, punch-list counts and on-time completion to a general contractor every month
- Estimators who want Estimate Accuracy vs Actual Cost tracked against a target rather than argued about after the job closes
- Office managers and bookkeepers who already assemble board, mud and labour figures by hand and want a fixed reporting format
❌ This template is NOT for:
- Teams wanting take-offs, scheduling, daily logs or crew GPS — this is a reporting scorecard, not a construction management system
- Anyone expecting it to connect to Buildertrend, Procore, Knowify or QuickBooks — every figure is typed or pasted in by you
- Contractors who need per-job or per-crew drilldown; this file reports at the monthly company level
- Anyone needing more than 10 KPIs out of the box — see the KPI Dashboard line instead
⚙ How to Use the Drywall Contractor KPI Scorecard in Google Sheets
- Open the PDF in your download and click the Google Sheets link, then choose File > Make a copy to create your own editable copy in Google Drive.
- Open the KPI Definition sheet and rename or reword any KPI so it matches how your company measures board, mud and labour.
- Go to the KPI Data sheet and replace the sample MTD and YTD figures for KPI-1 to KPI-10 with your own twelve months.
- Set your own Target column values — that is what drives every traffic light.
- Return to the KPI Scorecard page, pick a month, then switch between MTD and YTD and between Vs. Target and Vs. PY.
- Open the KPI Trend page and select any single KPI to see its full-year Actual, Target and PY comparison.
- Share the file with your project manager or estimator using the normal Google Sheets share button.
💼 Real-World Use Cases
Ray runs a nine-crew residential drywall subcontractor in Denver. He opens the scorecard on the first Monday of every month, sets the picker to the month just closed, and reads the red lights first. Last quarter that told him punch-list items per job were climbing while board production held, so he moved his best finisher onto the two builders generating the snags instead of chasing more square footage.
Nadia is project manager for a commercial interiors contractor with 24 hangers and finishers. She uses the Vs. PY switch in her quarterly review to show ownership that Level 5 First-Time Acceptance Rate is up on the same months last year, and the KPI Trend page to show Board Waste Percentage falling every month since the crew switched board supplier.
Tom runs a two-crew drywall shop and does his own books. He fills the KPI Data sheet from his job folder on the last day of the month, then screenshots the KPI Scorecard page for his bonding agent — no software subscription and no per-user fee.
❓ Frequently Asked Questions
What KPIs does the Drywall Contractor KPI Scorecard in Google Sheets track?
It tracks 10 KPIs in 5 groups: Board Sq Ft Hung per Crew-Day and Taping & Finishing Sq Ft per Crew-Day (Production & Installation); Level 5 First-Time Acceptance Rate and Punch List Items per Job (Finish Quality); Board Waste Percentage and Joint Compound Used per 1,000 Sq Ft (Materials & Waste); Job Gross Margin and Estimate Accuracy vs Actual Cost (Job Cost & Margin); and On-Time Job Completion Rate and Dust & Fall Incidents per 100,000 Crew-Hours (Schedule & Crew Safety).
Does this connect to Buildertrend, Procore, Knowify or QuickBooks?
No. The Drywall Contractor KPI Scorecard in Google Sheets has no integrations and imports nothing automatically. You type or paste your monthly figures into the KPI Data sheet, and the scorecard, traffic lights and charts calculate from there. That is also why it works whichever system you run.
How is a KPI Scorecard different from your KPI Dashboard templates?
This scorecard is ten KPI cards with RAG lights, a comparison-switch dropdown and one monthly data sheet across 4 pages — deliberately light, so the monthly read takes minutes. The KPI Dashboard line is a wider build with a traffic-light grid, a KPI Analysis page and several input sheets, and the analytical Dashboard line is chart-led slicing of transaction data. Buy this one for a fast monthly management read.
How long does setup take?
Under 10 minutes. Making your copy takes seconds, and the only real work is pasting your own twelve months of MTD and YTD figures into the KPI Data sheet. The Drywall Contractor KPI Scorecard in Google Sheets ships pre-loaded with sample data so you can see the finished result before you change anything.
Can I change the KPIs or add my own?
Yes. Every formula in the Drywall Contractor KPI Scorecard in Google Sheets is open and unlocked. Rename any KPI on the KPI Definition sheet, adjust its unit, and switch its Type between UTB and LTB so the traffic light scores in the right direction for that metric.
What do UTB and LTB mean on the KPI Definition sheet?
UTB means upper the better — a higher number is good, like Job Gross Margin and On-Time Job Completion Rate. LTB means lower the better — a lower number is good, like Board Waste Percentage, Punch List Items per Job and Dust & Fall Incidents per 100,000 Crew-Hours. The scorecard reads this column to decide which way to colour each traffic light.
Do I need a subscription or a per-user fee?
No. The Drywall Contractor KPI Scorecard in Google Sheets is a one-time purchase with lifetime access. Once the file is in your Google Drive you can share it with as many colleagues as you like using standard Google Sheets sharing, at no extra cost.
👤 About the Author
Built by PK — Microsoft Certified Professional with 15+ years of Excel, Google Sheets, and Power BI experience. Founder of NextGenTemplates, reaching 300K+ subscribers across YouTube channels (@PK-AnExcelExpert, @NextGenTemplates, @NeoTechNavigators). Every template is hand-built and tested before release.
🔗 Explore Related Templates
- Painting Contractor KPI Scorecard in Google Sheets — the same scorecard written for the trade that follows yours onto the wall.
- Masonry Contractor KPI Scorecard in Google Sheets — the same monthly discipline for masonry crews.
- Flooring Installation KPI Scorecard in Google Sheets — another interior-finishing trade on the same four-sheet build.
- Construction Dashboard in Google Sheets — the analytical build with project, cost and progress charts, for when you want to slice detail rather than read a scorecard.
- Construction Safety KPI Dashboard in Google Sheets — a deeper look at the incident side that this scorecard reports in one card.
- Construction Project Timeline in Google Sheets — the schedule view behind On-Time Job Completion Rate.
Also available for other trades: the same scorecard build exists for roofing and electrical contractors. Browse more Google Sheets KPI Dashboards and Scorecards.
📖 Click here to read the Detailed Blog Post
🎥 Visit our YouTube channel for step-by-step video tutorials
👉 YouTube.com/@NextGenTemplates
Watch the step-by-step video Demo:
📅 Last updated: August 2026

























Reviews
There are no reviews yet.