

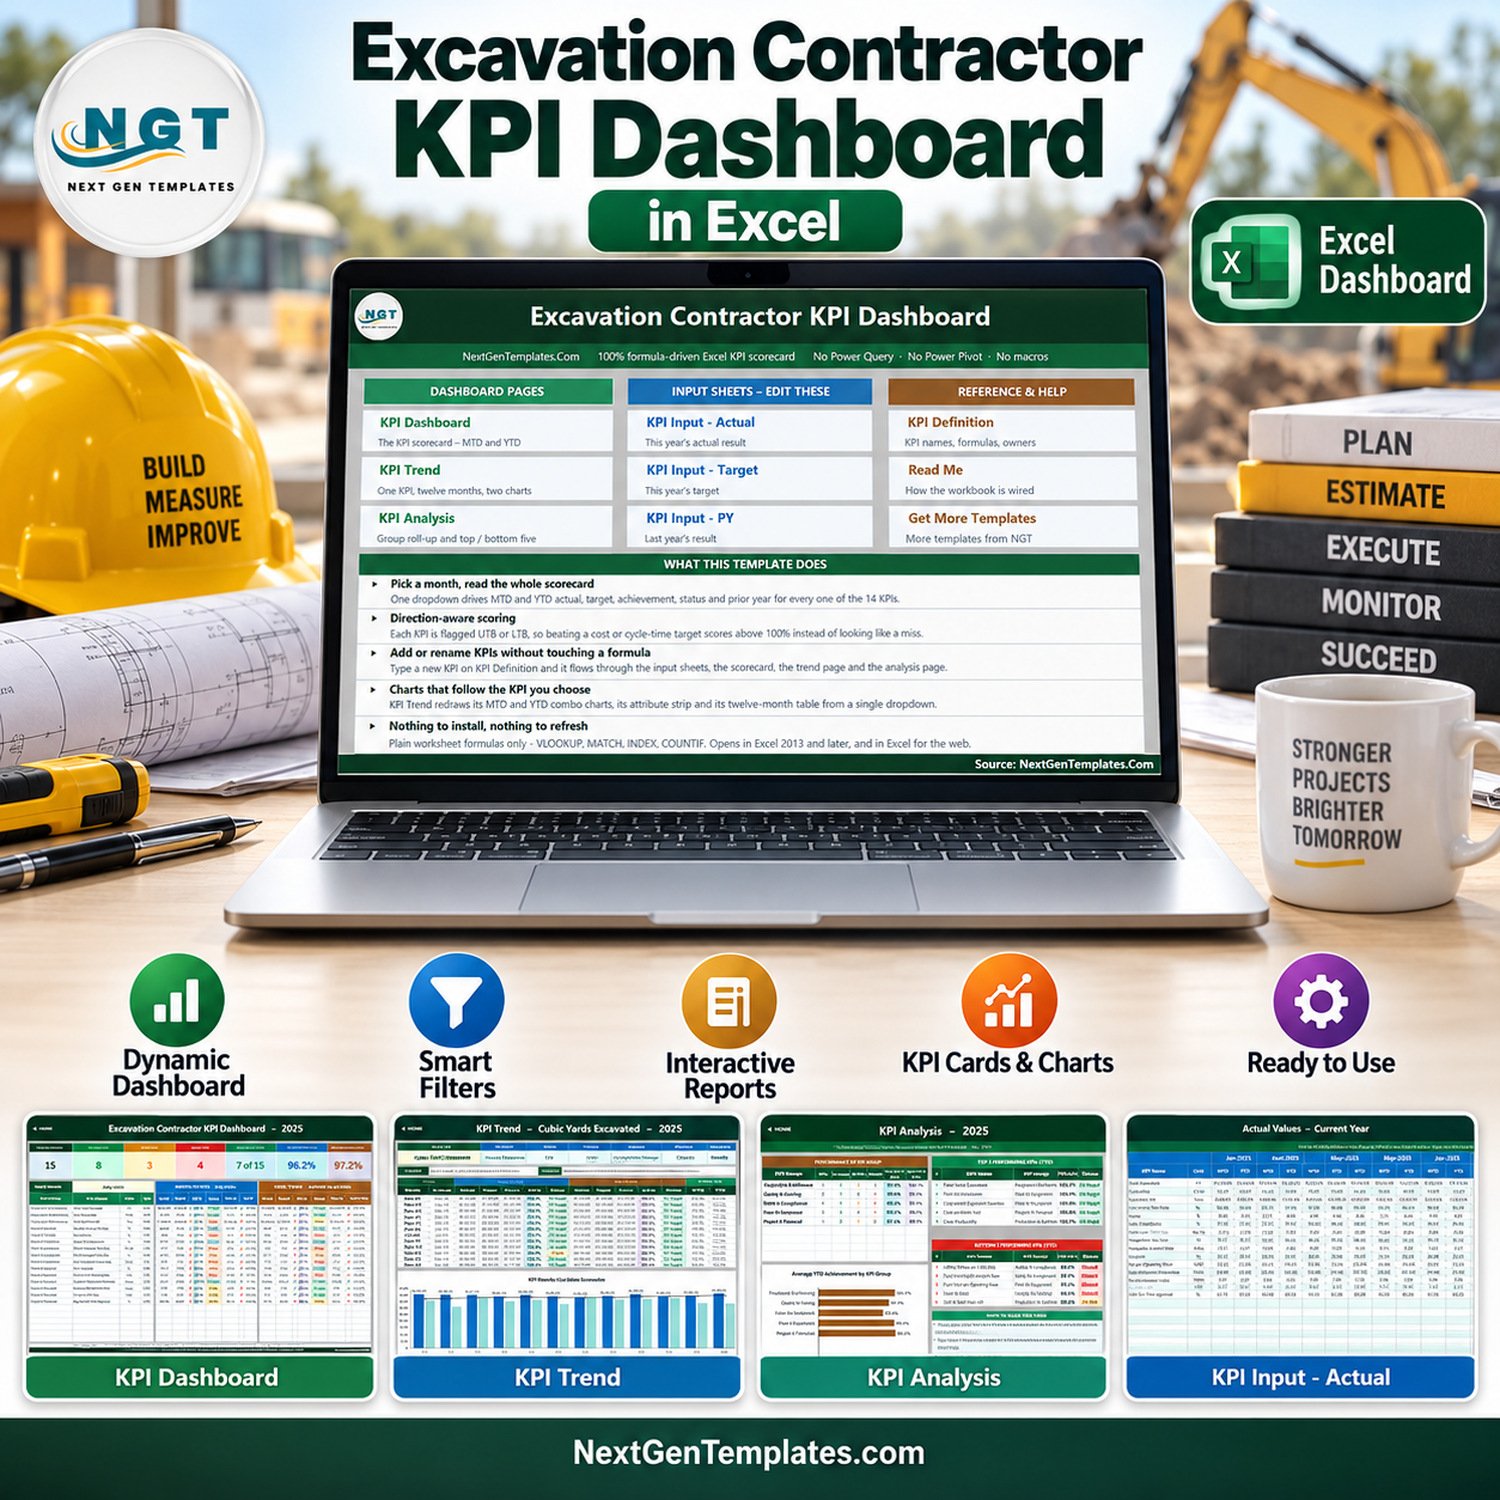
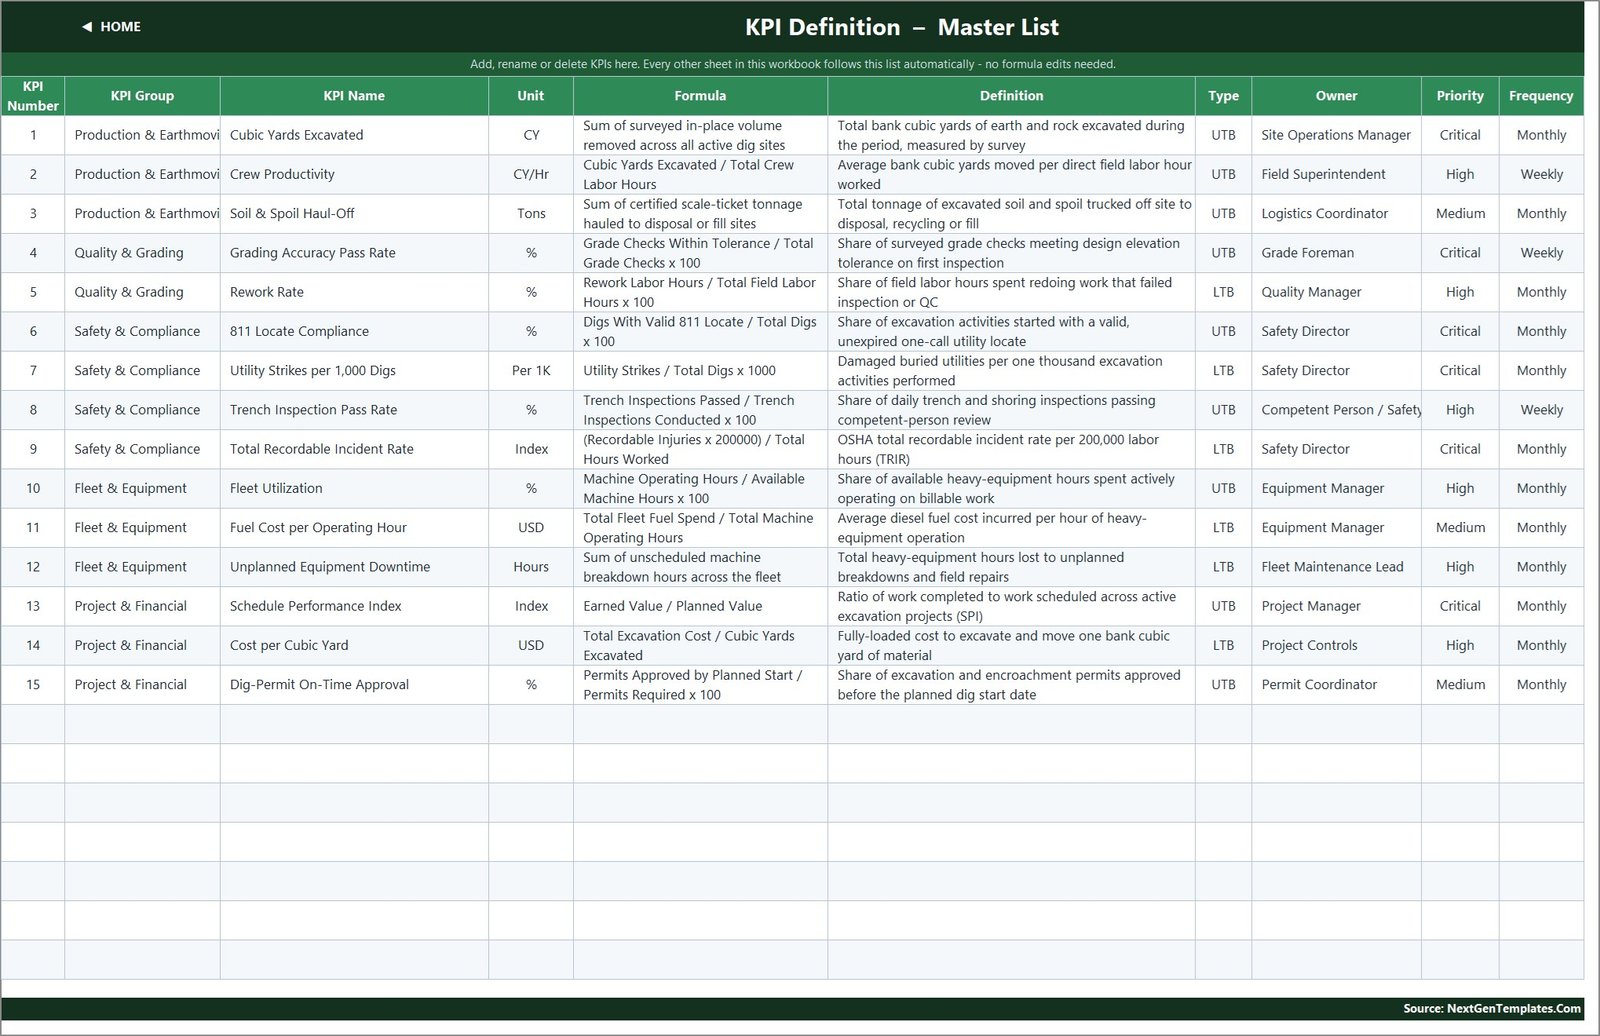
The Excavation Contractor KPI Dashboard in Excel is a month-picker KPI scorecard for excavation, earthmoving and site-preparation contractors. It tracks 15 KPIs in five groups – Production & Earthmoving, Quality & Grading, Safety & Compliance, Fleet & Equipment, and Project & Financial – and shows MTD and YTD actual, target, achievement %, traffic-light status, prior year and year-on-year movement for every KPI from one dropdown. It runs on plain worksheet formulas: no macros, no Power Query, no Power Pivot and no add-ins. It opens in Excel 2013 and later and in Excel for the web, and 2025 sample data is loaded so every card, chart and light is populated the moment you open it.
Instant download – one-time payment – no subscription – lifetime access to the file you buy.
Which template is this? This is the KPI Dashboard line: a month picker, seven summary cards, traffic lights, and separate KPI Trend and KPI Analysis pages. A separate Excavation Contractor KPI Scorecard edition exists in the lighter KPI Scorecard line, and the analytical Excel Dashboard line (a transaction table with slicers) is a third, different product. They complement each other rather than duplicate each other.
Key Features of This Excavation KPI Dashboard
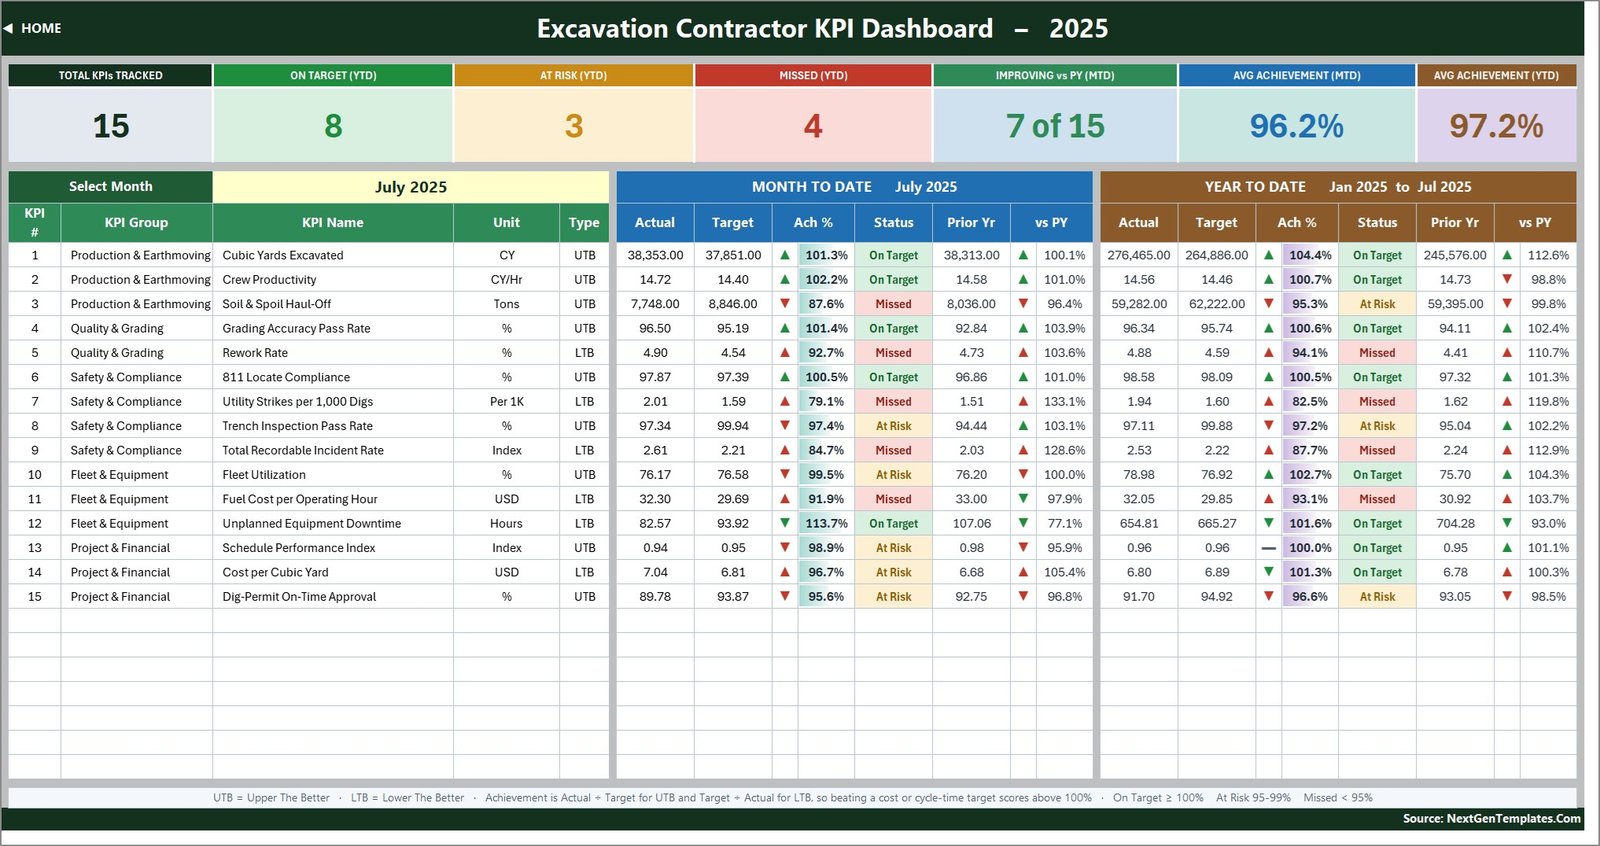
- One dropdown drives the scorecard. Cell D6 on KPI Dashboard lists the twelve months of the reporting year. Pick a month and all 15 rows, the seven summary cards and the whole KPI Analysis page follow it. There is no refresh step and no query to run.
- Direction-aware scoring. Nine KPIs are UTB (upper the better) and six are LTB (lower the better): Rework Rate, Utility Strikes per 1,000 Digs, Total Recordable Incident Rate, Fuel Cost per Operating Hour, Unplanned Equipment Downtime and Cost per Cubic Yard. Achievement is Actual / Target for UTB and Target / Actual for LTB, so beating a cost or downtime target scores above 100%.
- Traffic lights with editable thresholds. On Target from 100%, At Risk 95-99%, Missed below 95%. The cut-offs sit in plain formulas in columns L and U on KPI Dashboard.
- Seven summary cards. Total KPIs Tracked, On Target (YTD), At Risk (YTD), Missed (YTD), Improving vs PY (MTD), Avg Achievement (MTD) and Avg Achievement (YTD). On the July 2025 sample they read 15, 8, 3, 4, 7 of 15, 96.2% and 97.2%.
- Three live charts. MTD Trend and YTD Trend for the selected KPI – actual and prior-year columns with a target line – plus Average YTD Achievement by KPI Group on the analysis page.
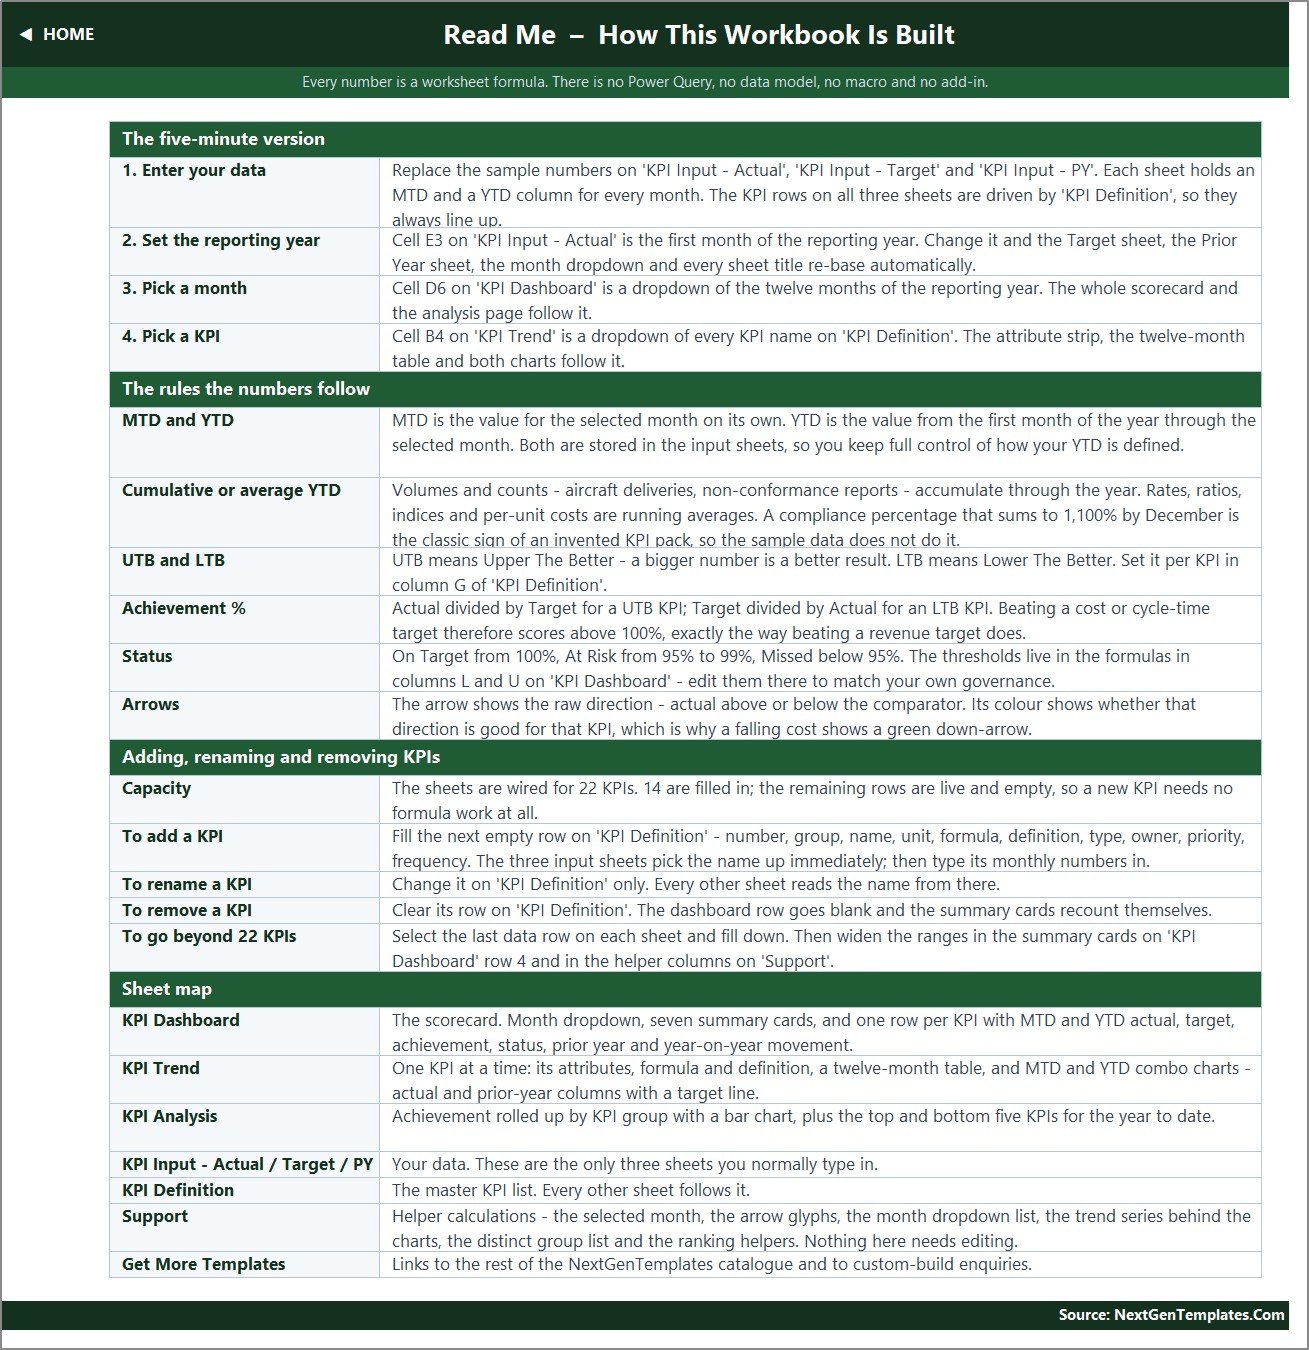
- Room to grow. The sheets are wired for 22 KPI rows and 15 are used, so seven more KPIs need no formula work at all.
The 15 KPIs This Template Ships With
- Production & Earthmoving (3): Cubic Yards Excavated (CY), Crew Productivity (CY/Hr), Soil & Spoil Haul-Off (Tons).
- Quality & Grading (2): Grading Accuracy Pass Rate (%), Rework Rate (%, LTB).
- Safety & Compliance (4): 811 Locate Compliance (%), Utility Strikes per 1,000 Digs (Per 1K, LTB), Trench Inspection Pass Rate (%), Total Recordable Incident Rate (Index, LTB).
- Fleet & Equipment (3): Fleet Utilization (%), Fuel Cost per Operating Hour (USD, LTB), Unplanned Equipment Downtime (Hours, LTB).
- Project & Financial (3): Schedule Performance Index (Index), Cost per Cubic Yard (USD, LTB), Dig-Permit On-Time Approval (%).
Every KPI on KPI Definition also carries a formula, a plain-English definition, an owner (Site Operations Manager, Grade Foreman, Safety Director, Equipment Manager, Permit Coordinator and others), a Critical / High / Medium priority and a frequency.
An honest note on the safety and permit lines. 811 Locate Compliance, Utility Strikes per 1,000 Digs, Trench Inspection Pass Rate, Total Recordable Incident Rate and Dig-Permit On-Time Approval are reporting lines over monthly numbers you type in. The workbook does not raise or check one-call locate tickets, does not log trench or shoring inspections, does not keep injury records and does not track permits. It is not safety-management, utility-locate or permit software, and using it does not make a site compliant with OSHA excavation rules, CDM or any local permit regime. Your competent person, your safety programme and the relevant authority remain the source of truth.
What’s Inside the Download
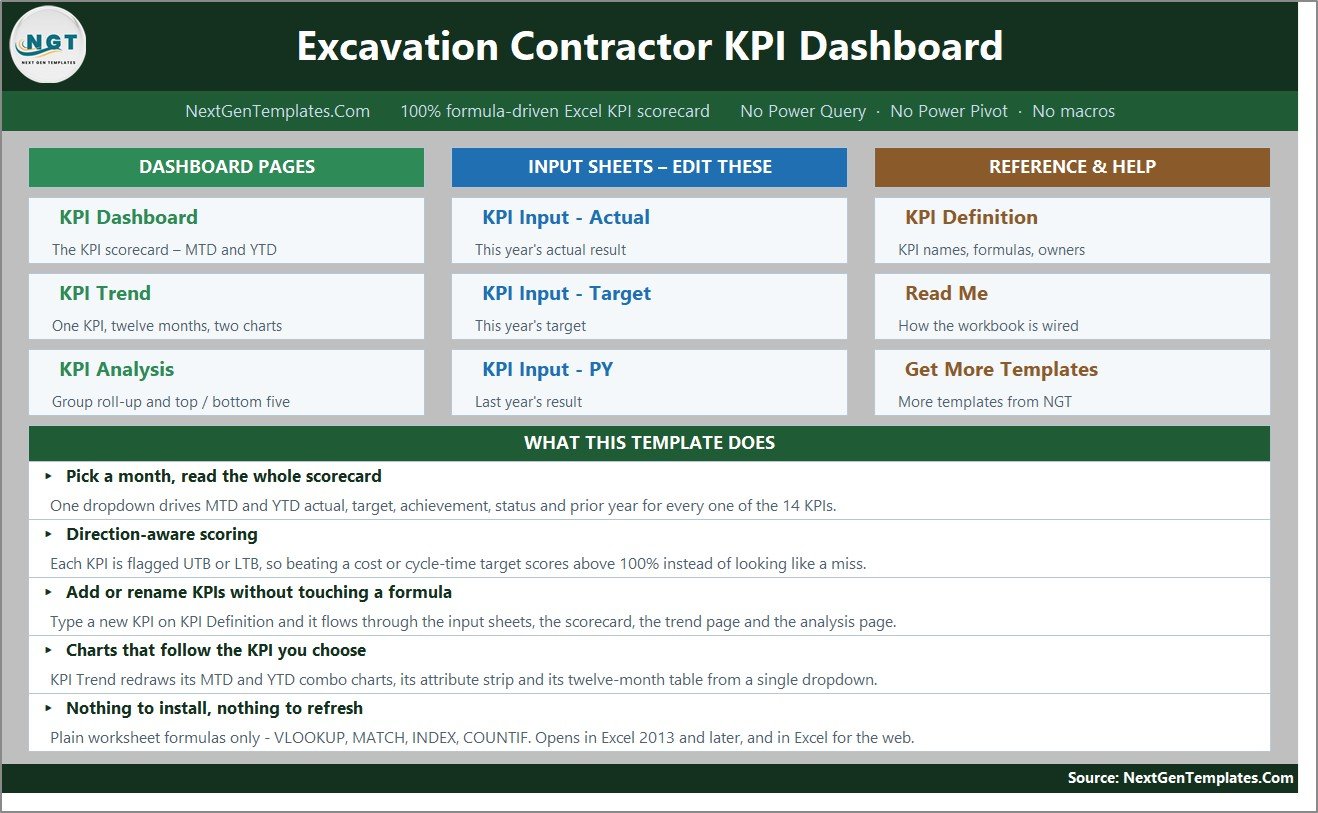
The download is a ZIP holding the .xlsx workbook and the Excel KPI Dashboard User Manual (PDF). The workbook has eleven sheets: Home, KPI Dashboard, KPI Trend, KPI Analysis, the three input sheets, KPI Definition, Support (helper calculations, nothing to edit), Read Me and Get More Templates.
KPI Trend
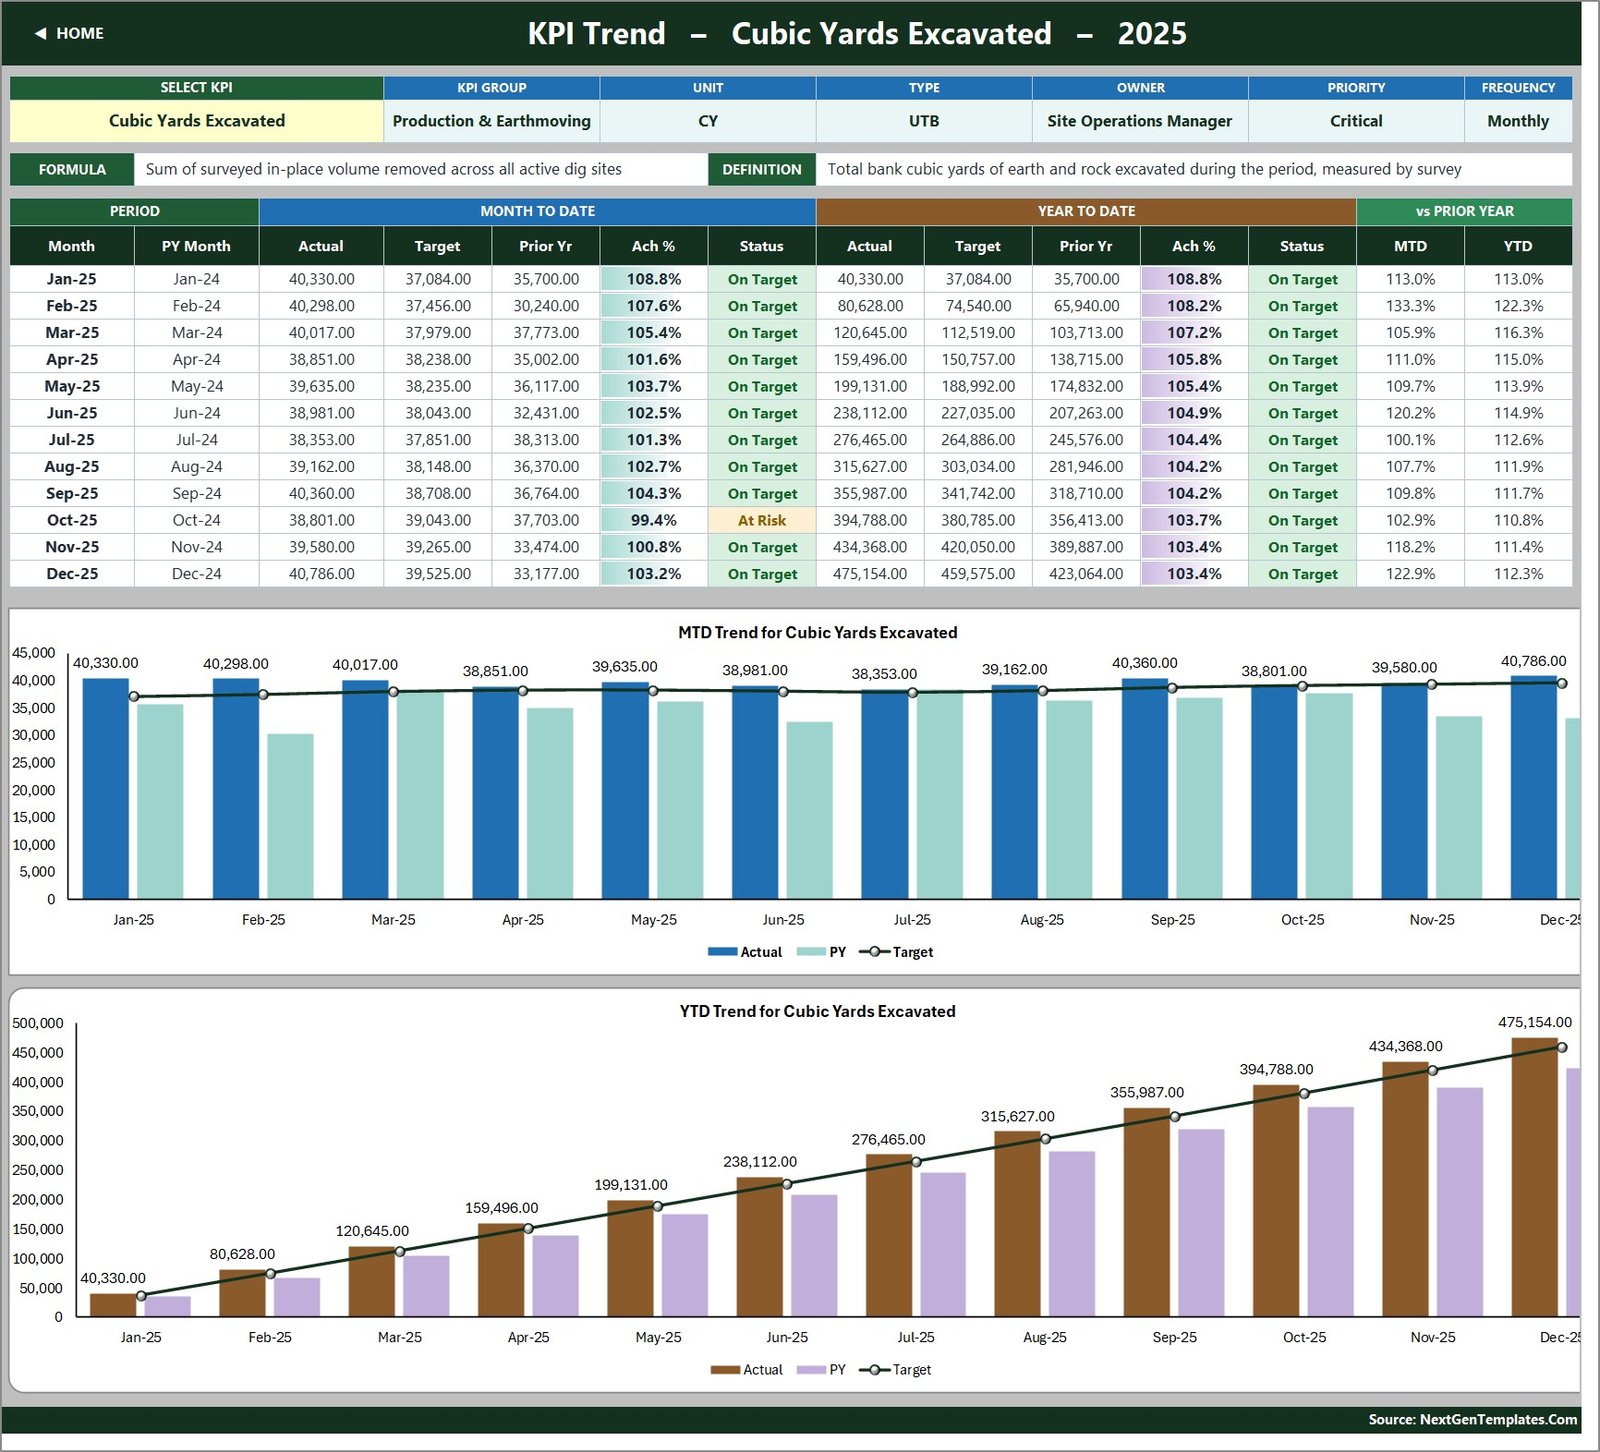
Pick a KPI in cell B4 and the attribute strip, formula, definition, twelve-month table and both combo charts redraw. On the sample, Cubic Yards Excavated is On Target in eleven of twelve months – October dips to 99.4% – and closes the year at 475,154 CY against a 459,575 CY target.
KPI Analysis
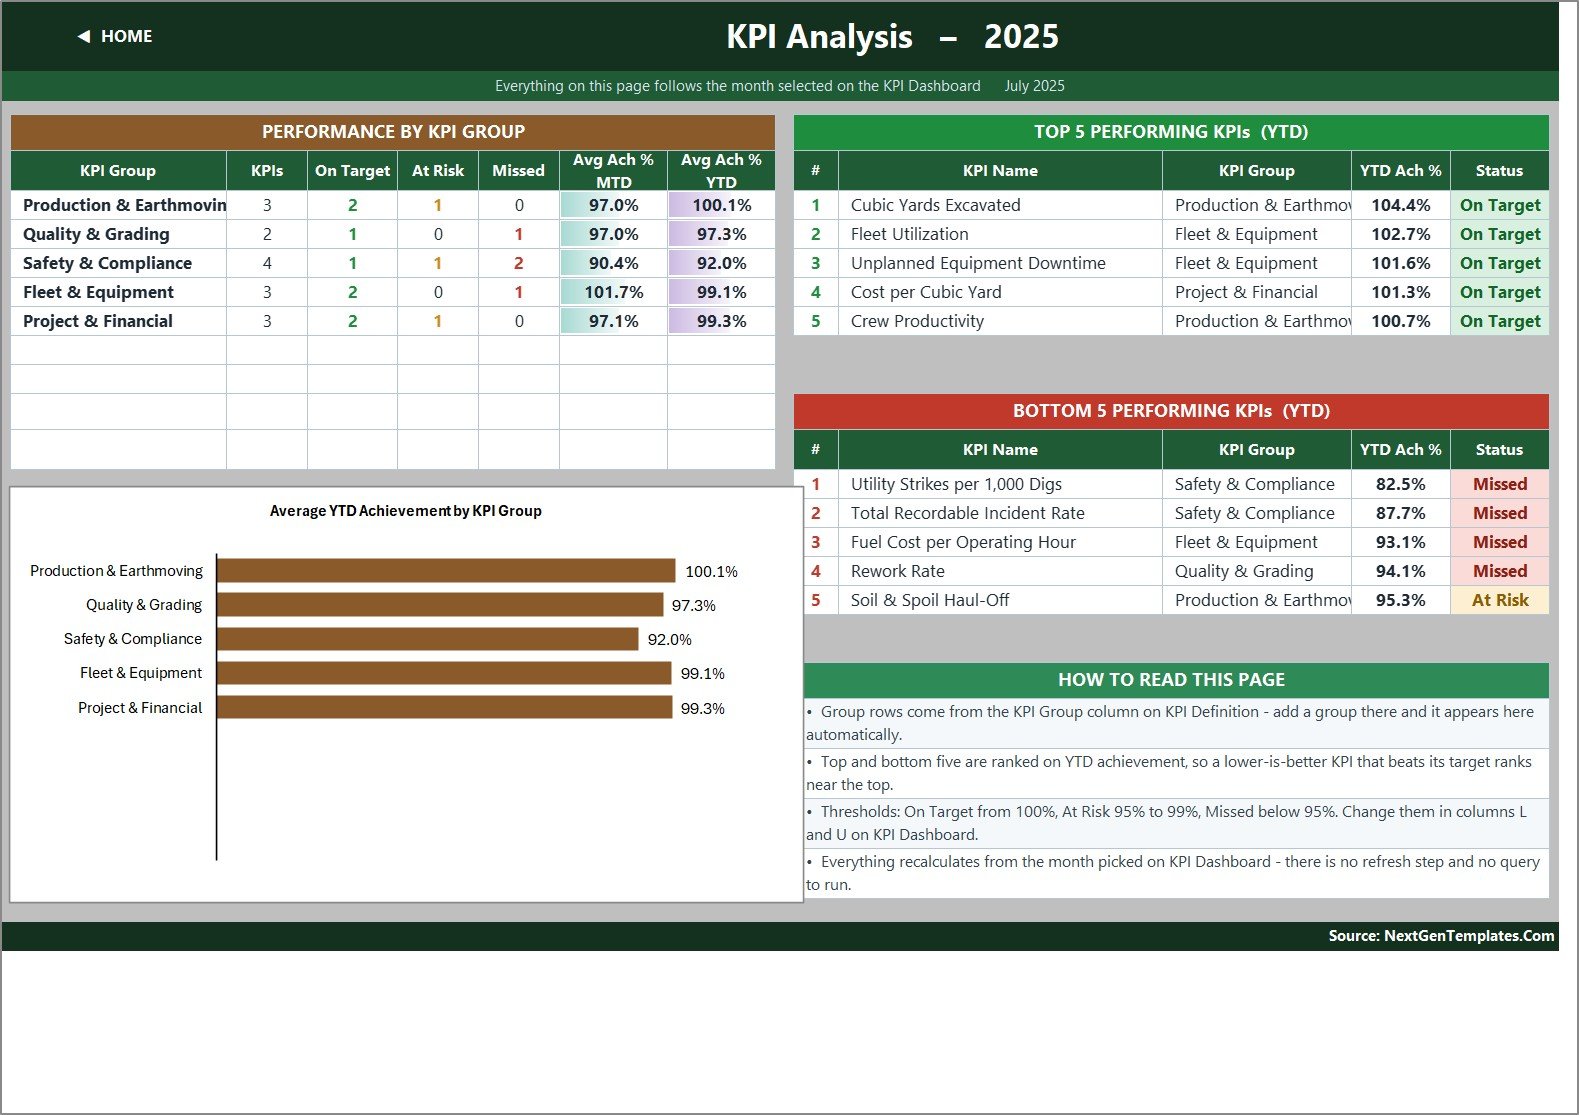
Counts On Target, At Risk and Missed per KPI group, averages MTD and YTD achievement per group, and ranks the top and bottom five KPIs on YTD achievement. In the sample, Safety & Compliance is the weakest group at 92.0% YTD, and the bottom five are Utility Strikes per 1,000 Digs (82.5%), Total Recordable Incident Rate (87.7%), Fuel Cost per Operating Hour (93.1%), Rework Rate (94.1%) and Soil & Spoil Haul-Off (95.3%).
KPI Input – Actual, Target and PY
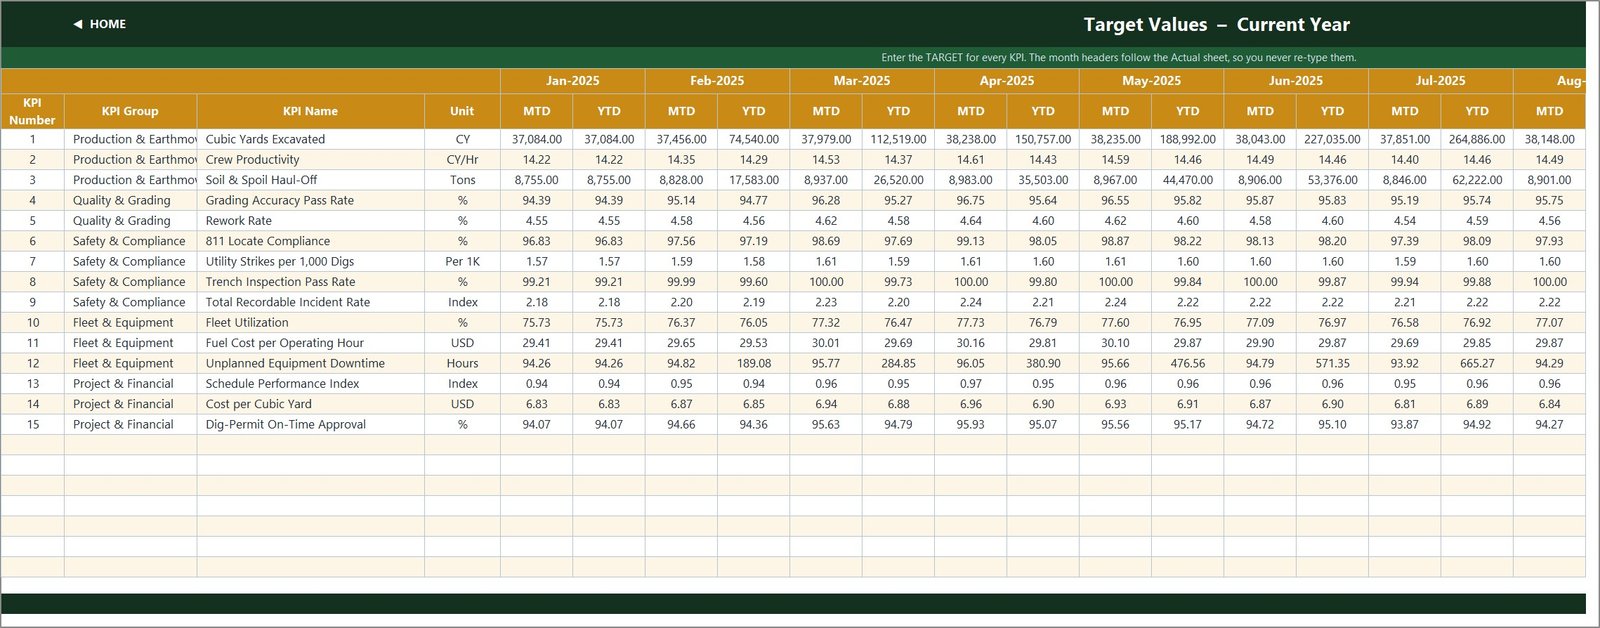
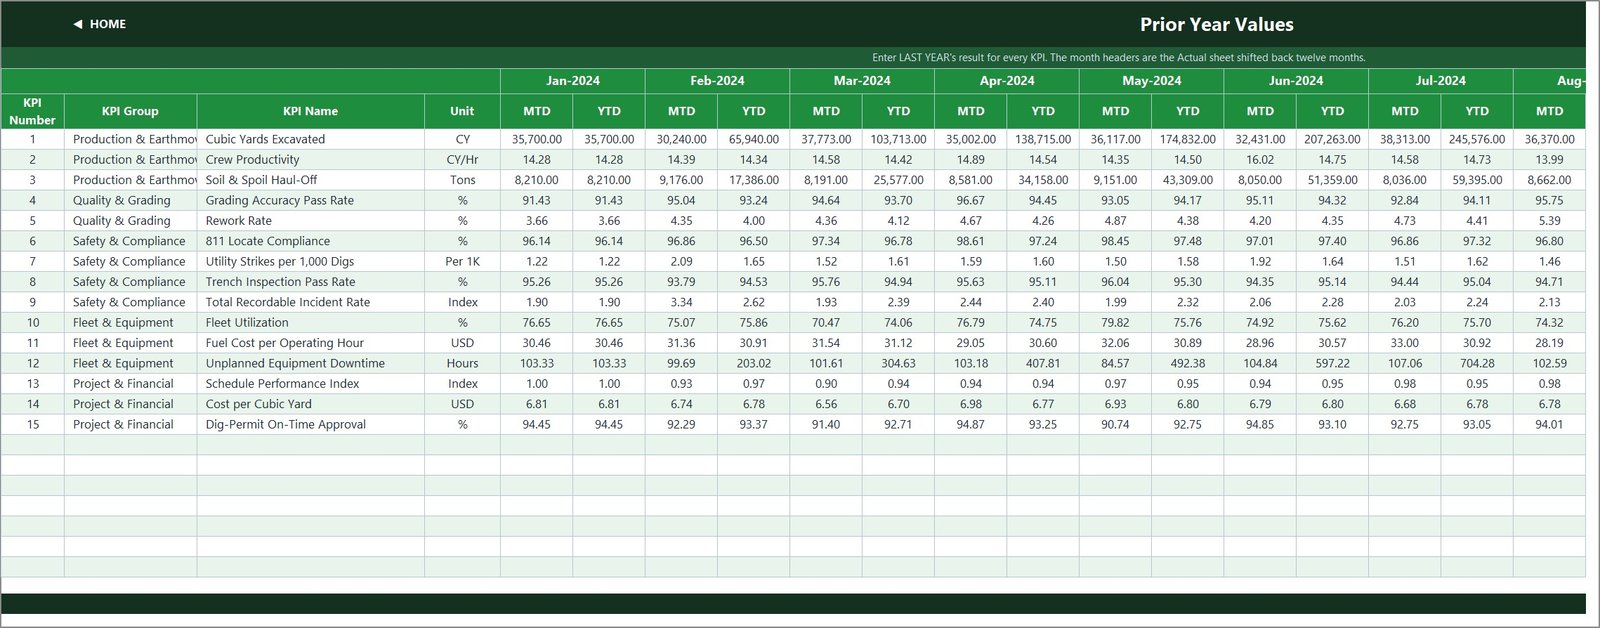
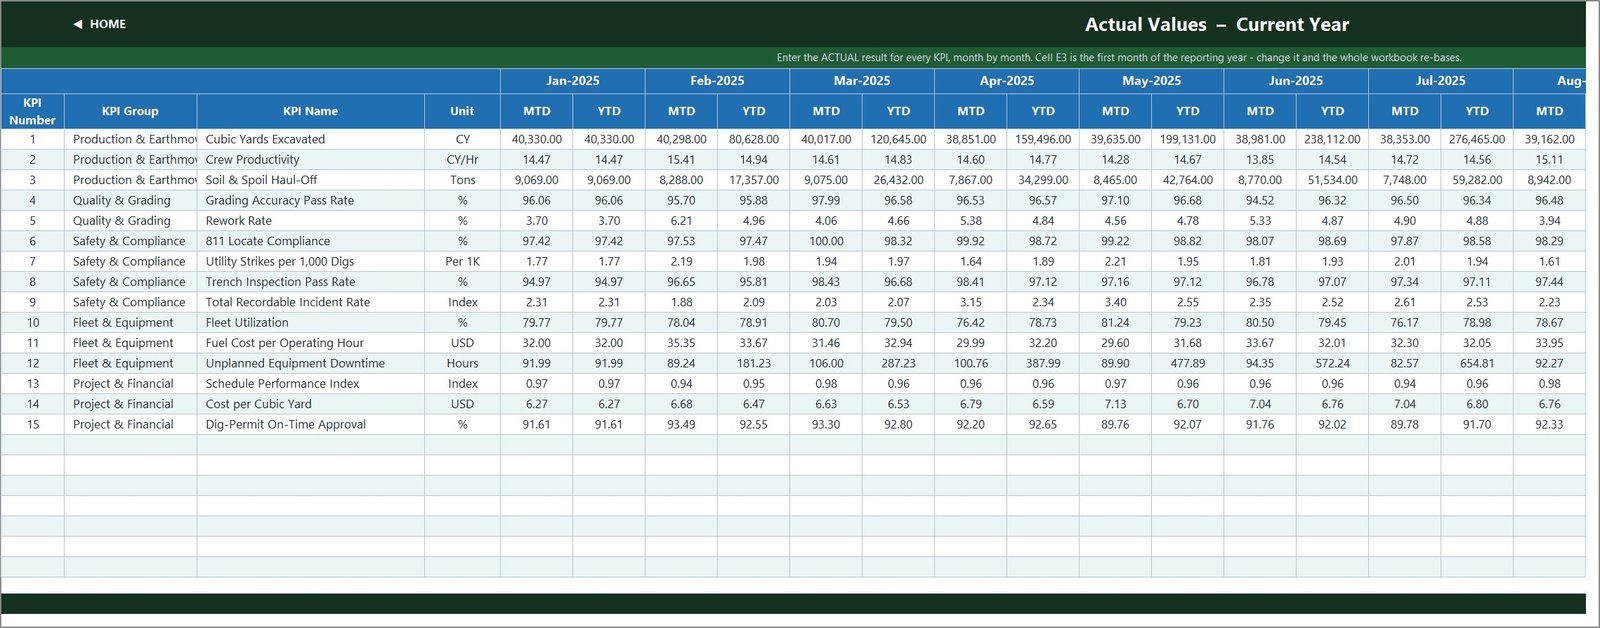
The only three sheets you normally type in. Each holds an MTD and a YTD column for every month. Cell E3 on the Actual sheet is the first month of the reporting year; change it and the Target sheet, the Prior Year sheet, the month dropdown and every title re-base.
Excel KPI Dashboard vs. Google Sheets vs. Construction Management SaaS
| What you need | This Excel KPI Dashboard | A Google Sheets KPI dashboard | Construction management SaaS |
|---|---|---|---|
| Cost | One-time 12.99 (sale) | One-time, similar | Ongoing subscription, usually per seat or per project |
| Setup time | Minutes – type over the sample | Minutes – copy the sheet | Implementation and training |
| Where the data lives | Your own file | Your Google Drive | The vendor’s cloud |
| Works offline | Yes | No | Usually no |
| Automatic capture from telematics or job costing | No – you type the numbers | No | Often yes |
| Change a KPI, target or threshold | Type it – nothing is locked | Type it | Vendor settings or paid customisation |
| Real-time multi-user editing | No (single workbook) | Yes | Yes |
| Year-1 cost at 5 users | The same one-time price | One-time | Five subscriptions |
If you already have monthly numbers from survey reports, scale tickets, fleet logs and job-cost reports, and want a board-ready scorecard on top of them without a subscription, this workbook sits in the sweet spot.
Who This Template Is For – and Who It Is Not For
Built for:
- Owners and general managers of excavation, earthmoving and site-work contractors.
- Operations managers and superintendents reviewing production, grading quality and fleet use each month.
- Project controls and finance staff watching Schedule Performance Index and Cost per Cubic Yard.
Not for:
- Teams wanting job-by-job, machine-by-machine or crew-by-crew detail – it stores one number per KPI per month.
- Anyone looking for dispatch, locate-ticket, inspection-log or permit software, or data pulled automatically from telematics.
How to Use the Excavation Contractor KPI Dashboard in Excel
- Unzip and open the .xlsx. It opens on Home. Nothing to enable.
- Set the reporting year in cell E3 on KPI Input – Actual.
- Make the KPI list yours on KPI Definition, and set each Type to UTB or LTB.
- Type your numbers over the sample on the Actual, Target and PY sheets – MTD and YTD for each month.
- Pick a month in D6 on KPI Dashboard and read the scorecard.
- Drill into one KPI on KPI Trend, then check the group roll-up on KPI Analysis.
Real-World Use Cases
A 40-machine earthmoving contractor’s monthly review. The owner picks last month, starts from the Missed rows and asks why Fuel Cost per Operating Hour and Unplanned Equipment Downtime moved – with prior year beside each number.
A site-prep firm tracking grading quality. The grade foreman watches Grading Accuracy Pass Rate next to Rework Rate, so a slip in first-time grade checks can be read against the rework hours it causes.
A utility-trenching subcontractor reporting to a general contractor. The KPI Analysis group roll-up gives one achievement figure per area for the monthly pack.
Frequently Asked Questions
Does it contain macros?
No. It is a plain .xlsx using worksheet formulas such as VLOOKUP, MATCH, INDEX and COUNTIF. There is no VBA, no Power Query and no add-in, so there is no security prompt and nothing to enable before the scorecard works.
How long does setup take?
Most people have a first report in under an hour: set the year in E3, adjust the 15 KPIs on KPI Definition, then type actual, target and prior-year numbers. Both MTD and YTD are typed, so you control whether a KPI’s year-to-date is a running total or a running average.
Does it check 811 locates, trench inspections or permits?
No. Those KPIs report percentages and rates you enter. The workbook holds no locate tickets, inspection records, injury logs or permits, and it makes no safety, OSHA, CDM or permit-compliance claim. Keep those records in the systems your safety programme requires.
How does this compare with construction management SaaS?
SaaS platforms capture data from the field automatically and support many users at once, for a recurring fee. This workbook is a one-time purchase that reports KPIs you already collect, in a file you own. Choose it for monthly management reporting, not for field data capture.
Are there any known cosmetic issues?
Two, and neither affects a calculation. The Home page and the Read Me page still say “14 KPIs” in their text, while the workbook ships 15 and every formula, card and chart counts all 15. The Read Me’s “Cumulative or average YTD” row also uses examples from another industry (“aircraft deliveries, non-conformance reports”). Both are plain text you can overtype.
Is the sample data real?
No. The 2025 figures are demonstration data so every chart, card and traffic light is populated when you open the file. Delete it and type your own numbers.
About the Author
Built by the NextGenTemplates team, the people behind PK: An Excel Expert, who have spent years building Excel, Power BI and Google Sheets reporting tools for businesses. Every template ships with sample data, unlocked cells and formulas you can read and trace. Questions or a custom build: info@NextGenTemplates.Com.
Explore Related Templates
- Paving Contractor KPI Dashboard in Excel and Concrete Contractor KPI Dashboard in Excel – the same KPI Dashboard line for neighbouring trades.
- Road and Highway Construction KPI Dashboard in Excel – for civil contractors running larger linear projects.
- Heavy Machinery Dashboard in Excel – an analytical dashboard for deeper equipment analysis.
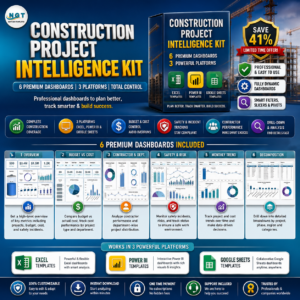
- Construction Project Intelligence Kit – six construction templates across Excel, Power BI and Google Sheets in one bundle.
- Browse the KPI Dashboard category and the MS Excel category.
Click here to read the detailed blog post
Visit our YouTube channel for step-by-step video tutorials
Watch the step-by-step video Demo:
Last updated: September 2026




















Reviews
There are no reviews yet.