

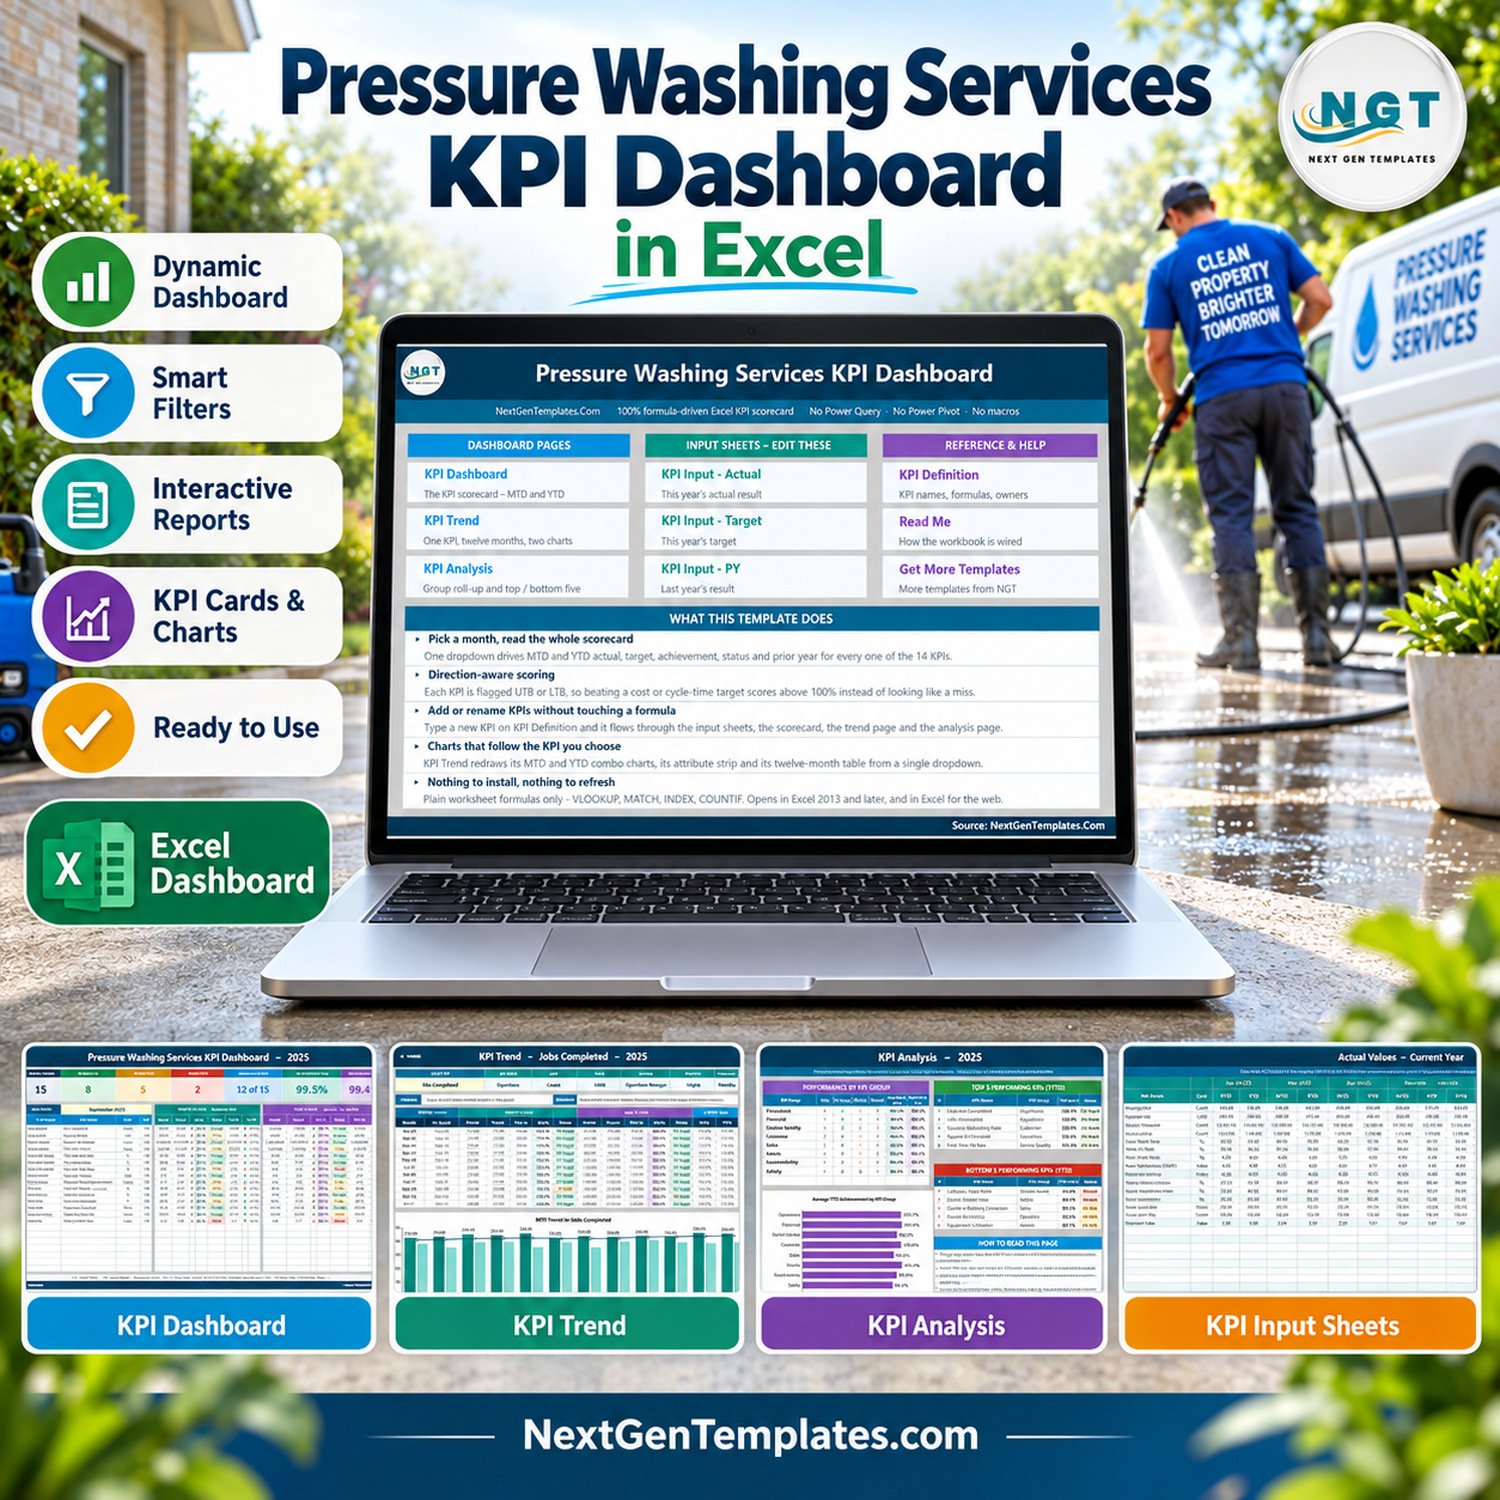
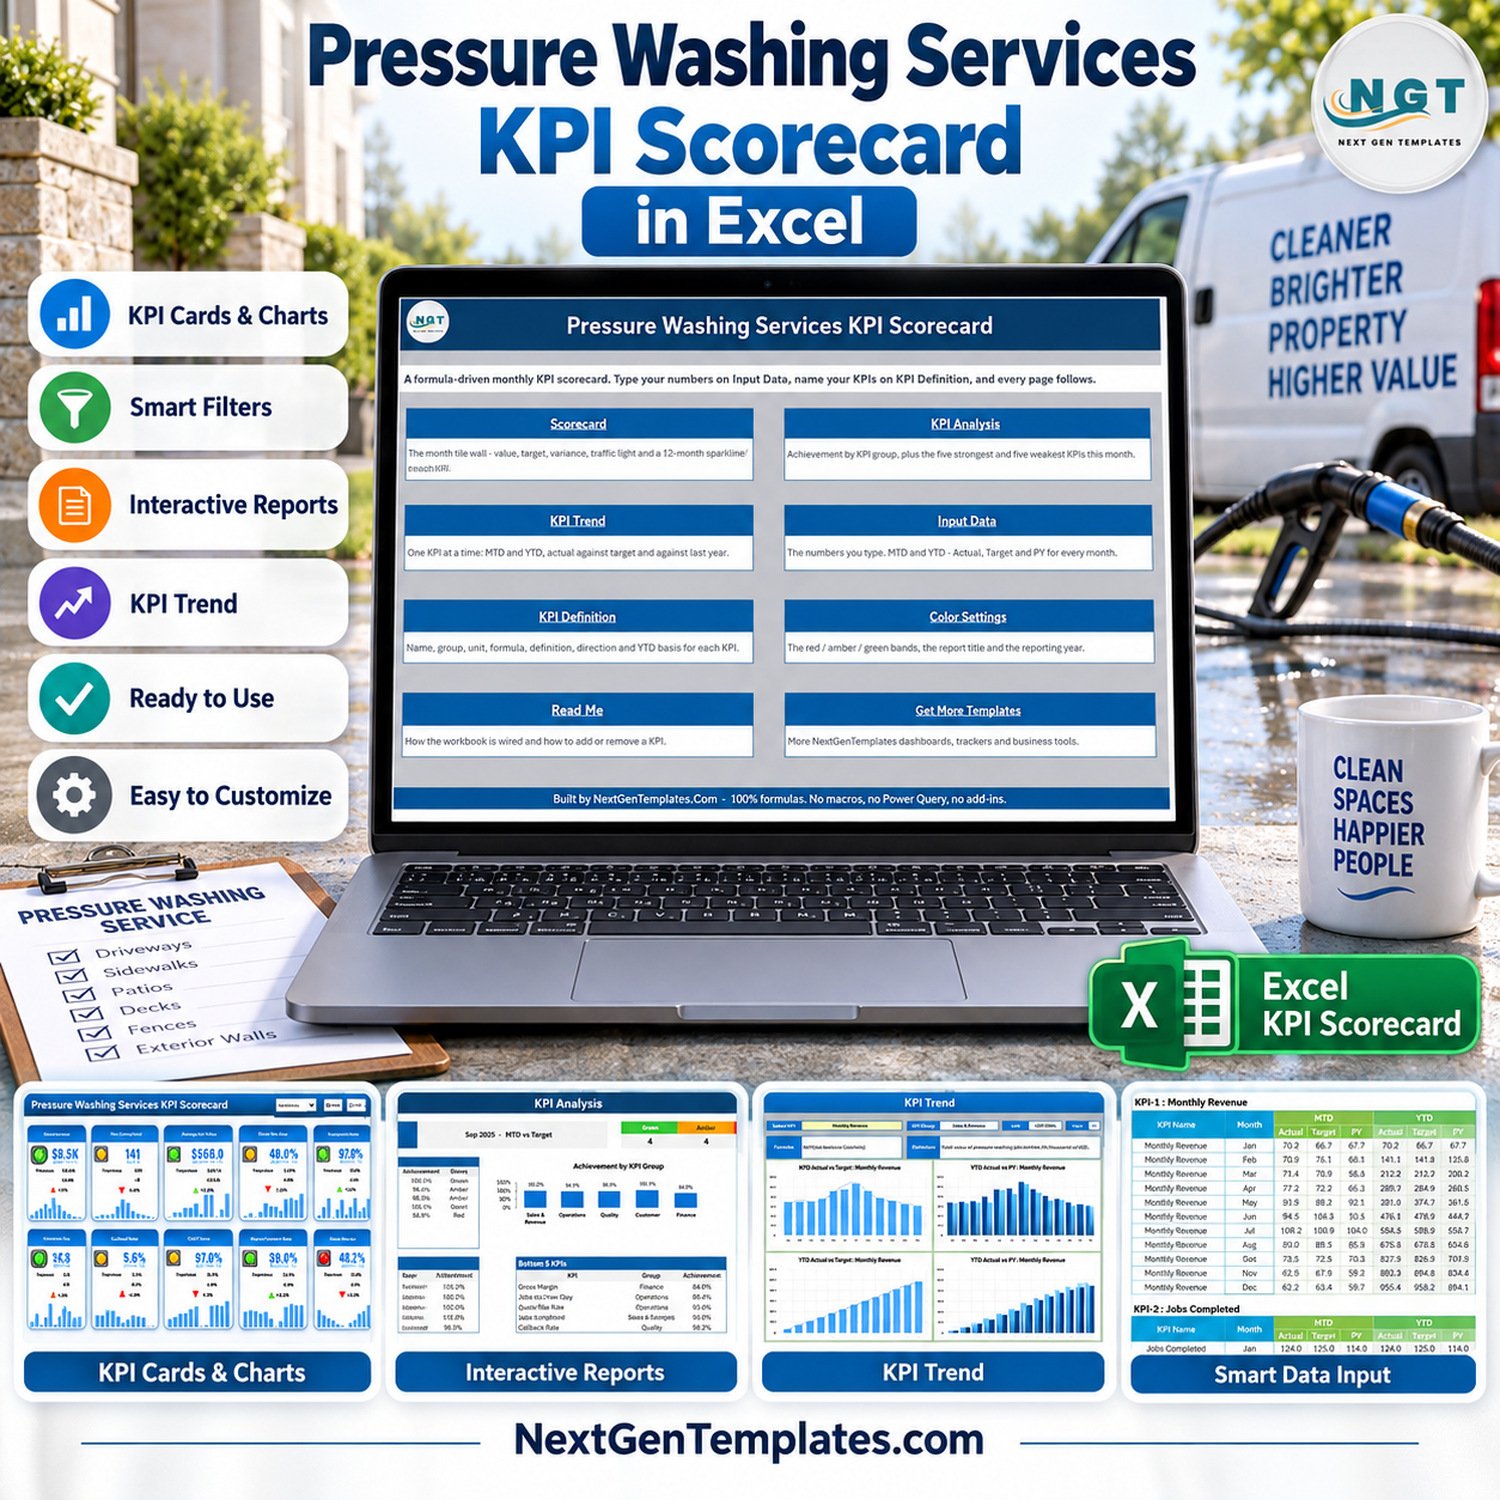
The Pressure Washing Services KPI Dashboard in Excel tracks 15 KPIs in 8 groups on one monthly scorecard, with MTD and YTD actual, target, achievement, traffic-light status and prior-year comparison for every KPI. With the September 2025 sample selected, the cards read 8 On Target, 5 At Risk and 2 Missed for the year to date, and 12 of 15 KPIs are improving on last year.
It is part of the NextGenTemplates KPI Dashboard family: a month picker, traffic lights, a KPI Trend page and a KPI Analysis page. It is not an analytical data dashboard, and it is a different product from the separate Pressure Washing Services KPI Scorecard edition.
✅ Instant download · One-time payment · No subscription · No per-user fees · No macros
🔑 Key Features of the Pressure Washing Services KPI Dashboard in Excel
- 🧽 15 pressure washing KPIs. Jobs Completed, Revenue per Job, Square Feet Cleaned, Crew Productivity, On-Time Arrival Rate, First-Time-Fix Rate, Callback / Redo Rate, Customer Satisfaction (CSAT), Online Review Rating, Quote-to-Booking Conversion, Customer Rebooking Rate, Equipment Utilisation, Equipment Downtime, Water Usage per Job and Safety Incident Rate.
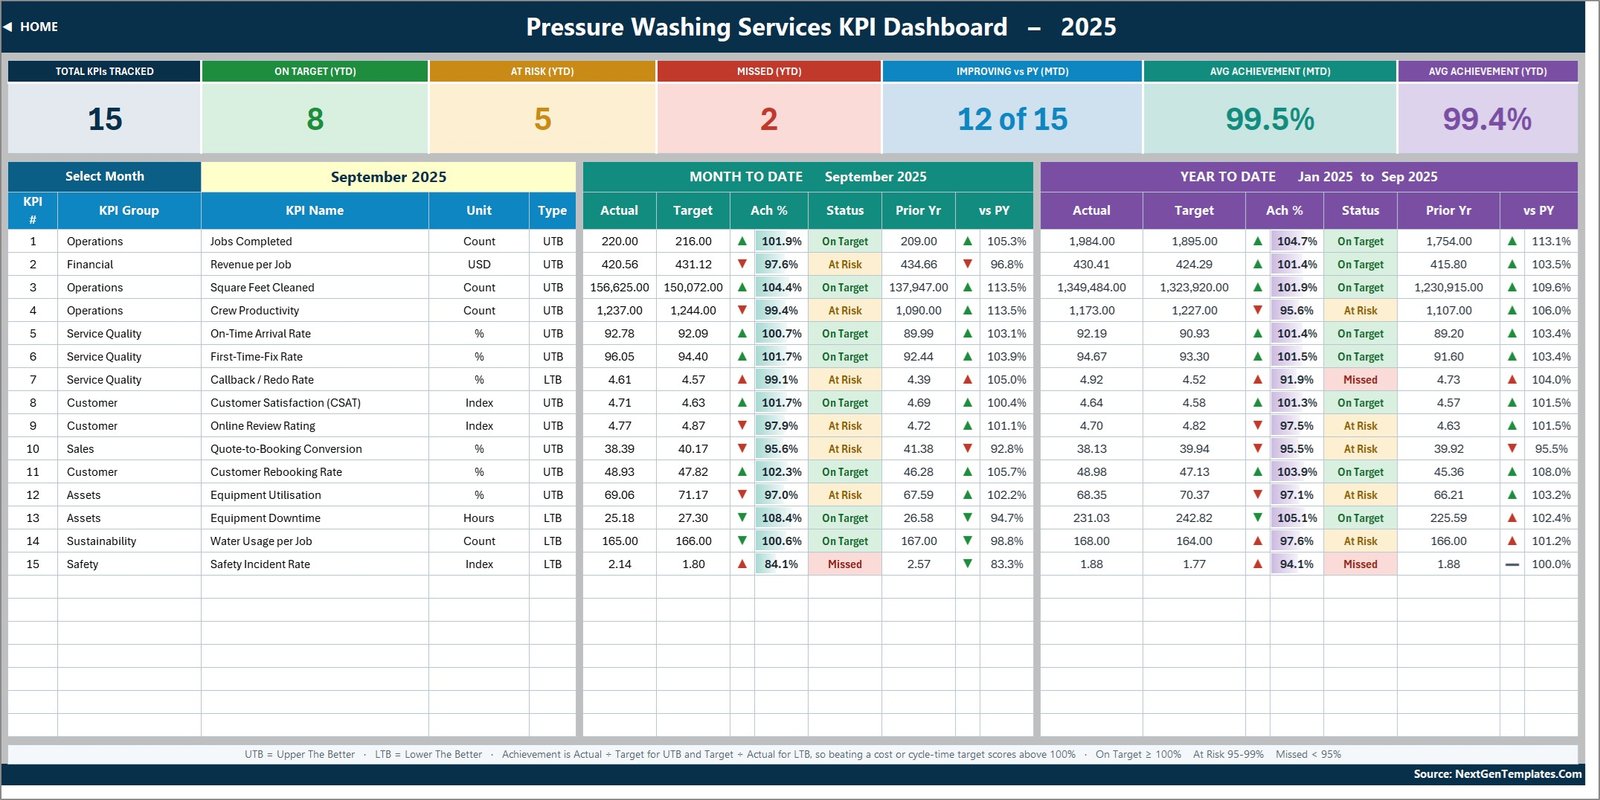
- 📅 One month picker. Cell D6 on KPI Dashboard lists the twelve months of the reporting year. Pick one and the scorecard, the seven summary cards and the KPI Analysis page all recalculate.
- ↕️ Direction-aware scoring. 11 KPIs are Upper The Better and 4 are Lower The Better (Callback / Redo Rate, Equipment Downtime, Water Usage per Job, Safety Incident Rate), so beating a downtime or redo target scores above 100%.
- 🚦 Traffic lights. On Target from 100%, At Risk from 95% to 99%, Missed below 95%.
- ➕ Room for 22 KPIs. Add or rename a KPI on KPI Definition and every other sheet follows, with no formula edits.
- 🧮 Formula-only. No macros, Power Query, Power Pivot or add-ins. Opens in Excel 2013 and later and in Excel for the web.
📦 What’s Inside the Template
11 sheets: 3 dashboard pages, 3 input sheets, KPI Definition, Read Me, Get More Templates, a Home page and a Support sheet of helper formulas.
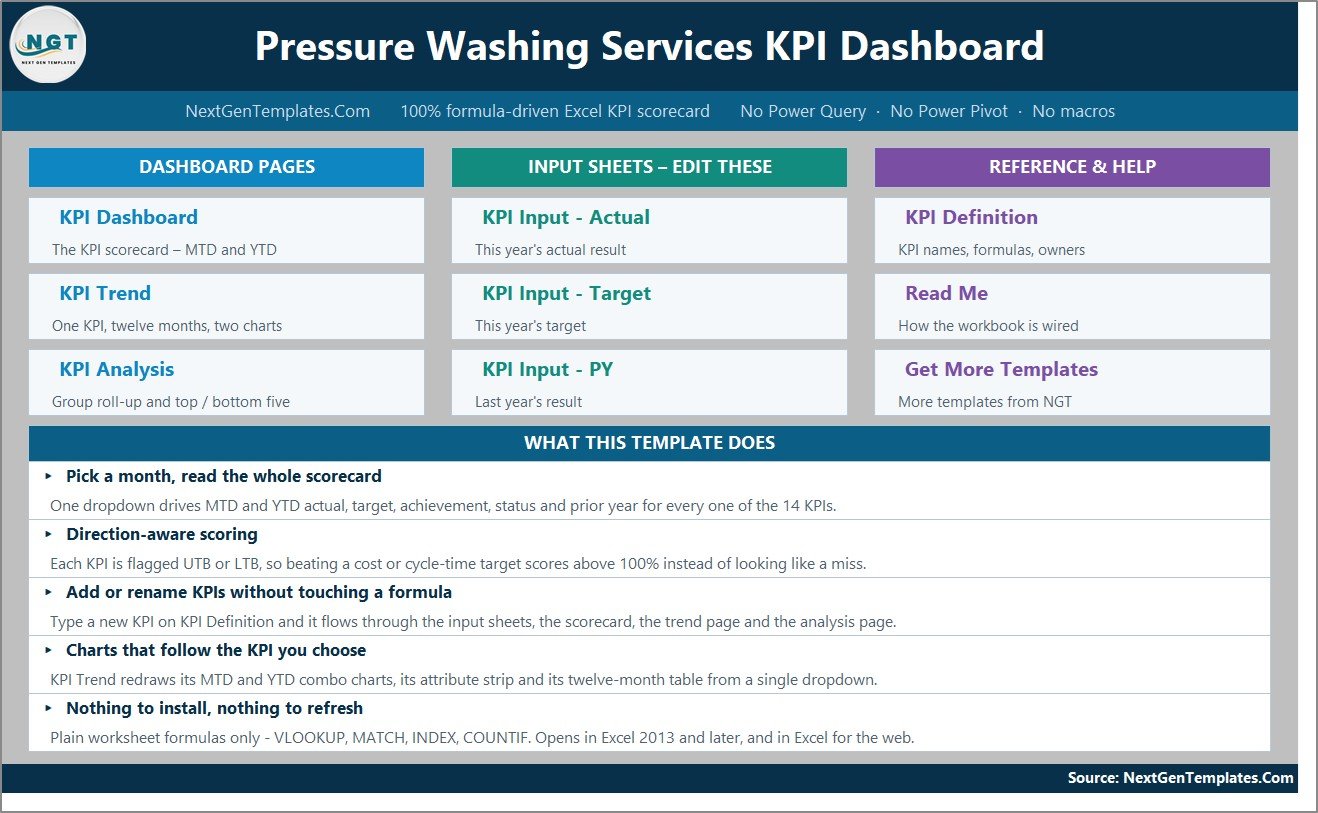
Home
Links to every page, grouped as Dashboard Pages, Input Sheets and Reference & Help, plus a summary of what the template does.
KPI Dashboard
Seven cards (Total KPIs Tracked 15, On Target YTD 8, At Risk YTD 5, Missed YTD 2, Improving vs PY 12 of 15, Avg Achievement MTD 99.5%, YTD 99.4%) above one row per KPI with Month To Date and Year To Date blocks.
KPI Trend
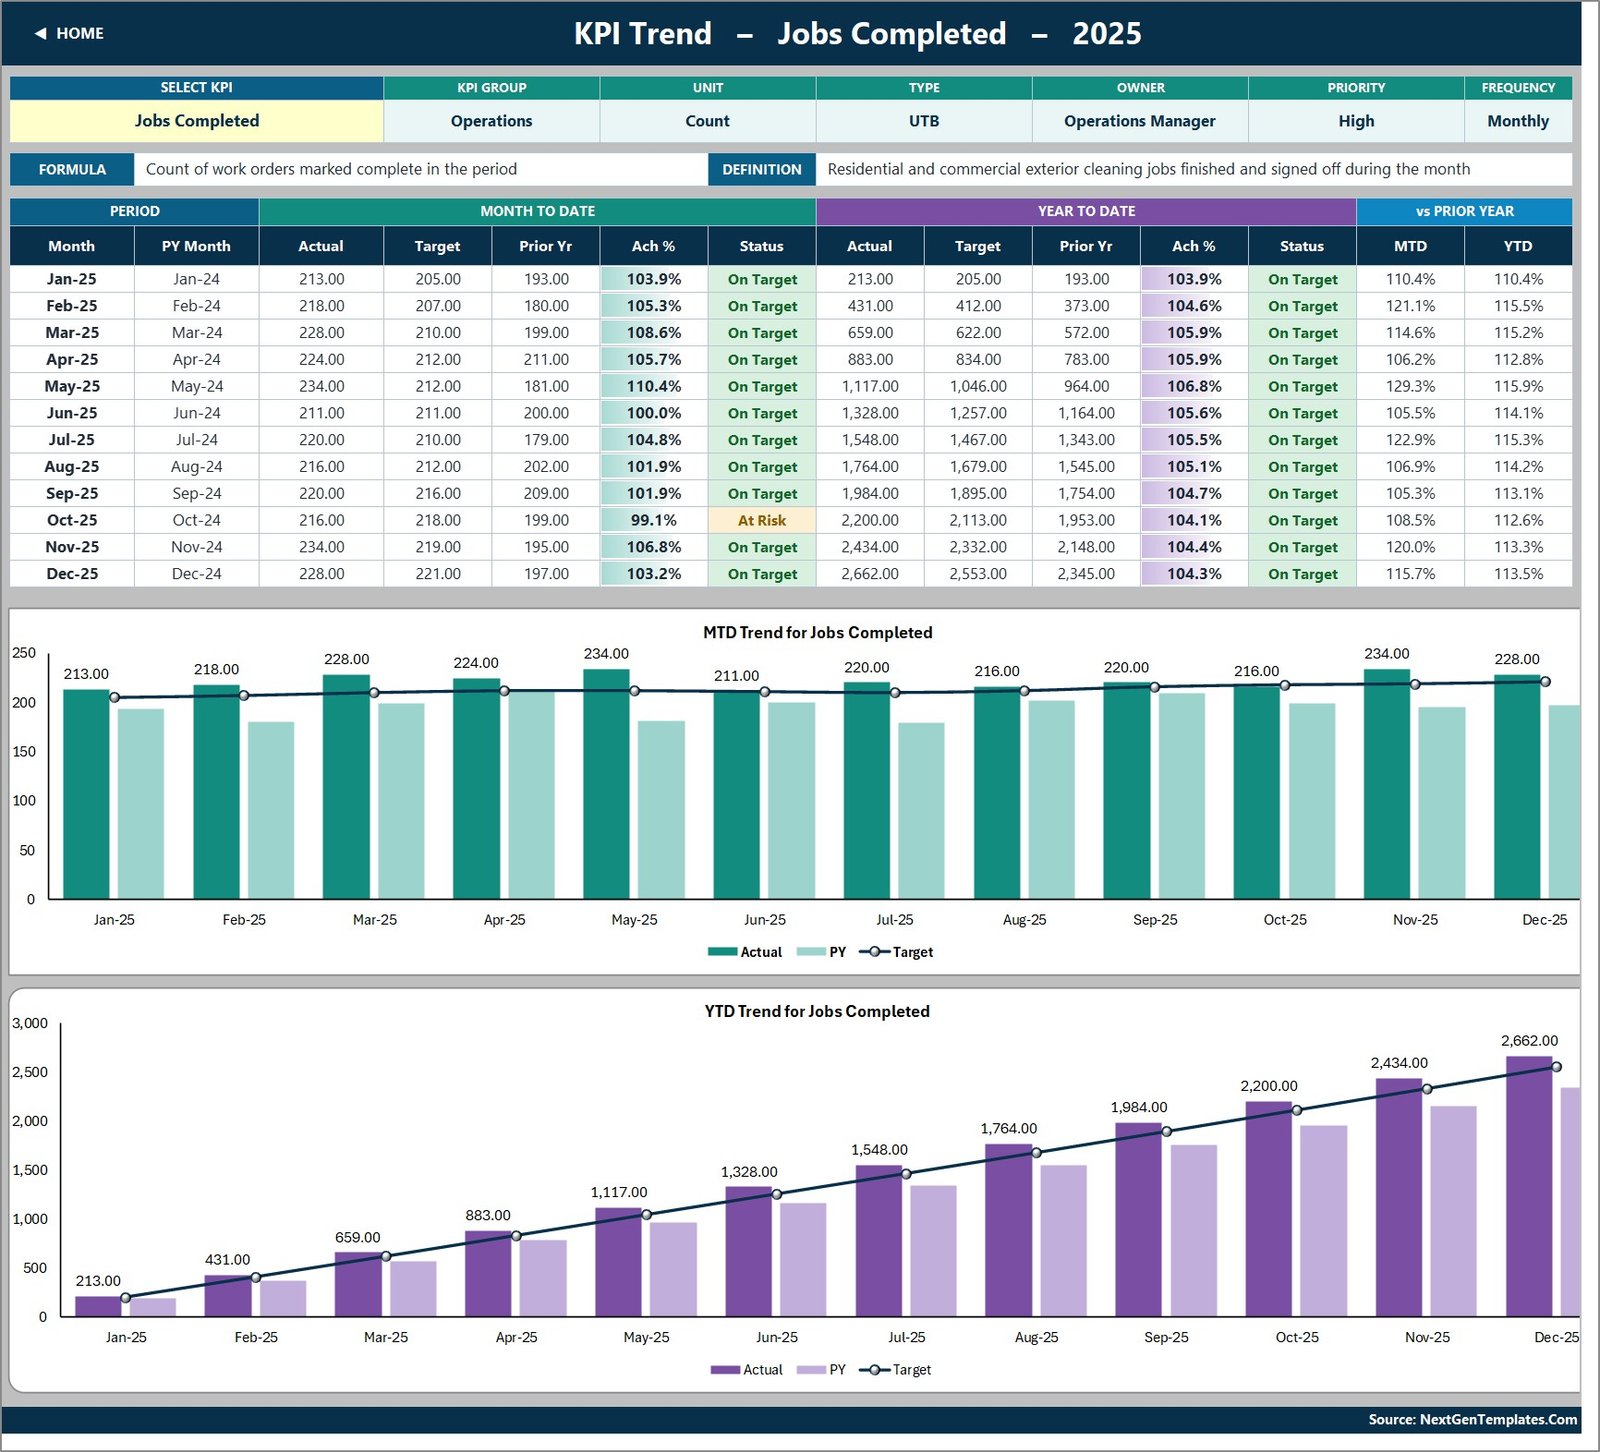
Pick a KPI in cell B4 to see its group, unit, type, owner, priority, frequency, formula and definition, a twelve-month table, and the MTD Trend and YTD Trend charts with actual, prior year and a target line.
KPI Analysis
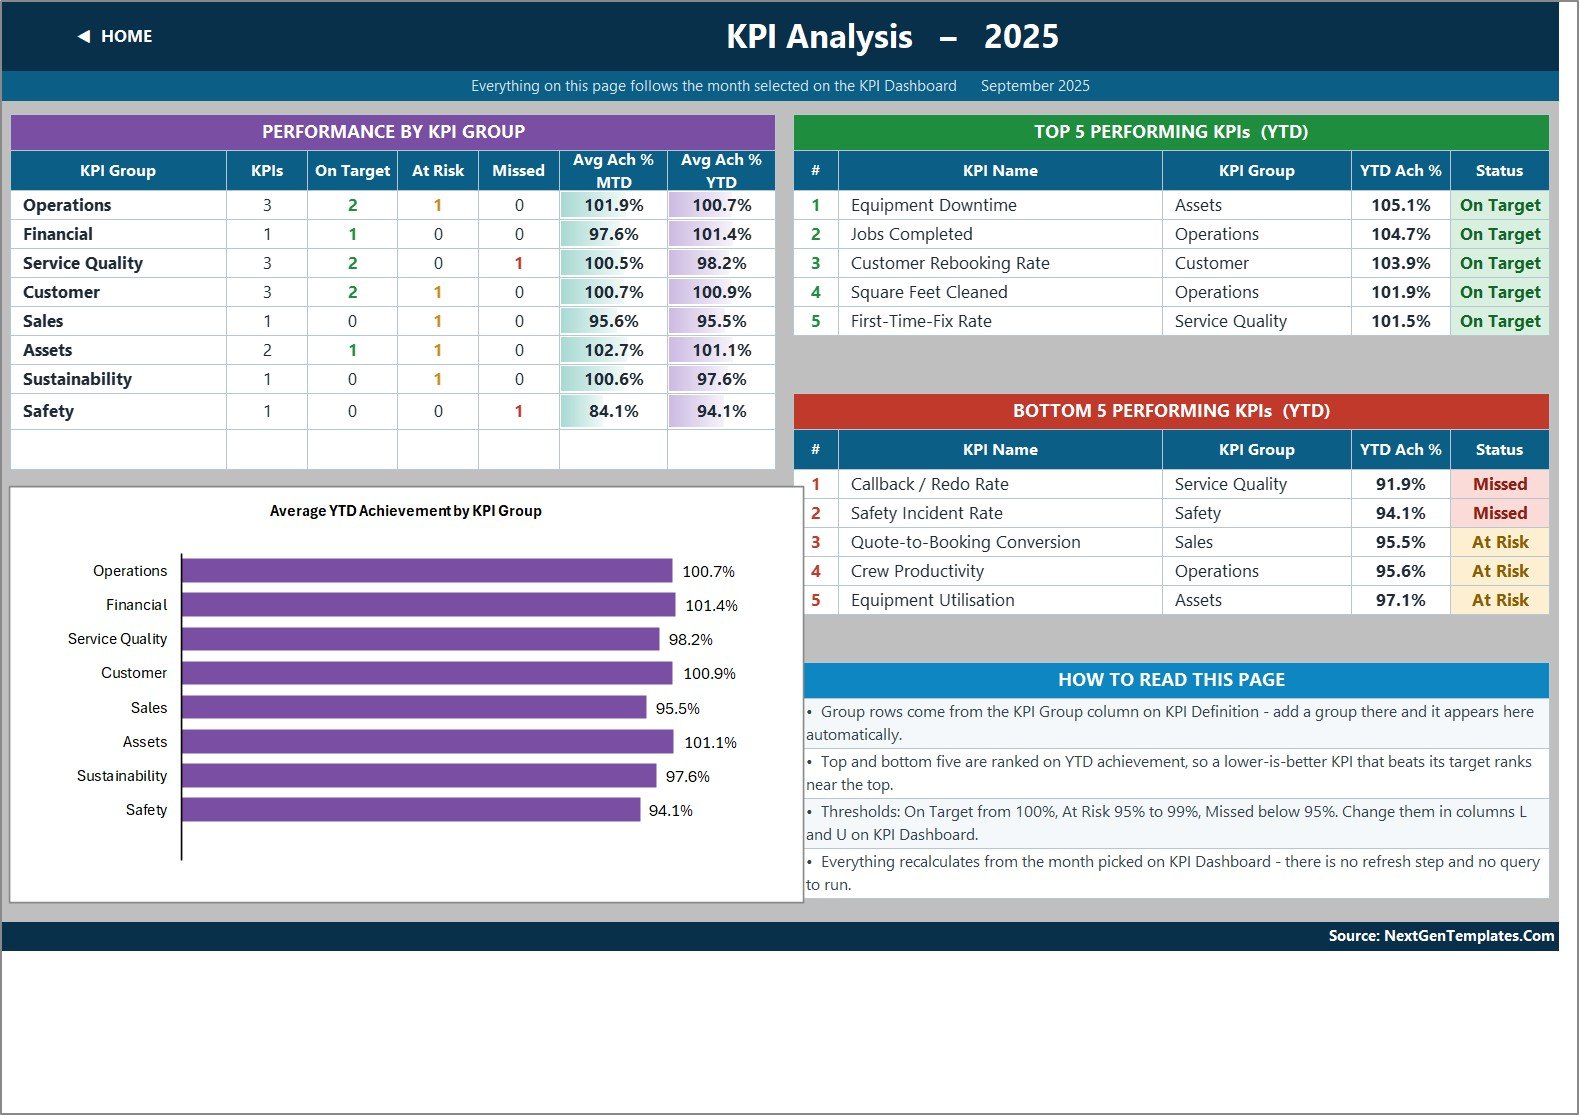
Performance by KPI Group, Average YTD Achievement by KPI Group, and the Top 5 and Bottom 5 Performing KPIs (YTD). In the sample, Equipment Downtime leads at 105.1% and Callback / Redo Rate trails at 91.9%.
KPI Input – Actual, Target and PY
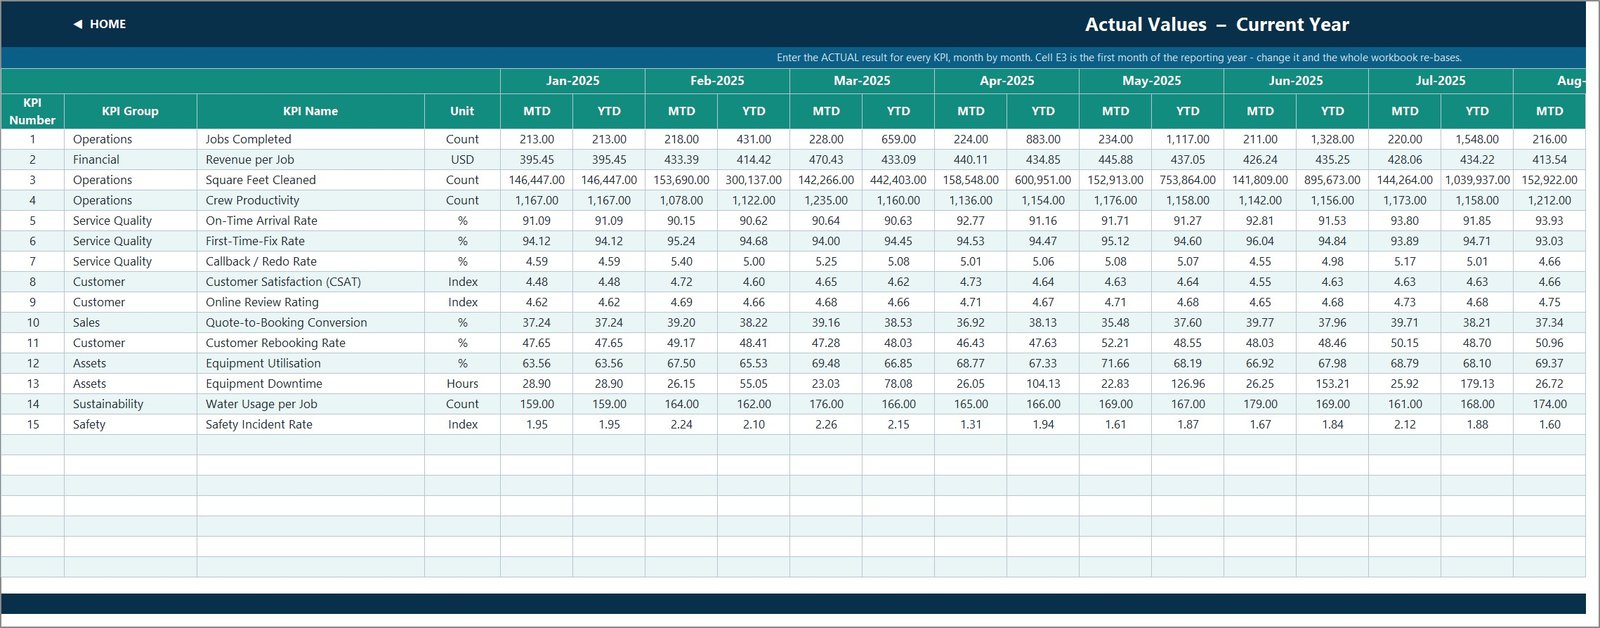
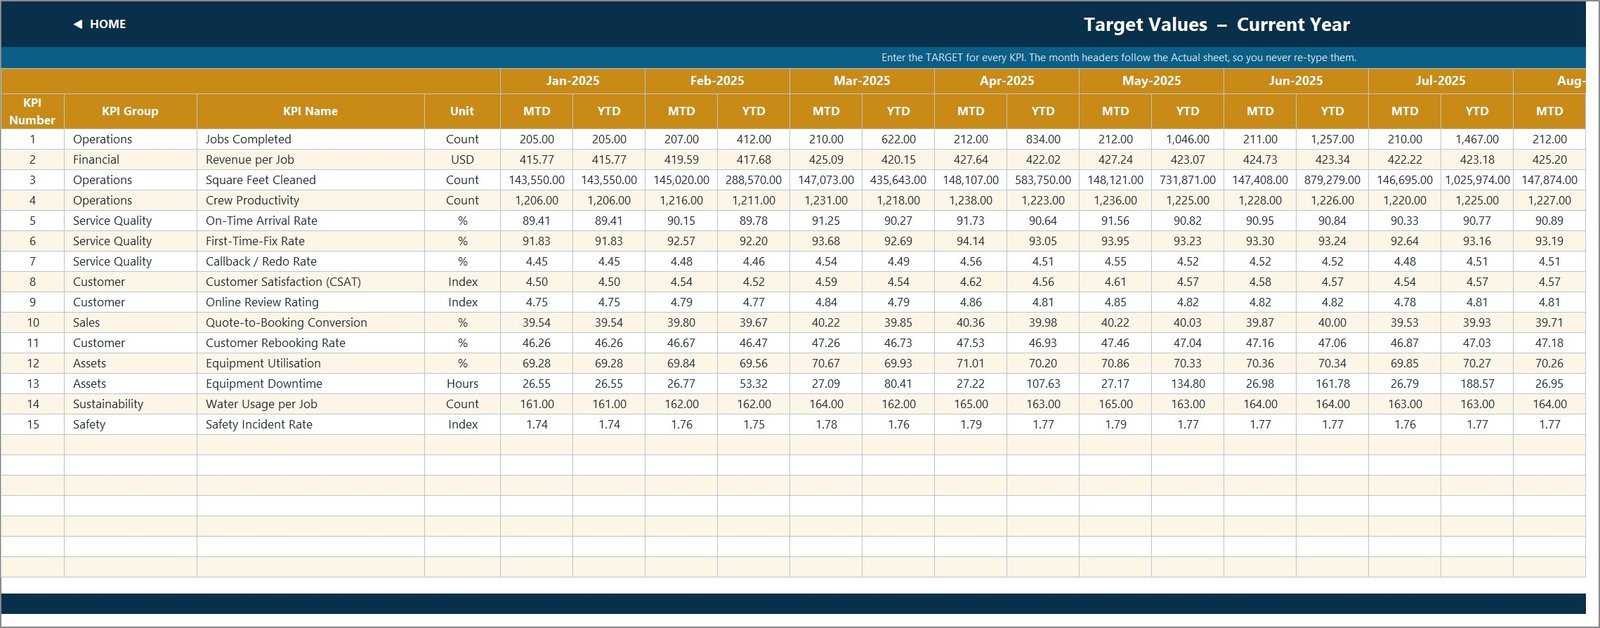
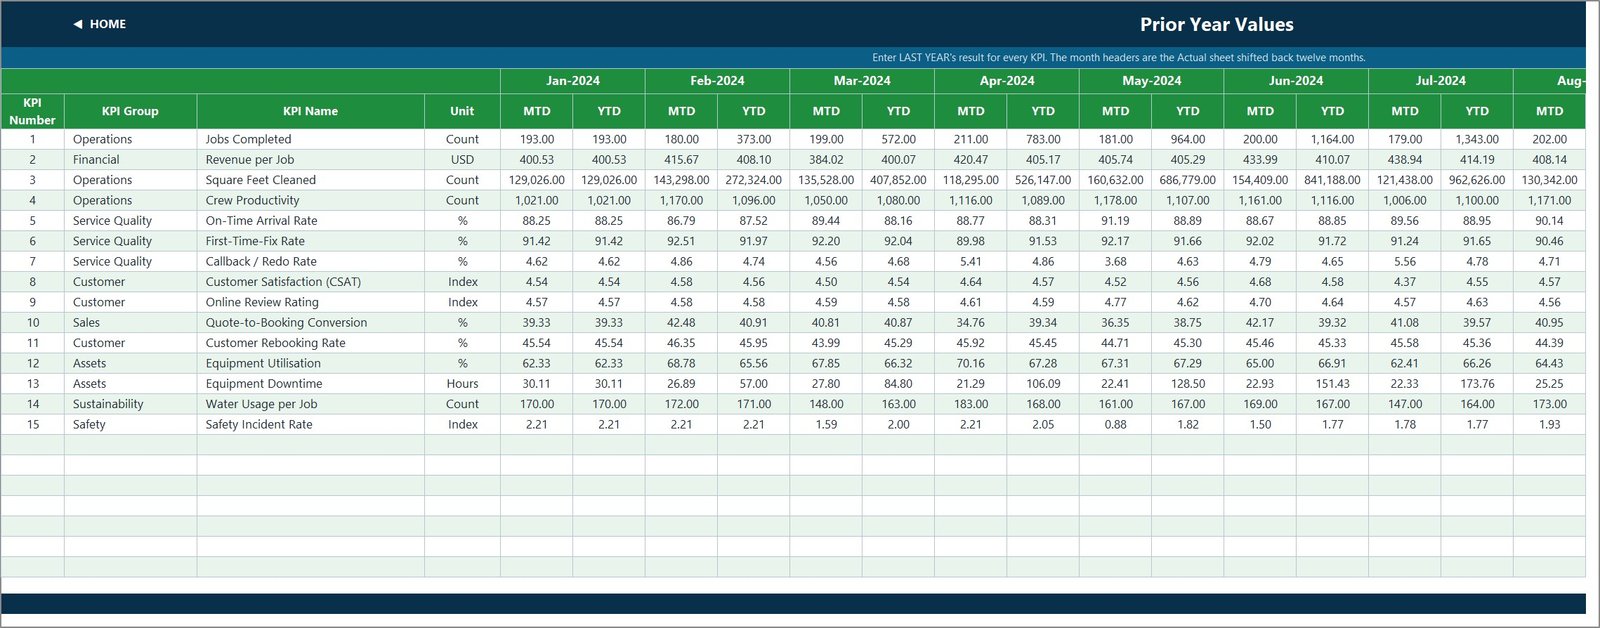
Three grids with an MTD and a YTD column for each month. Cell E3 on the Actual sheet sets the first month of the year; the Target and PY headers follow it.
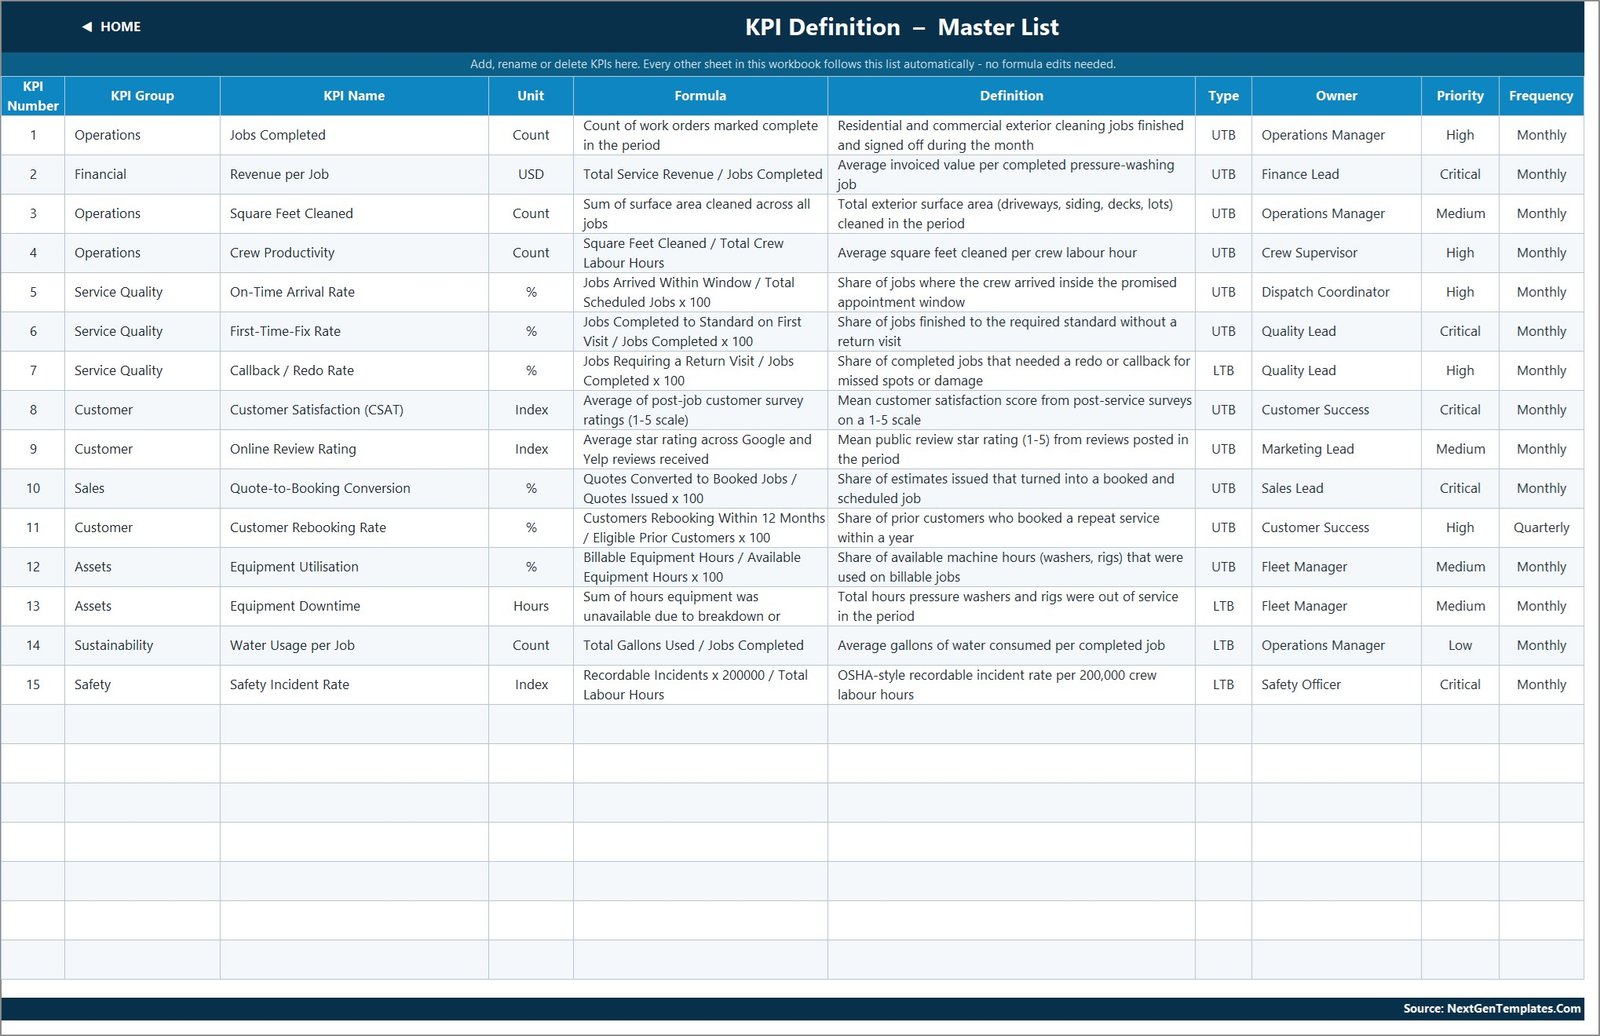
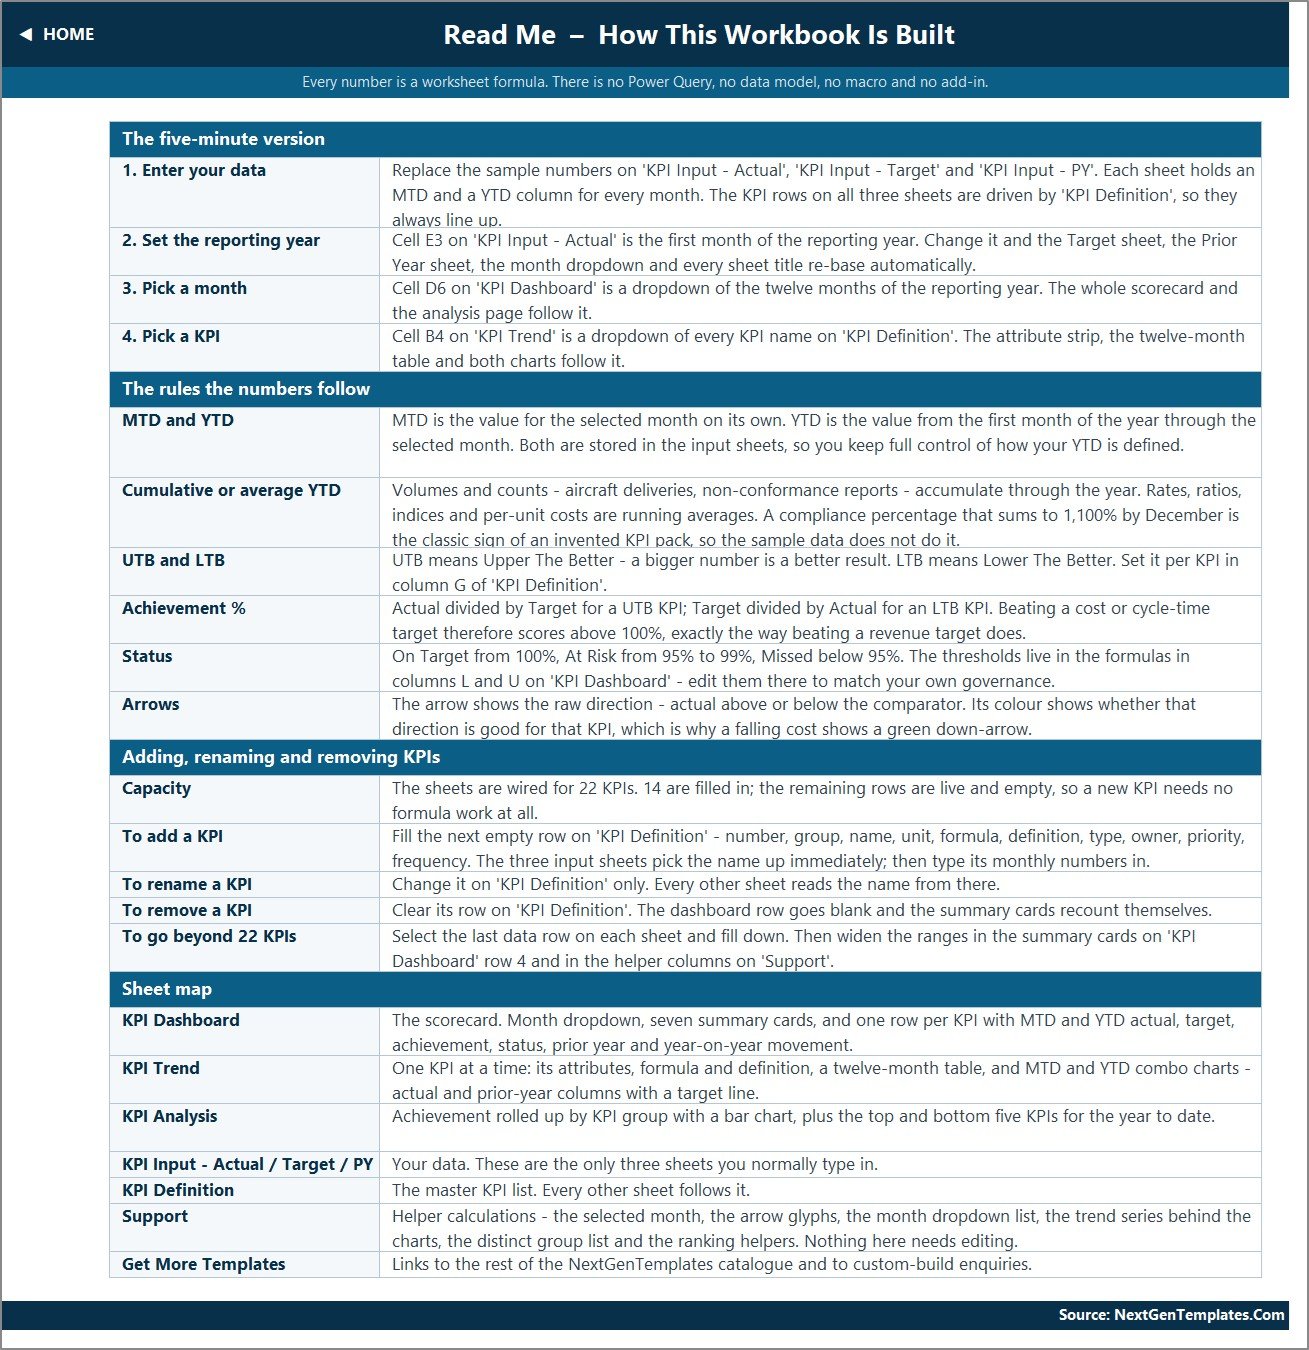
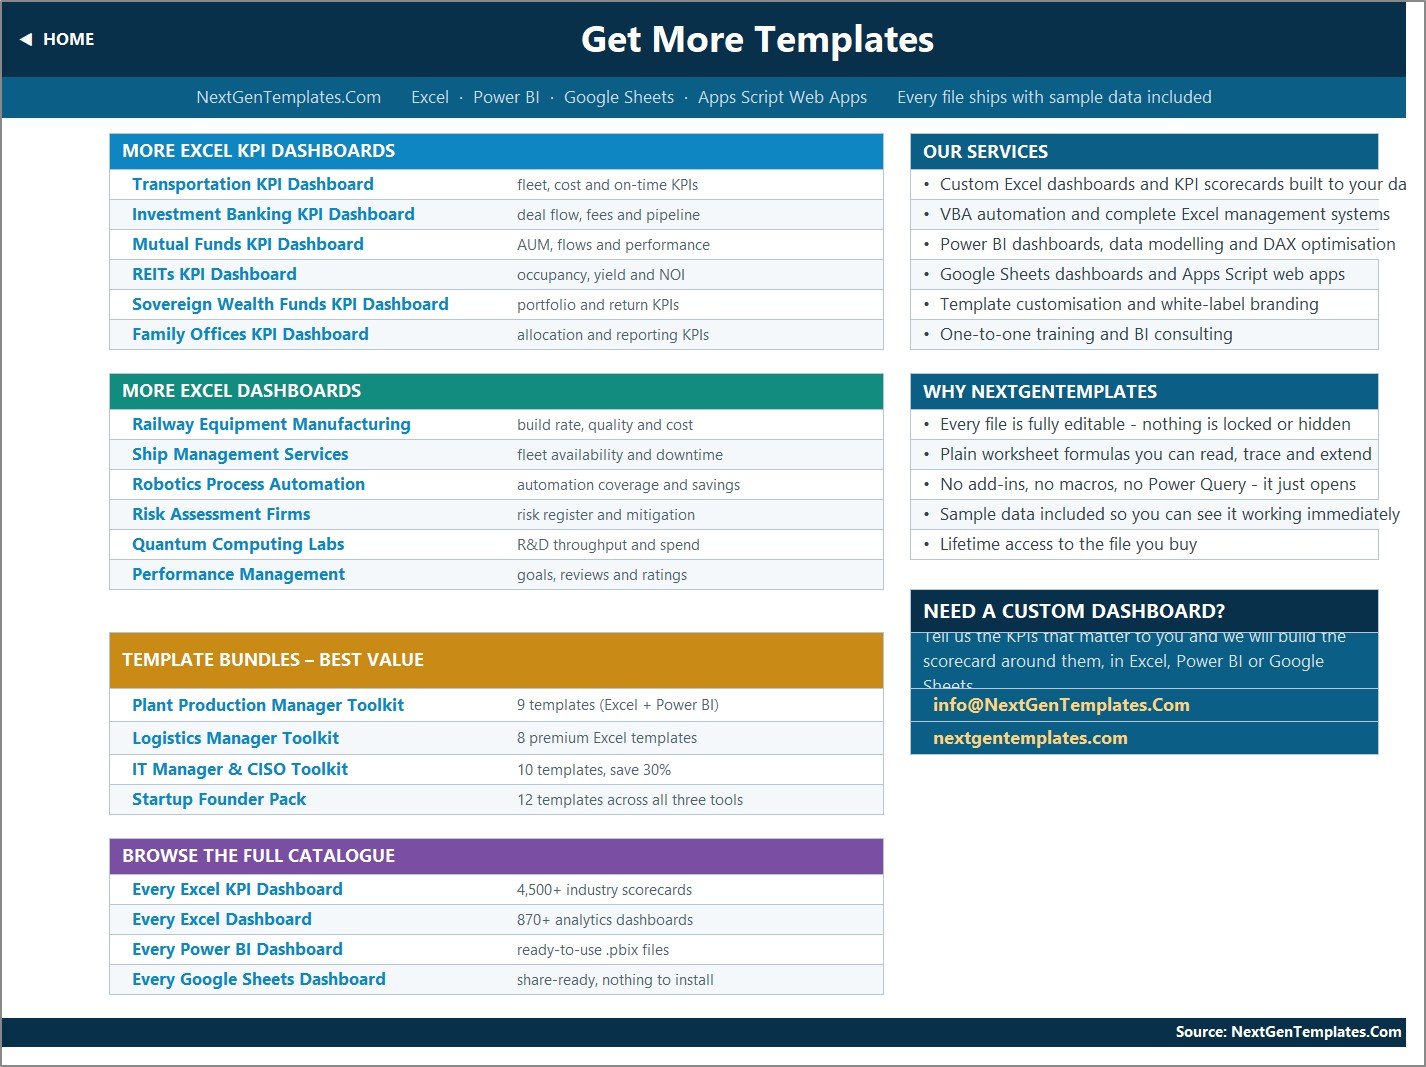
KPI Definition, Read Me and Get More Templates
The master KPI list (group, unit, formula, definition, UTB/LTB, owner, priority, frequency), the build notes, and links to more templates.
📊 This Template vs. Google Sheets vs. Field Service Software
| Feature | Pressure Washing KPI Dashboard (Excel) | Google Sheets KPI template | Field service software (Jobber / Housecall Pro) |
|---|---|---|---|
| Cost | ✅ $12.99 one-time | One-time template price | Monthly subscription |
| Platform | Excel 2013+, Excel for the web | Google Sheets | Vendor web and mobile app |
| Setup time | ✅ Type monthly figures on three sheets | Similar | Account setup and onboarding |
| Real-time collaboration | Via OneDrive or SharePoint | ✅ Native | ✅ Native |
| Mobile access | Excel mobile app | Sheets app | ✅ Vendor app |
| Customisable KPIs | ✅ Up to 22, no formula edits | Depends on template | Fixed vendor reports |
| MTD / YTD traffic lights with UTB and LTB | ✅ Built in | Depends on template | Rarely |
| Scheduling, quoting, invoicing | No | No | ✅ Yes |
| Year-1 cost at 5 users | ✅ No per-user fee | No per-user fee | Plan and seat pricing |
For pressure washing owners who want a disciplined monthly KPI review without another subscription, this workbook sits in the sweet spot.
👥 Who This Template Is For, and Who It Is Not For
✅ Built for:
- Owners of residential and commercial pressure washing, power washing and exterior cleaning companies
- Operations managers and crew supervisors reporting jobs, square footage and crew productivity
- Office and sales leads watching quote conversion, rebooking and review ratings
❌ Not for:
- Businesses that need scheduling, dispatch, quoting or invoicing (use field service software)
- Anyone who needs job-level, crew-level or per-site breakdowns rather than company-wide monthly KPIs
- Teams looking for a chemical-safety, runoff or environmental compliance record
⚙️ How to Use It
- Unzip the download and open the .xlsx in Excel.
- Review the 15 KPIs on KPI Definition; rename, add or clear rows to suit your business.
- Set the first month of your reporting year in cell E3 on KPI Input – Actual.
- Type monthly MTD and YTD actuals, targets and prior-year values on the three input sheets.
- Pick a month in cell D6 on KPI Dashboard, then choose a KPI on KPI Trend.
💼 Real-World Use Cases
An owner running three rigs enters the month’s numbers on the first Monday and sees Revenue per Job At Risk at 97.6% while Jobs Completed is On Target, a sign that crews are busy but job value is slipping.
An operations manager opens KPI Trend on Callback / Redo Rate, the lowest YTD performer at 91.9%, to see whether redos are a one-month spike or a pattern before retraining crews.
A sales lead tracks Quote-to-Booking Conversion (95.5% YTD, At Risk) against Customer Rebooking Rate (103.9%) to decide whether to spend on new leads or on repeat customers.
❓ Frequently Asked Questions
What KPIs does the pressure washing KPI dashboard track?
It ships with 15 KPIs in 8 groups: Operations (3), Financial (1), Service Quality (3), Customer (3), Sales (1), Assets (2), Sustainability (1) and Safety (1). They include Jobs Completed, Revenue per Job, First-Time-Fix Rate, Equipment Downtime and Water Usage per Job. You can edit them or add more, up to 22.
Does it need macros or Power Query?
No. It is a plain .xlsx built from worksheet formulas such as VLOOKUP, INDEX, MATCH and COUNTIF. It opens in Excel 2013 and later and in Excel for the web.
How long does setup take?
If your monthly figures already exist, setup is mostly typing them into the Actual, Target and PY sheets and setting the first month in cell E3. The dashboard pages read the KPI list and month headers automatically.
Is this the KPI Scorecard or the KPI Dashboard?
This listing is the KPI Dashboard edition, with a month-picker scorecard, a KPI Trend page and a KPI Analysis page for 15 KPIs. A separate Pressure Washing Services KPI Scorecard edition is a different workbook.
Does it track EPA, stormwater or chemical-safety compliance?
No. Water Usage per Job and Safety Incident Rate are numbers you enter. The workbook does not record chemical use, runoff or permits, and it is not evidence of environmental, OSHA or any other compliance.
How does it compare with field service software?
Tools such as Jobber or Housecall Pro run scheduling, quotes and invoices on a subscription. This workbook does one job, the monthly KPI review with targets, prior year and traffic lights, for a one-time price.
👤 About the Author
Built by PK, a Microsoft Certified Professional with 15+ years of Excel, Google Sheets and Power BI experience and the founder of NextGenTemplates, whose YouTube channels (@PKAnExcelExpert, @NextGenTemplates, @NeoTechNavigators) reach 300K+ subscribers. Every template is hand-built and tested before release.
🔗 Explore Related Templates
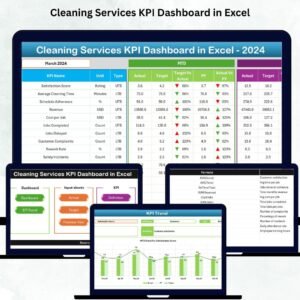
- Cleaning Services KPI Dashboard in Excel: the same month-picker scorecard for general cleaning companies.
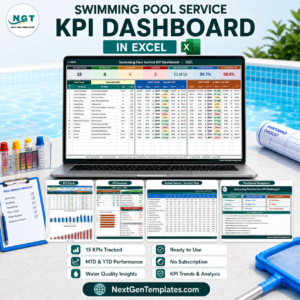
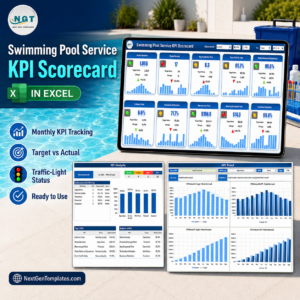
- Swimming Pool Service KPI Dashboard in Excel: KPIs for another route-based home service.
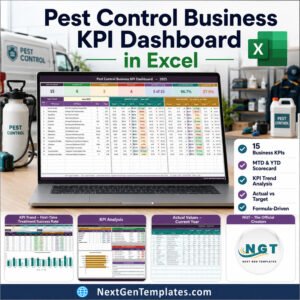
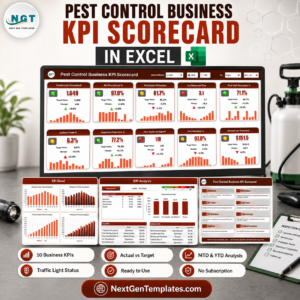
- Pest Control Business KPI Dashboard in Excel: technician, callback and customer KPIs.
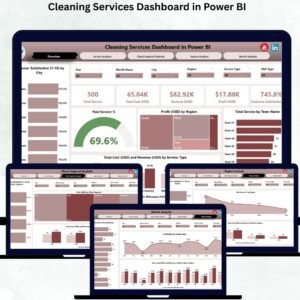
- Cleaning Services Dashboard in Excel: an analytical dashboard for cleaning revenue and jobs.
Browse every KPI Dashboard template.
📖 Click here to read the Detailed Blog Post
🎥 Visit our YouTube channel for step-by-step video tutorials
👉 YouTube.com/@NextGenTemplates
📅 Last updated: September 2026





















Reviews
There are no reviews yet.