

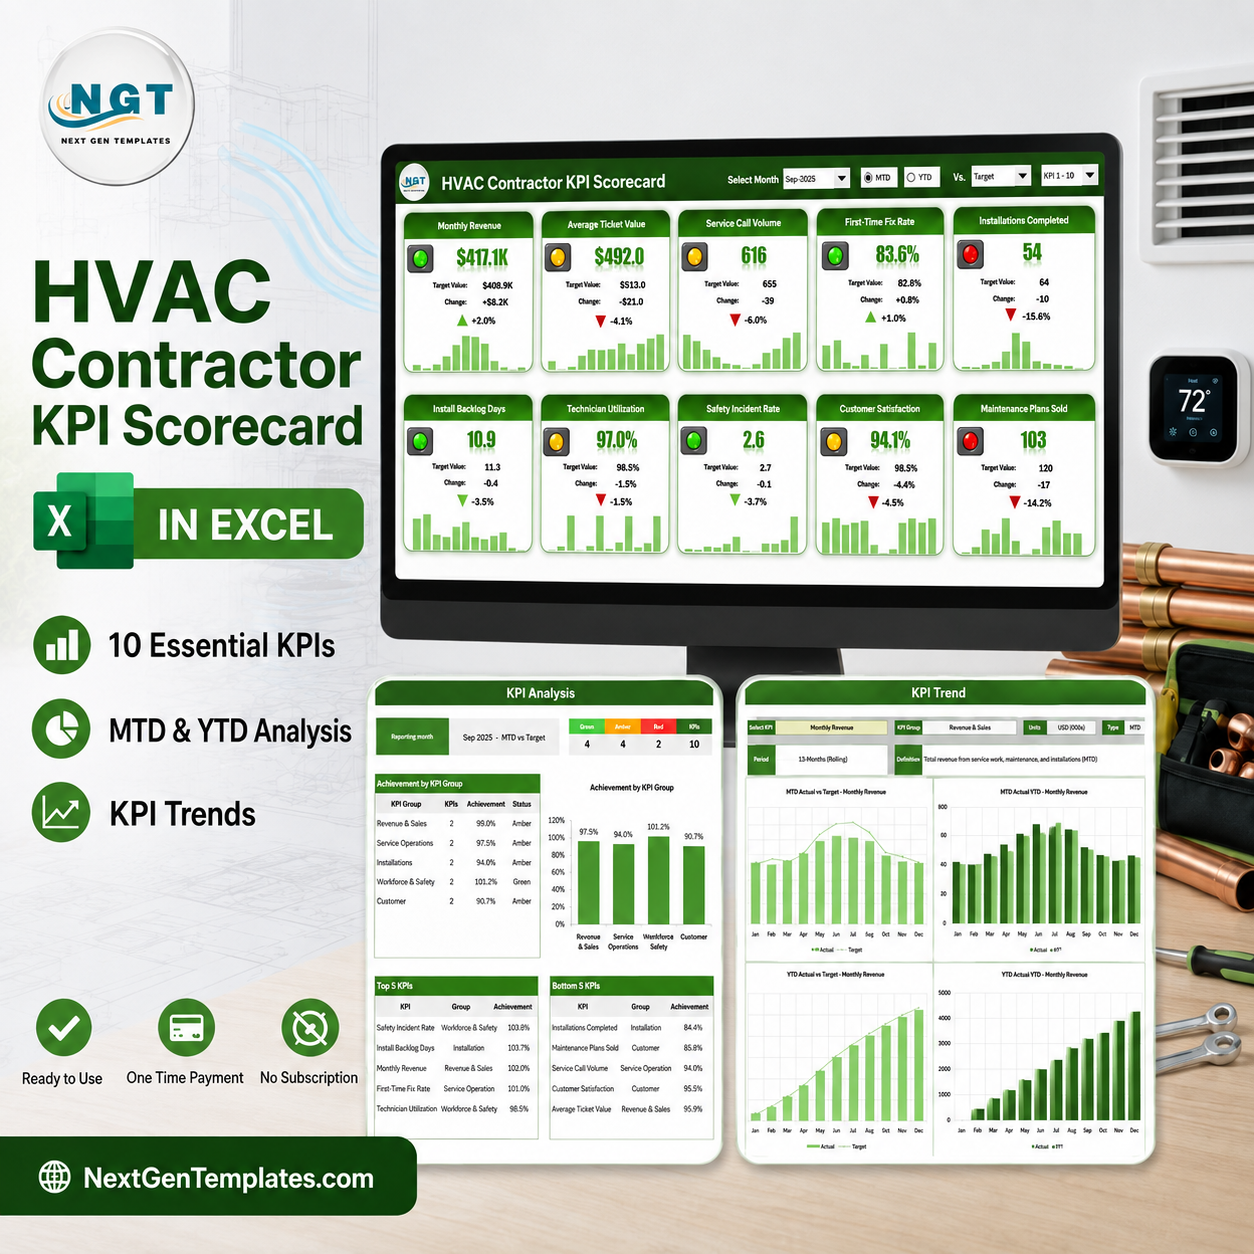

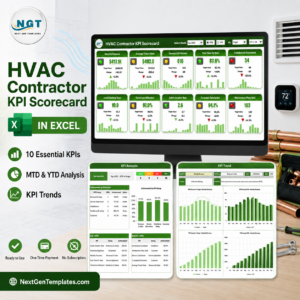
The HVAC Contractor KPI Scorecard in Excel turns a month of service, install and maintenance numbers into a single page you can read in about ten seconds. Pick a month from one dropdown and 10 KPIs across 5 groups – Revenue & Sales, Service Operations, Installation, Workforce & Safety and Customer – each show the value, the target, the variance, a red / amber / green traffic light and a twelve-month sparkline. Nine worksheets, room for 20 KPIs, and 100% plain worksheet formulas: no macros, no Power Query, no Power Pivot, no add-ins. Instant download, one-time payment, no subscription, and you own the file outright.
This is the scorecard line, not an analytical dashboard. It does not slice a transaction table by branch or technician – it reports the finished monthly figures you already close your books on, against the targets you set, and tells you which ones missed.
Key Features of the HVAC Contractor KPI Scorecard in Excel
- One month picker drives everything. Select Month in the header re-points every tile, both analysis pages and the whole trend page at once.
- MTD or YTD on a toggle. A single radio pair switches the entire scorecard between the month and the year to date.
- Three comparison bases. The “Vs.” dropdown compares actual against Target, against the same period last year (PY), or against the Prior Month.
- Direction-aware traffic lights. Every KPI is marked UTB (upper the better) or LTB (lower the better), so Install Backlog Days and Safety Incident Rate score correctly when they fall, instead of being punished for it.
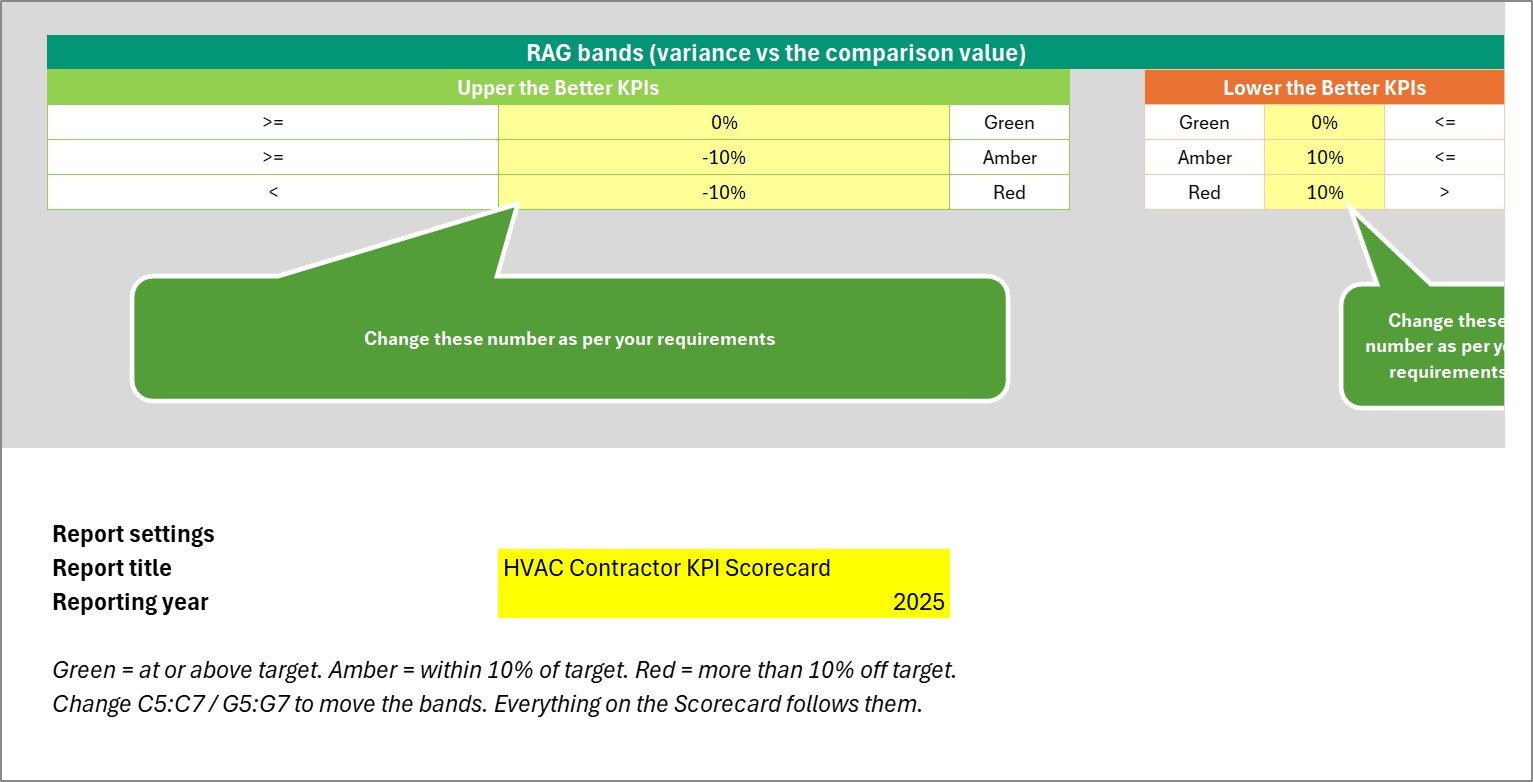
- Editable RAG bands. Green at or above target, amber within 10%, red more than 10% off – and the two band tables on the Color Settings sheet are yours to move. Every page follows them.
- Twelve-month sparkline on every tile, so a green light that has been sliding all year is still visible.
- Room for 20 KPIs. The scorecard shows ten at a time; a KPI set picker in the header switches between KPI 1-10 and KPI 11-20.
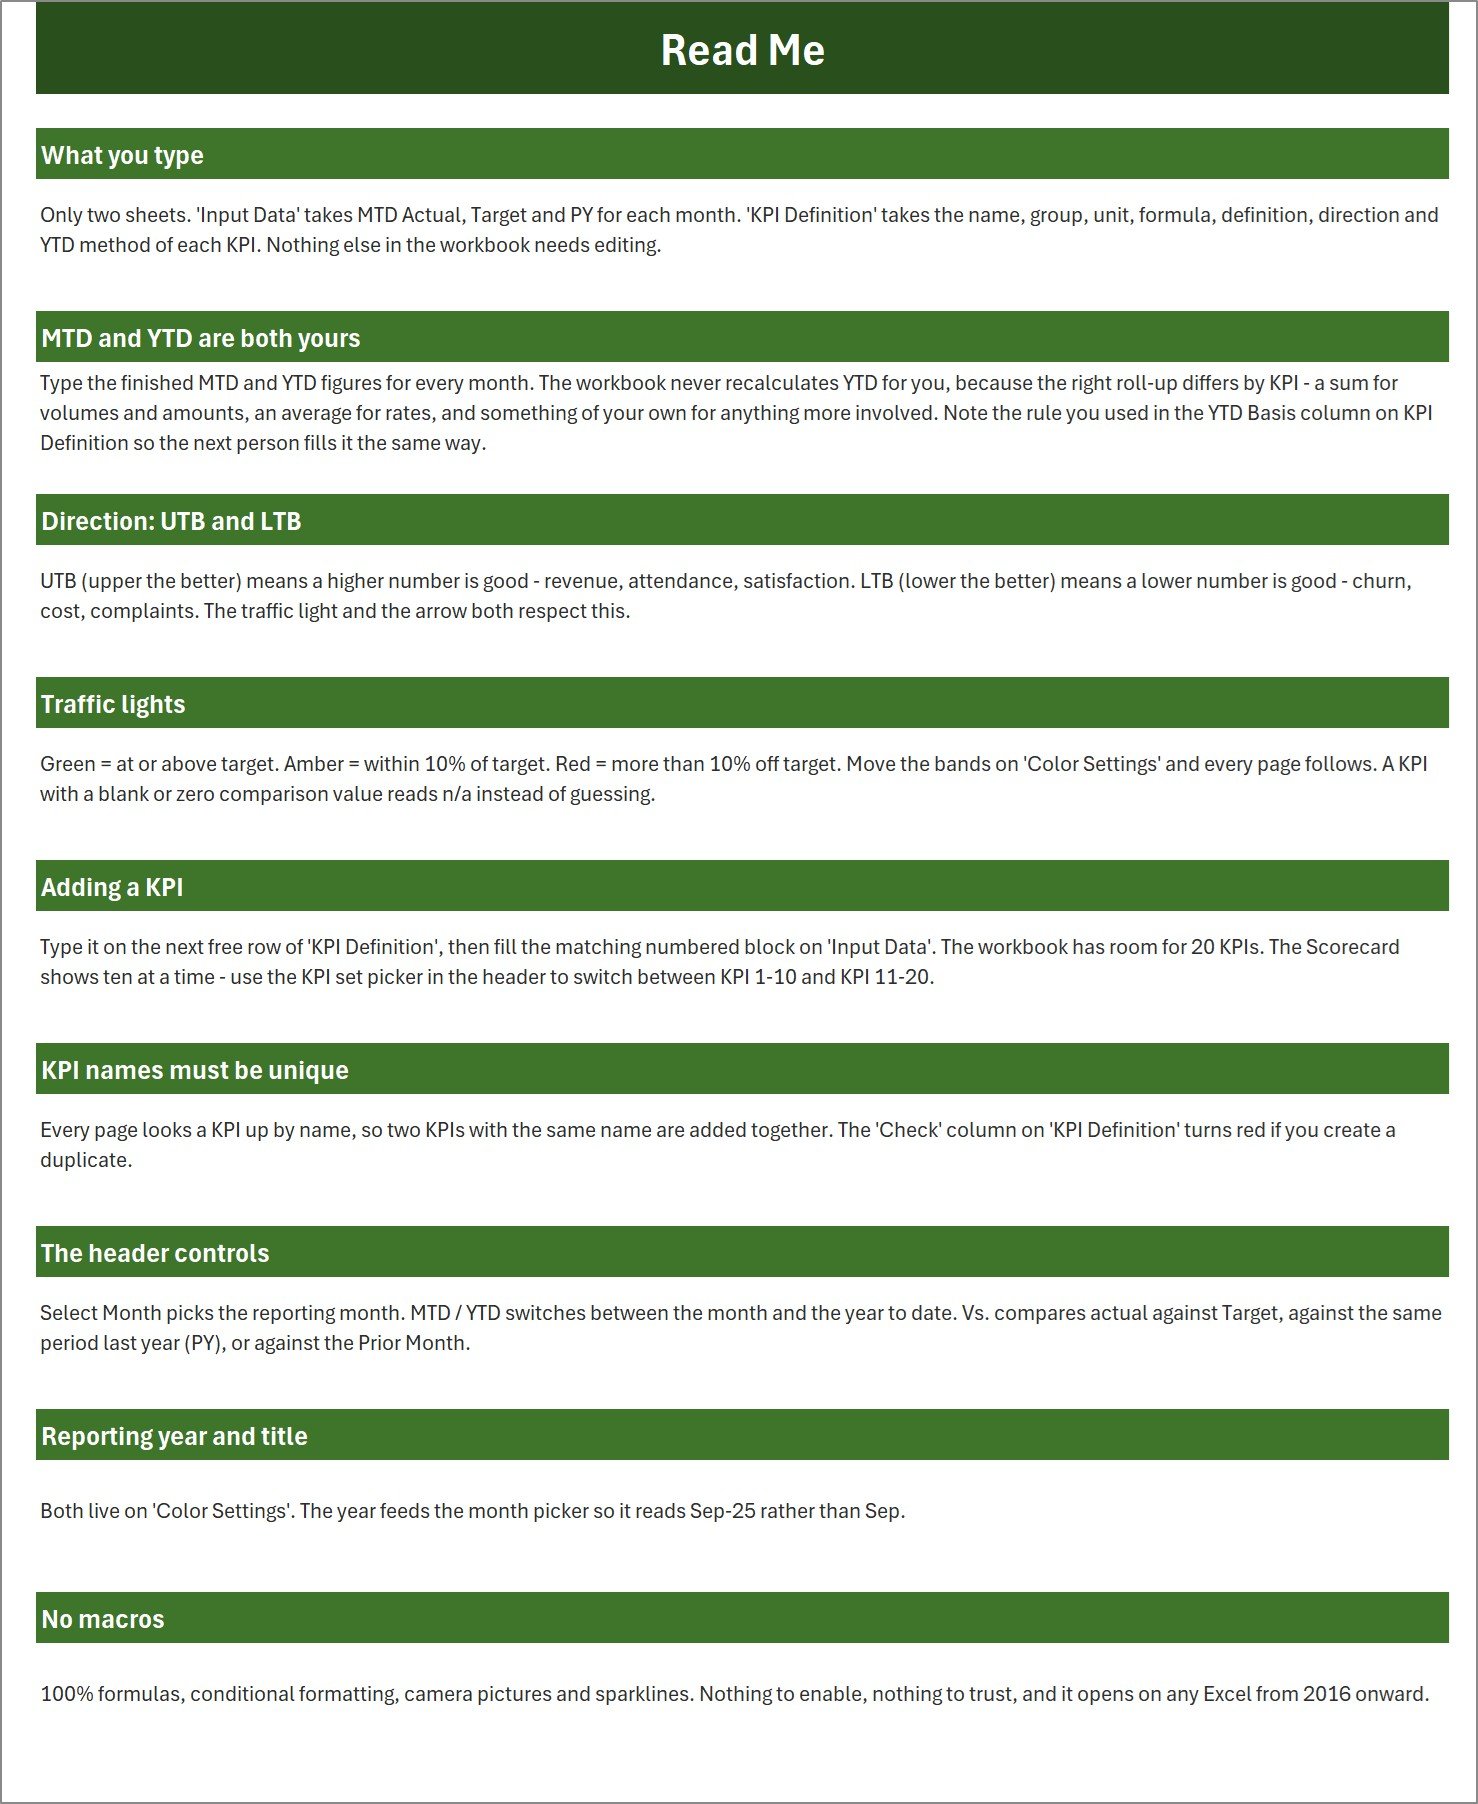
- Two input sheets, nothing else to edit. Type your numbers on Input Data, name your KPIs on KPI Definition, and every other sheet follows.
- No macros to enable. Formulas, conditional formatting, camera pictures and sparklines only – the file just opens.
What’s Inside the HVAC Contractor KPI Scorecard
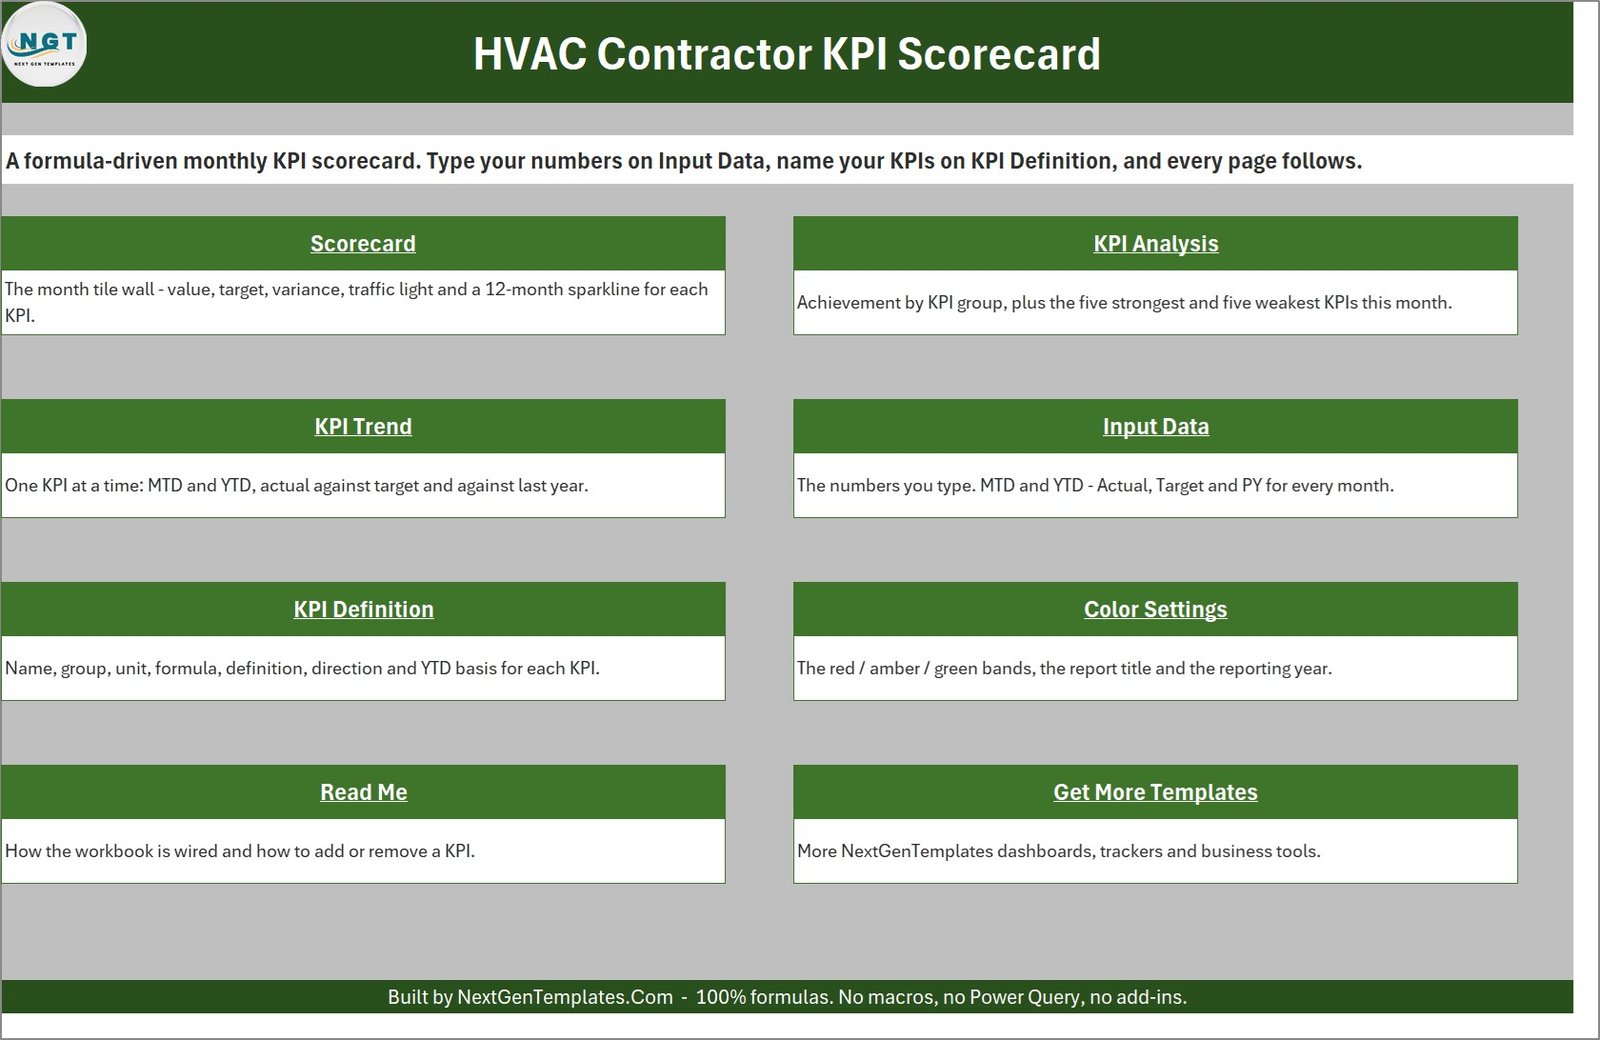
Nine worksheets, all reachable from the Home page:
- Home – a navigation page with a one-line description of each sheet.
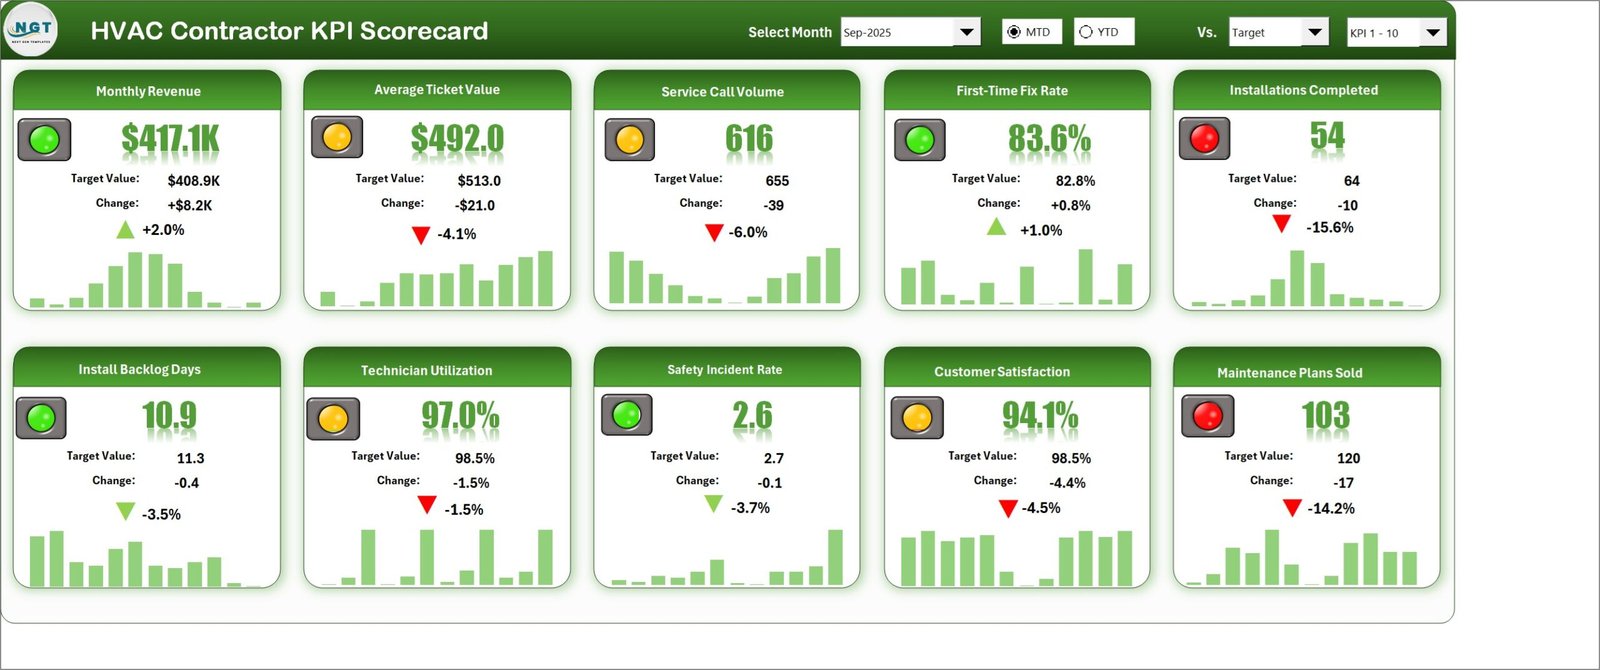
- Scorecard – the tile wall. Ten tiles, each with value, target, change, percentage variance, traffic light and sparkline. In the sample month (Sep-2025) Monthly Revenue reads $417.1K against a $408.9K target (+2.0%, green), while Installations Completed reads 54 against 64 (-15.6%, red).
- KPI Analysis – the roll-up: a Green / Amber / Red / total counter (4 / 4 / 2 / 10 in the sample), an Achievement by KPI Group table and column chart, and automatic Top 5 and Bottom 5 KPI tables.
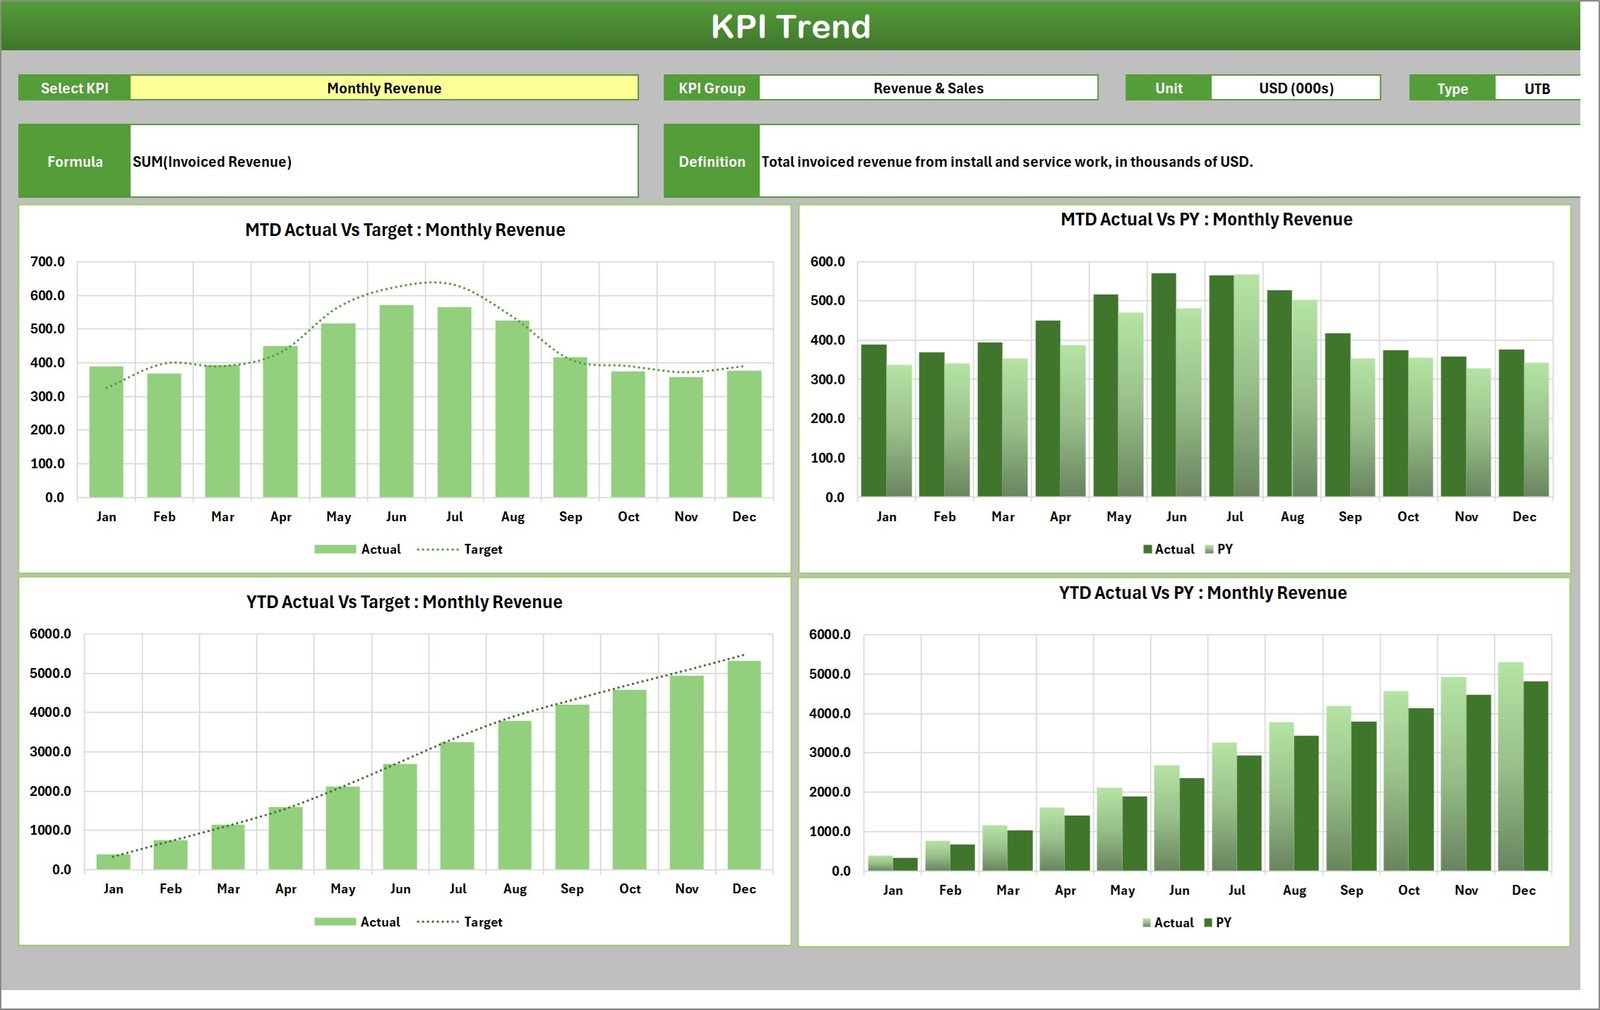
- KPI Trend – one KPI at a time, with its group, unit, direction, formula and written definition, plus four charts: MTD Actual vs Target, MTD Actual vs PY, YTD Actual vs Target and YTD Actual vs PY.
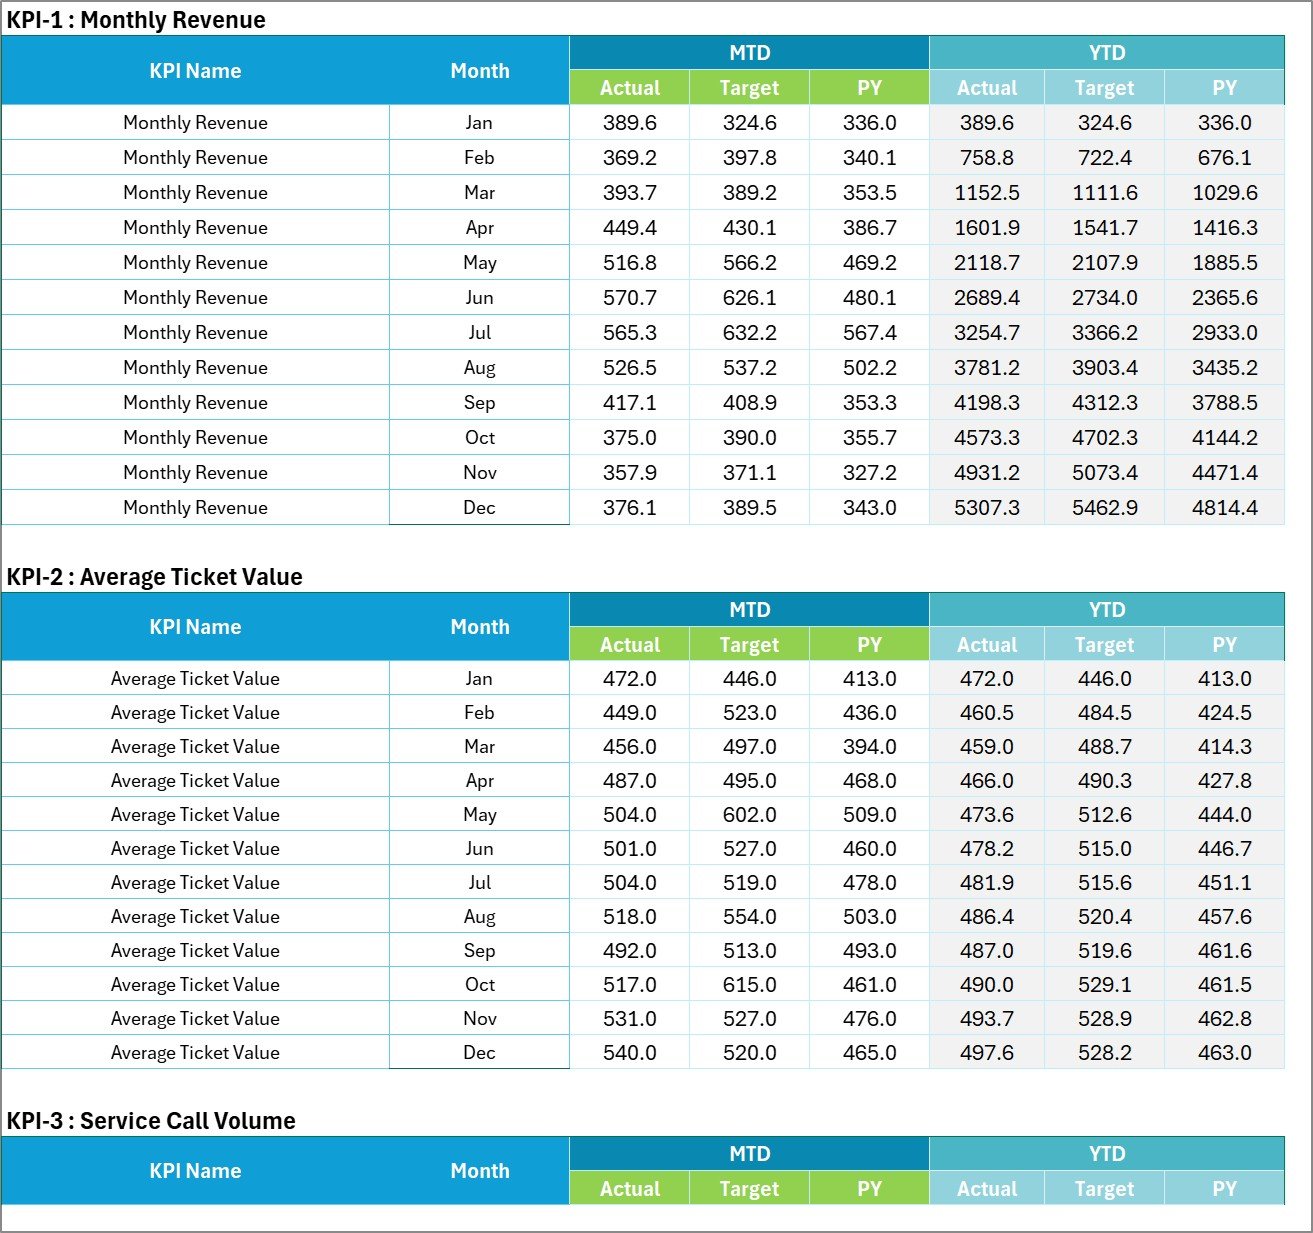
- Input Data – a numbered block per KPI holding twelve months of MTD Actual / Target / PY and YTD Actual / Target / PY.
- KPI Definition – name, group, unit, formula, definition, direction (UTB/LTB), YTD basis and a duplicate-name Check column for each KPI.
- Color Settings – the two RAG band tables, the report title and the reporting year.
- Read Me – how the workbook is wired and how to add or remove a KPI.
- Get More Templates – links to other NextGenTemplates products.
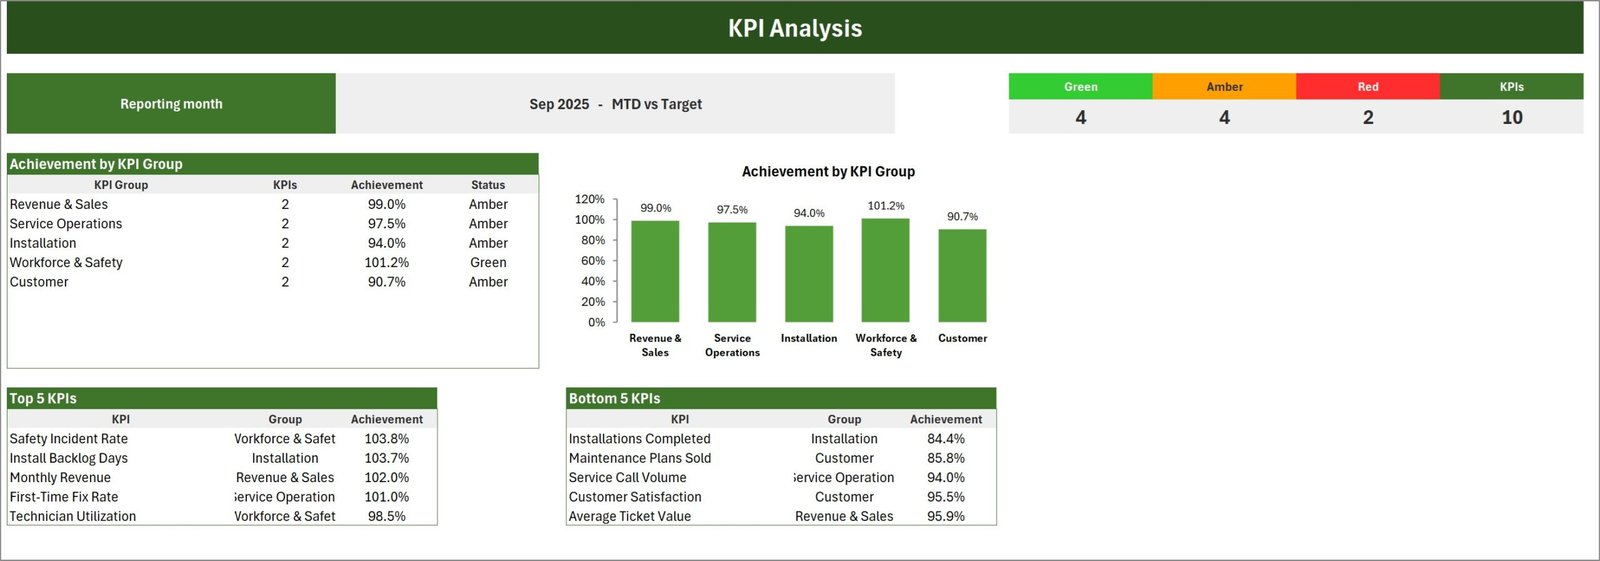
The ten KPIs shipped in the sample are Monthly Revenue and Average Ticket Value (Revenue & Sales); Service Call Volume and First-Time Fix Rate (Service Operations); Installations Completed and Install Backlog Days (Installation); Technician Utilization and Safety Incident Rate (Workforce & Safety); and Customer Satisfaction and Maintenance Plans Sold (Customer). Rename any of them, or replace the set entirely.
HVAC Contractor KPI Scorecard in Excel vs. Google Sheets vs. Paid Field Service Software – Where This Fits
| This scorecard (Excel) | Google Sheets scorecard | Paid field service platform | |
|---|---|---|---|
| Cost | One-time, under $20 | One-time, under $20 | Typically a few hundred dollars a month |
| Platform | Excel for Windows desktop | Browser, any device | Vendor cloud platform |
| Setup time | Type twelve months of numbers – under an hour | About the same | Weeks of implementation and data migration |
| Real-time team collaboration | No – it is a file | Yes | Yes |
| Mobile access | Not designed for it | Yes | Yes |
| Customisable KPI names and formulas | Yes – all 20 rows are yours | Yes | Limited to the vendor’s metric set |
| Share with a link | No – email or share the file | Yes | Yes |
| Year-1 cost at 5 users | Under $20 total | Under $20 total | Thousands of dollars |
| Pulls jobs and invoices automatically | No – you type the monthly figures | No | Yes, it is the system of record |
| Works alongside the FSM tool you already run | Yes – it sits on top of whatever you export | Yes | Only its own data |
Who This Template Is For – and Who It’s Not For
It fits an owner-operator or general manager of a residential or light-commercial HVAC company who already closes a month and wants one page to take into the Monday meeting; an operations manager who reports install backlog and first-time fix to a franchise or an outside investor; and a bookkeeper or office manager who assembles the monthly numbers by hand and wants them to look finished.
It does not fit you if you want live job dispatch, technician scheduling or invoicing – this reports, it does not run the business. It is also the wrong choice if you need daily or per-technician drill-down from a raw job table; the analytical HVAC Service Dashboard in Excel is built for that instead. And if your team lives in a browser, take the Google Sheets edition rather than this one.
How to Use the HVAC Contractor KPI Scorecard
- Open the workbook in Excel for Windows desktop. Nothing to enable – there are no macros.
- On Color Settings, set the report title and the reporting year, and adjust the red / amber / green bands if 10% is not your tolerance.
- On KPI Definition, name your KPIs and set each one’s group, unit, formula text, direction (UTB or LTB) and YTD basis. Names must be unique – the Check column flags duplicates.
- On Input Data, type twelve months of MTD and YTD figures – Actual, Target and Prior Year – into the numbered block for each KPI. The workbook does not roll YTD up for you, because the correct roll-up differs by KPI: a sum for revenue and call volume, an average for rates like first-time fix.
- Go to the Scorecard, pick your month, choose MTD or YTD and pick a comparison basis. Everything else follows.
- Read KPI Analysis for the group roll-up and the top and bottom five, then use KPI Trend to look at any single KPI across the year.
Real-World Use Cases
Dave, owner of a 14-technician residential HVAC company. He closes the month in his accounting software, types the figures into Input Data, and walks into the Monday meeting with one printed page. Two red lights – Installations Completed and Maintenance Plans Sold – set the agenda without an argument about whose numbers are right.
Priya, operations manager at a light-commercial mechanical contractor. Her franchisor wants first-time fix rate and install backlog days every month. She keeps a separate copy per branch, changes the report title on Color Settings, and sends three identical-looking scorecards instead of three different spreadsheets.
Marcus, a fractional CFO with four trade clients. He renames the ten KPIs once per client, keeps the RAG bands tight at 5%, and uses the Bottom 5 KPIs table as the first slide of every review.
Frequently Asked Questions
Is this the same thing as an HVAC KPI dashboard?
No. A dashboard in our catalogue is analytical: it sits on a table of jobs or invoices and lets you slice it by month, branch, technician or job type with slicers and charts. This scorecard is a month-picker report card: you type the finished monthly figures and it grades them against target with traffic lights, a group roll-up and a trend page. Our separately listed HVAC Contractor KPI Dashboard is that analytical build, not this one – a different template with a different file, answering a different question.
Do I need Excel for Windows?
Yes. It is built and tested in Excel for Windows desktop, Excel 2016 or later including Microsoft 365. It uses camera pictures and sparklines, so it is not designed for Excel for the web, the mobile apps, or Excel for Mac.
Does it connect to my field service or accounting software?
No. There is no connector and no import routine. You type the monthly figures onto Input Data, from whatever system you already close in.
Will it email or alert me when a KPI turns red?
No. There are no macros, no notifications and no scheduling. The traffic light changes colour on screen when you open the file.
Can I change the KPIs to my own?
Yes – that is the intended use. Rename all ten on KPI Definition, or add more up to a total of 20. The Scorecard shows ten at a time and the header picker switches between KPI 1-10 and KPI 11-20.
Are the numbers in the screenshots real HVAC benchmarks?
No. Every figure is sample data used to demonstrate the layout. The targets are placeholders – set your own from your own history.
What exactly do I download?
A ZIP containing the .xlsx workbook and a PDF user manual. Instant download after checkout, unlimited re-downloads.
About the Author
Built by PK – Microsoft Certified Professional with 15+ years of Excel, Google Sheets, and Power BI experience. Founder of NextGenTemplates, reaching 300K+ subscribers across YouTube channels. Every template is hand-built and tested before release.
Explore Related Templates
Prefer Google Sheets? The same scorecard is available for it – see the HVAC Contractor KPI Scorecard in Google Sheets, the same month-picker build in the browser.
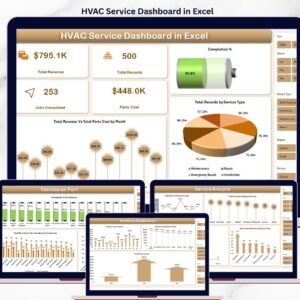
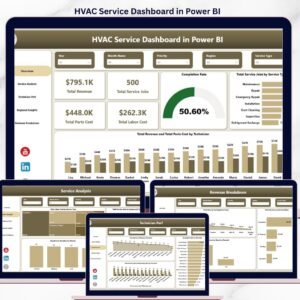
Same scorecard, different trade: the Plumbing Business KPI Scorecard in Excel and the Electrical Contractor KPI Scorecard in Excel. For slicer-driven analysis of a raw job table, see the HVAC Service Dashboard in Excel or the HVAC Service Dashboard in Power BI. To capture work orders in the first place, the Maintenance Work Order Data Entry System in Excel is the front end.
Browse the full KPI Dashboard category and everything in MS Excel.
Download the HVAC Contractor KPI Scorecard in Excel now – one payment, instant download, no subscription, and the file is yours to edit forever.
Last updated: 23 August 2026.






























Reviews
There are no reviews yet.