

The Senior Living KPI Scorecard in Excel tracks 15+ KPIs across 4 interactive worksheets, covering occupancy rates, resident care quality, staffing ratios, and financial metrics. Setup takes under 10 minutes — replace the sample data with your facility’s numbers and every scorecard page updates automatically.
🌍 Join 8,400+ teams in 40+ countries using NextGenTemplates to replace paid SaaS tools with one-time-purchase Excel, Google Sheets, Power BI, and HTML templates.
✅ Instant download · One-time payment · No subscription · No per-user fees · Lifetime access
🔑 Key Features of Senior Living KPI Scorecard in Excel
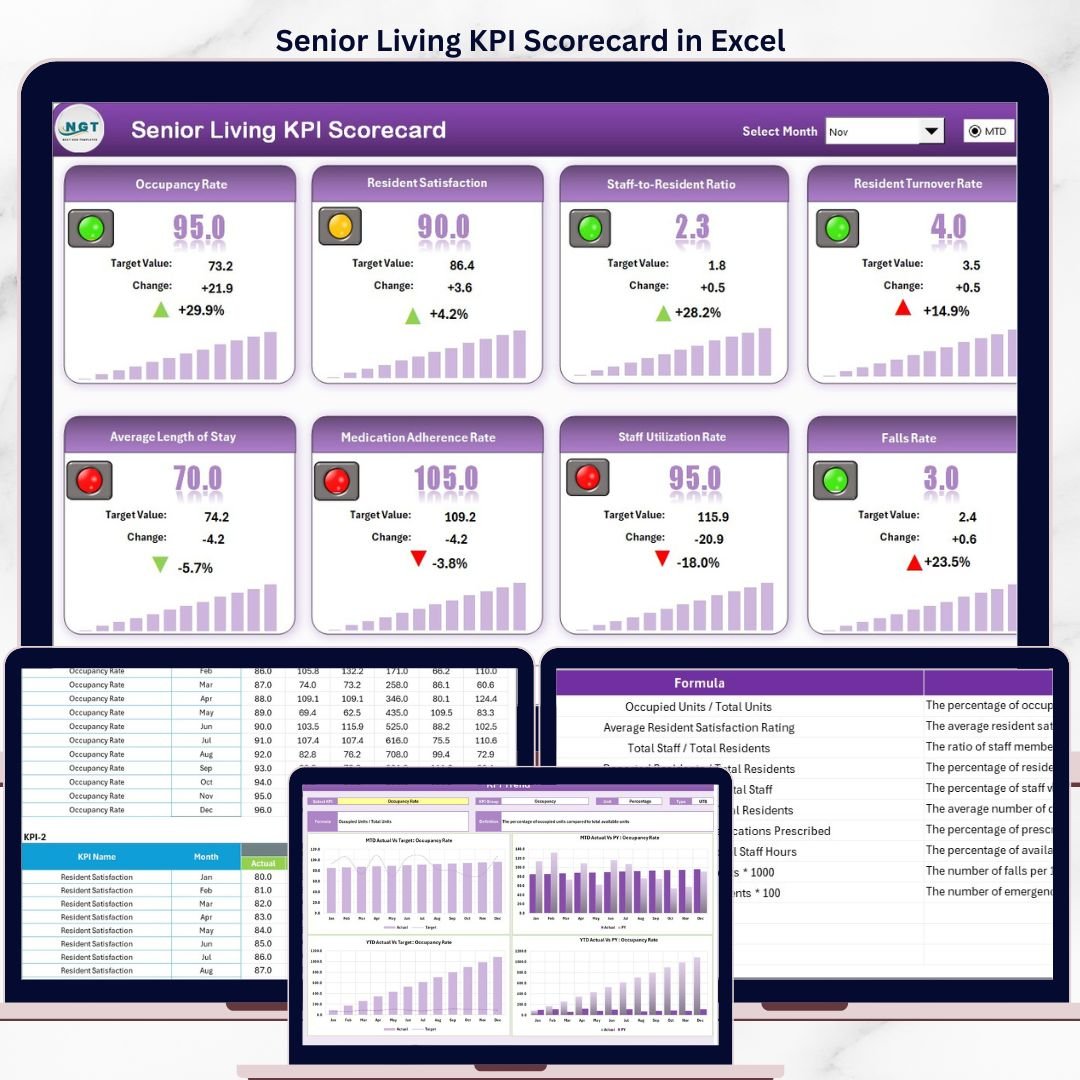
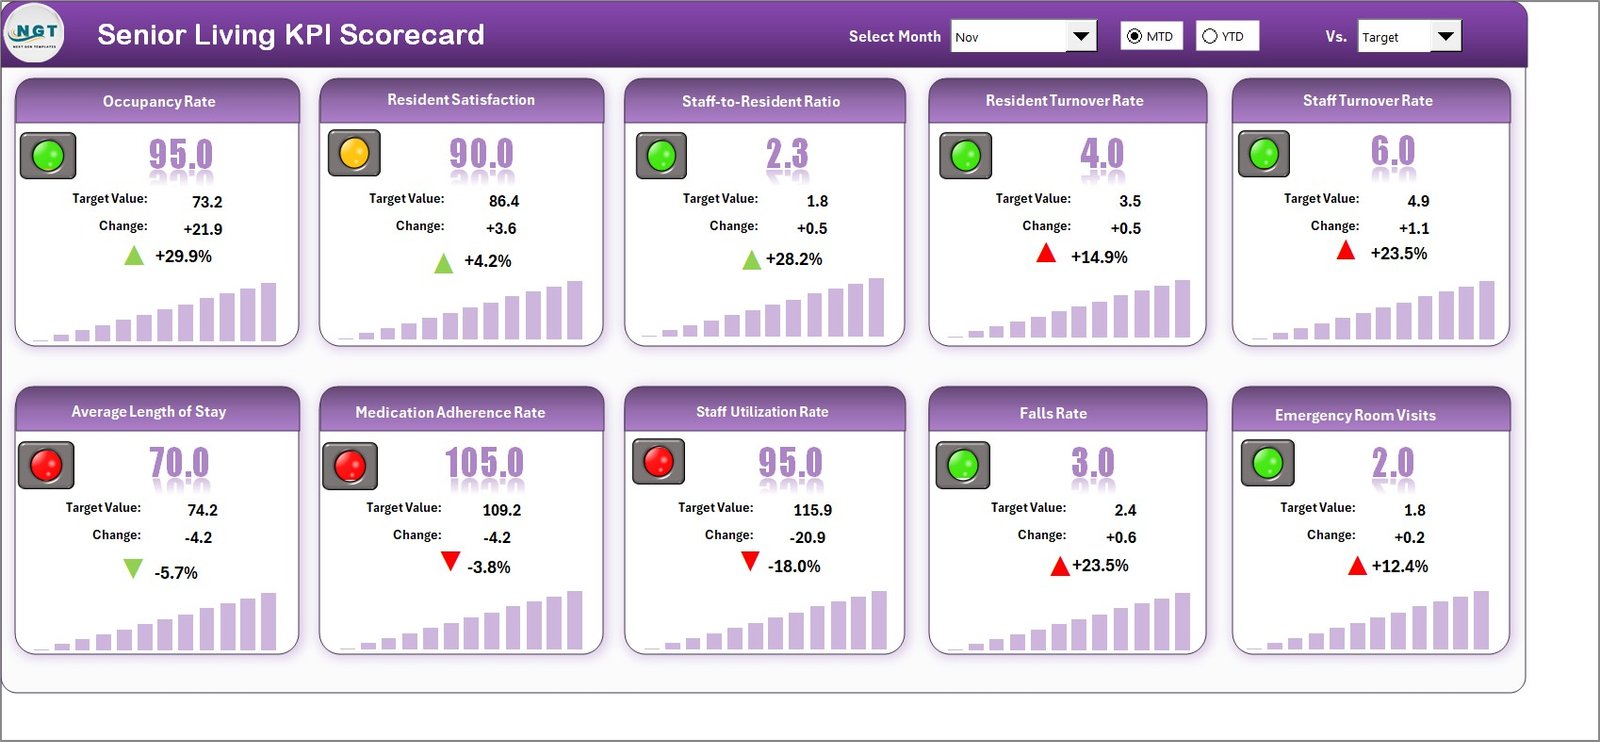
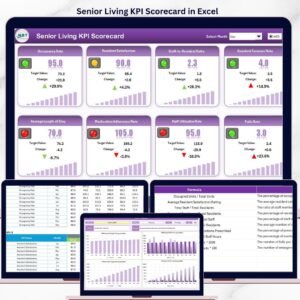
📊 Scorecard Dashboard – The main interface displays all KPIs with Actual vs Target comparisons, MTD and YTD breakdowns, and color-coded visual indicators that highlight underperforming areas at a glance.
📈 KPI Trend Analysis – Select any KPI from the dropdown on cell C3 to view its trend chart showing Actual, Target, and Prior Year numbers across 12 months. The sheet also displays KPI Group, Unit, Type (Lower the Better or Upper the Better), Formula, and Definition.
🗓️ Month & Period Selection – Dropdown menus let you switch between months and toggle MTD or YTD views without editing formulas. This scorecard tracks metrics including occupancy rate, average length of stay, resident satisfaction score, fall rate per 1,000 resident days, and staff-to-resident ratio.
⚙️ Flexible Input System – Enter actual values, targets, and prior year benchmarks in the Input Data sheet. Update numbers monthly and the scorecard recalculates everything automatically.
📝 KPI Definition Library – Document each KPI’s name, group, unit, formula, and plain-language definition in one organized reference tab. This helps new staff understand what each metric measures and why it matters.
Senior Living KPI Scorecard in Excel
📦 What’s Inside the Senior Living KPI Scorecard
This Excel file contains 4 worksheets designed specifically for senior living and assisted living facility management:
🔹 Scorecard Sheet – The main dashboard with dropdown menus for month and MTD/YTD selection, Actual vs Target values, color-coded status indicators using conditional formatting, and a full KPI overview including prior year comparisons.
🔹 KPI Trend Sheet – Dropdown on C3 lets you select any KPI. Displays the KPI Group, Unit, Type, Formula, and Definition alongside MTD and YTD trend charts for Actual, Target, and PY numbers.
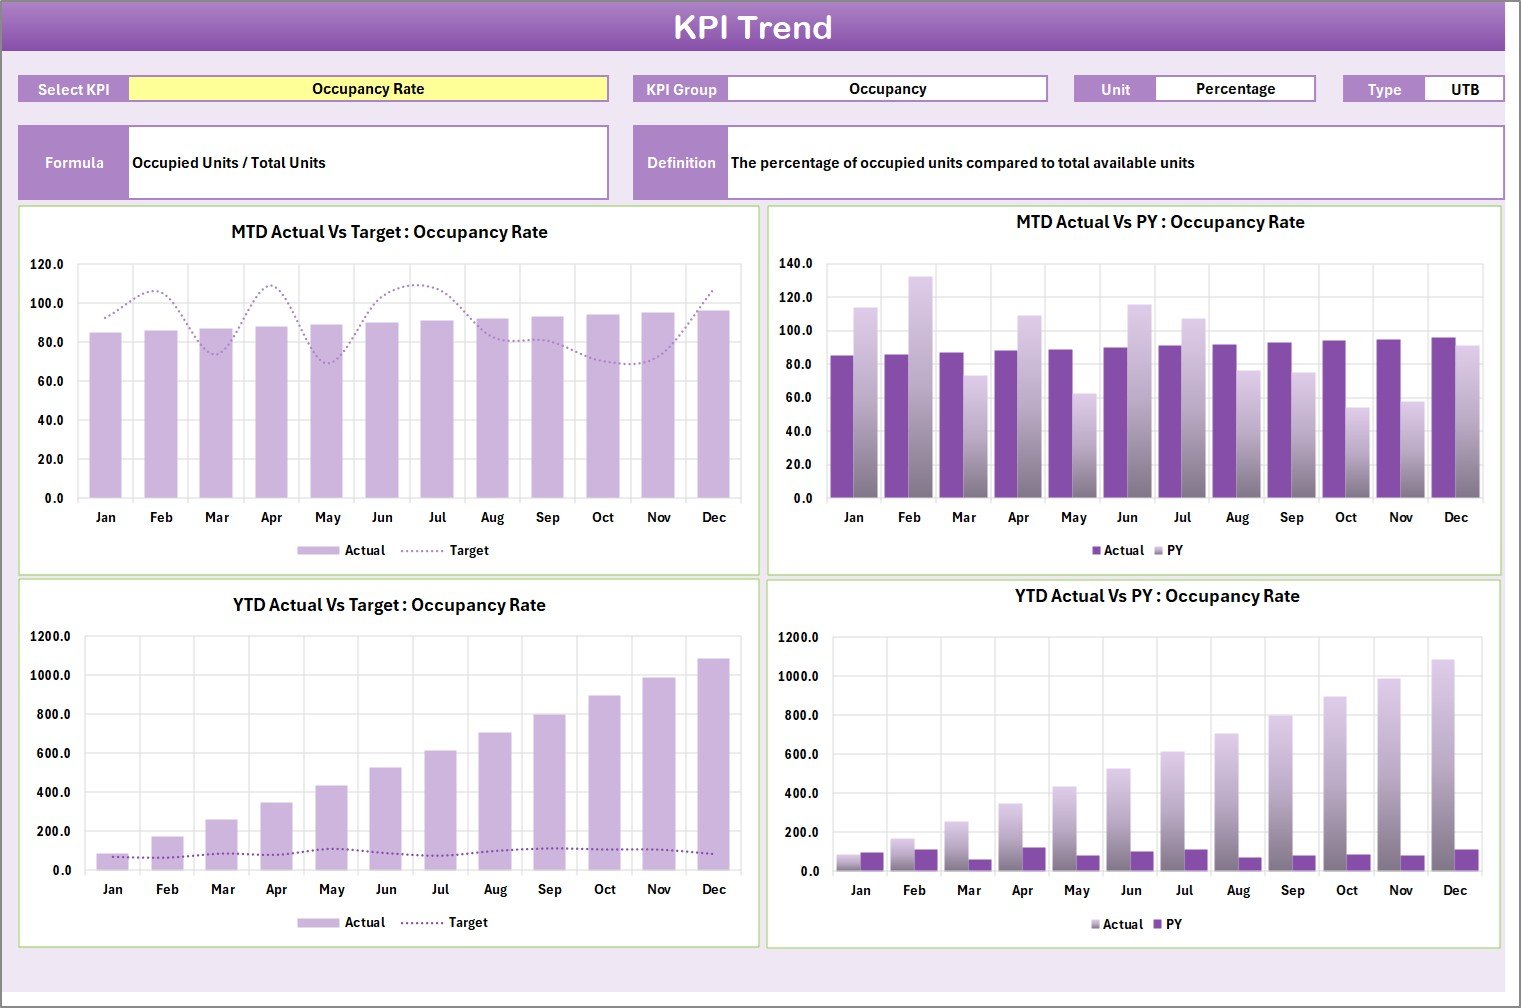
KPI Trend Sheet
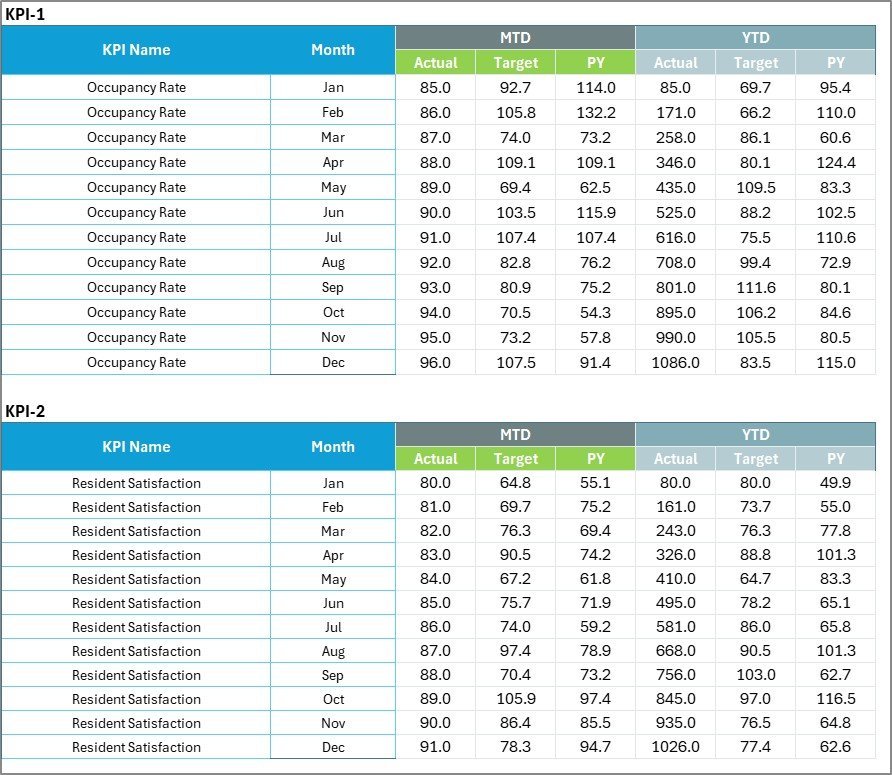
🔹 Input Data Sheet – Central data entry area where you record actual values, targets, and metrics for each KPI. Update monthly to keep the scorecard current.
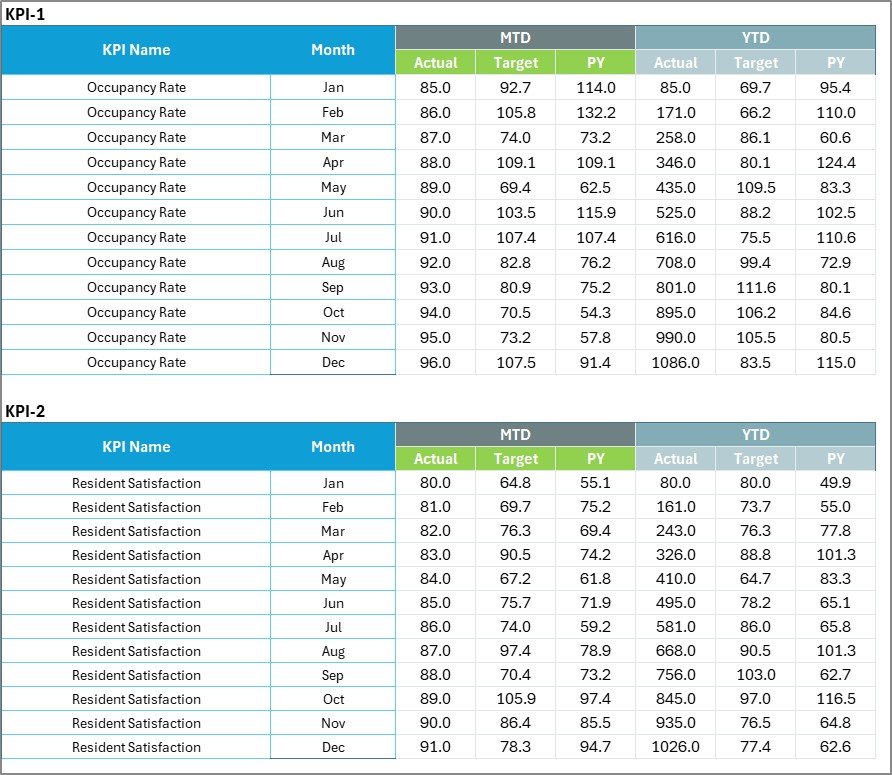
Input Data Sheet
🔹 KPI Definition Sheet – Enter KPI Name, KPI Group, Unit, Formula, and Definition for each metric. Serves as a living reference document for your team.
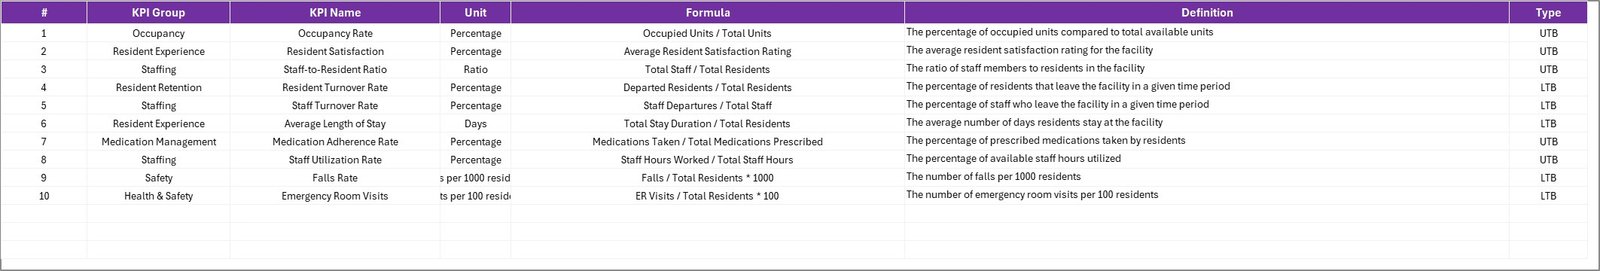
KPI Definition Sheet
📊 Senior Living KPI Scorecard in Excel vs. Google Sheets vs. Paid Senior Living Software — Where This Fits
| Feature | Senior Living KPI Scorecard in Excel | Google Sheets Equivalent | PointClickCare / MatrixCare |
|---|---|---|---|
| Cost | $12.99 one-time | Free (build from scratch) | $8–$25 / resident / month |
| Platform | Microsoft Excel 2016+ | Google Sheets (browser) | Cloud-based SaaS |
| Setup Time | ✅ Under 10 minutes | 4–8 hours (manual build) | 2–6 weeks onboarding |
| Real-Time Collaboration | Via OneDrive / SharePoint | ✅ Built-in | ✅ Built-in |
| Mobile Access | Excel Mobile App | ✅ Browser-based | ✅ Dedicated app |
| Customizable KPIs | ✅ Fully editable | ✅ Fully editable | Limited to plan tier |
| MTD/YTD Trend Analysis | ✅ Built-in with charts | Manual setup required | ✅ Built-in |
| Year-1 Cost (50-bed facility) | $12.99 total | $0 + your time | $4,800–$15,000+ |
| EHR/EMR Integration | Manual data entry | Manual data entry | ✅ Native integration |
For senior living operators who want KPI visibility without paying per-resident SaaS fees, the Senior Living KPI Scorecard in Excel sits in the sweet spot.
👥 Who This Template Is For — and Who It’s Not For
✅ This template is built for:
- Senior living facility administrators tracking occupancy, care quality, and financial KPIs for 20–300 bed communities
- Assisted living directors who need monthly performance reports for board meetings and regulatory compliance
- Operations managers at independent living, memory care, or continuing care retirement communities (CCRCs)
- Healthcare consultants building performance scorecards for multiple senior care clients
❌ This template is NOT for:
- Large enterprise chains (500+ facilities) needing automated EHR/EMR data feeds and HIPAA-compliant cloud hosting
- Facilities requiring real-time nurse call or medication tracking — those need specialized clinical software
⚙️ How to Use the Senior Living KPI Scorecard in Excel
Step 1: Download the Excel file and open it in Microsoft Excel 2016 or later.
Step 2: Go to the KPI Definition sheet and enter your facility’s KPI names, groups, units, formulas, and definitions.
Step 3: Navigate to the Input Data sheet and enter your monthly actual values, targets, and prior year data for each KPI.
Step 4: Switch to the Scorecard sheet and use the dropdown menus to select the month and MTD or YTD view.
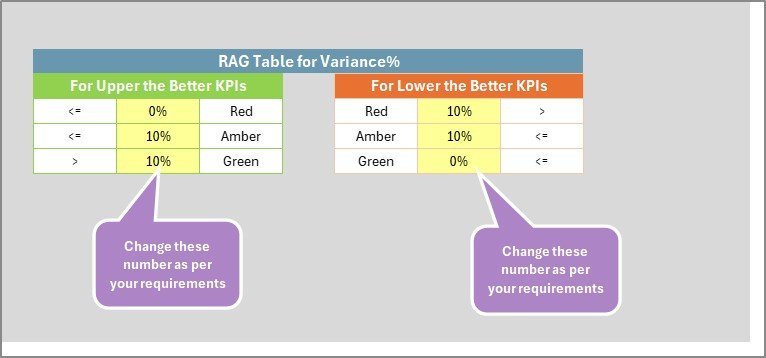
Step 5: Review color-coded indicators to identify KPIs that are on track (green), at risk (amber), or below target (red).
Step 6: Open the KPI Trend sheet, select a KPI from the dropdown on C3, and analyze the 12-month trend chart.
💼 Real-World Use Cases
Maria manages a 120-bed assisted living facility in Texas. She uses the Senior Living KPI Scorecard in Excel to track monthly occupancy rates, average length of stay, and resident satisfaction scores. Every quarter, she presents the MTD/YTD trend charts to her board — replacing a $900/month PointClickCare analytics module with a $12.99 one-time download.
David runs operations across 3 independent living communities in Ohio. He customized the KPI Definition sheet to include fall rates, medication error rates, and staff turnover by location. The color-coded scorecard lets him compare all three sites side by side during weekly leadership meetings.
Priya is a healthcare consultant in California. She uses this template as a starting framework for each new senior living client engagement. She adjusts the KPIs based on the client’s license type (assisted living, memory care, or CCRC) and delivers a branded performance report within the first week. Explore more KPI Dashboard Templates for other industries.
❓ Frequently Asked Questions
What KPIs does the Senior Living KPI Scorecard track?
The Senior Living KPI Scorecard in Excel tracks 15+ key performance indicators including occupancy rate, average length of stay, resident satisfaction, fall rate, staff-to-resident ratio, revenue per occupied bed, and operating margin. All metrics update automatically when you enter your data.
Does this scorecard work with Excel on Mac?
Yes. The Senior Living KPI Scorecard in Excel uses standard formulas, conditional formatting, and charts — no macros or VBA. It works on Excel 2016+ for both Windows and Mac, as well as Excel for Microsoft 365.
How long does it take to set up the scorecard?
Initial setup takes under 10 minutes. Enter your KPI definitions, then add your monthly actual and target values in the Input Data sheet. The Scorecard and KPI Trend sheets auto-populate with your numbers.
Can I add custom KPIs specific to my facility?
Absolutely. The KPI Definition sheet lets you add, rename, or remove any KPI. Adjust the Input Data sheet to match, and the scorecard formulas adapt to your custom configuration without any coding.
How does this compare to PointClickCare or MatrixCare?
PointClickCare and MatrixCare charge $8–$25 per resident per month and require weeks of onboarding. The Senior Living KPI Scorecard in Excel costs $12.99 one-time with immediate download. It won’t replace clinical EHR features, but for KPI tracking and board reporting, it delivers the same insights at a fraction of the cost.
Can I share this scorecard with my team?
Yes. Save the file to OneDrive or SharePoint for real-time collaboration. Multiple team members can view and update the scorecard simultaneously using Excel’s co-authoring features.
Is a Google Sheets or Power BI version available?
Check the Google Sheets Dashboard and Power BI Dashboard categories for similar healthcare templates across platforms.
👤 About the Author
Built by PK — Microsoft Certified Professional with 15+ years of Excel, Google Sheets, and Power BI experience. Founder of NextGenTemplates, reaching 300K+ subscribers across YouTube channels (@PK-AnExcelExpert, @NextGenTemplates, @NeoTechNavigators). Every template is hand-built and tested before release.
🔗 Explore Related Templates
🔹 Home Health Care KPI Scorecard in Excel – Track home-based care KPIs including visit completion, patient outcomes, and caregiver utilization.
🔹 Rehabilitation Center KPI Scorecard in Excel – Monitor rehab-specific metrics like therapy hours, discharge rates, and readmission tracking.
🔹 Substance Abuse Center KPI Scorecard in Excel – Measure treatment completion, relapse rates, and counselor caseload KPIs.
🔹 Telehealth Dashboard in Excel – Analyze virtual visit volume, no-show rates, and patient satisfaction for telehealth programs.
Browse the full KPI Dashboard Templates and Excel Dashboard Templates collections.
📖 Click here to read the Detailed Blog Post
🎥 Visit our YouTube channel for step-by-step video tutorials
👉 YouTube.com/@NextGenTemplates


Reviews
There are no reviews yet.