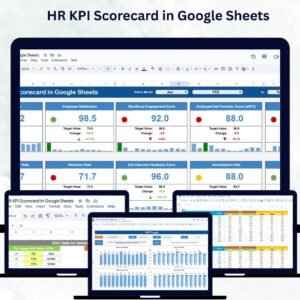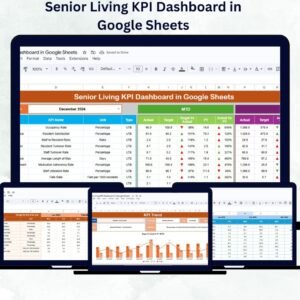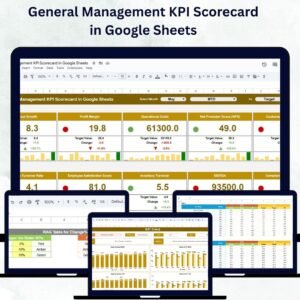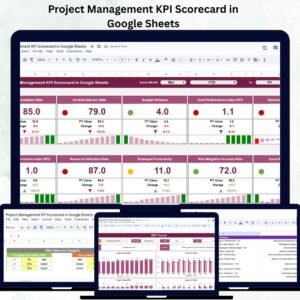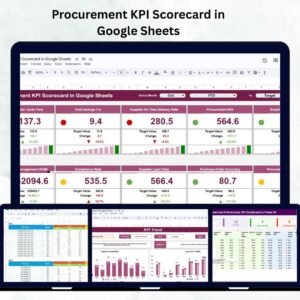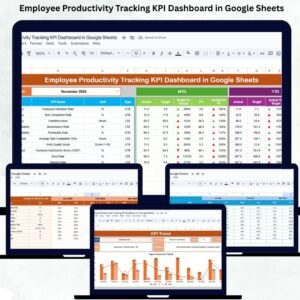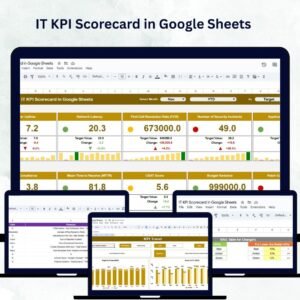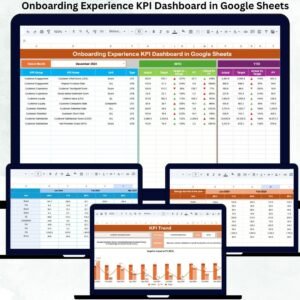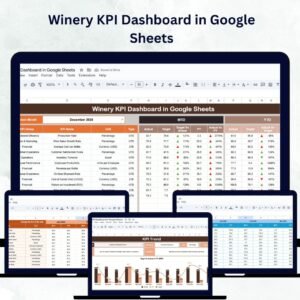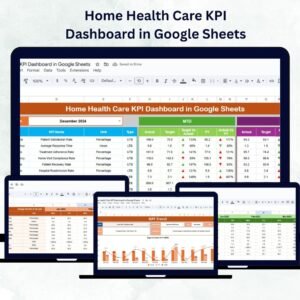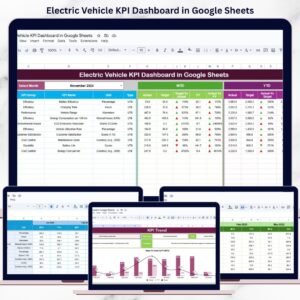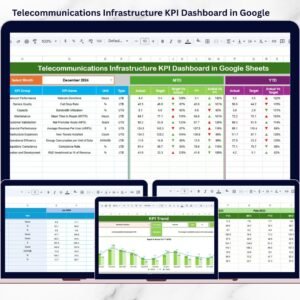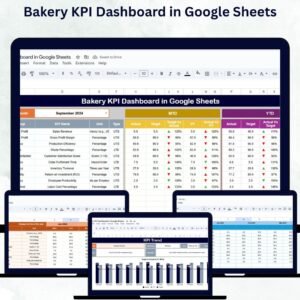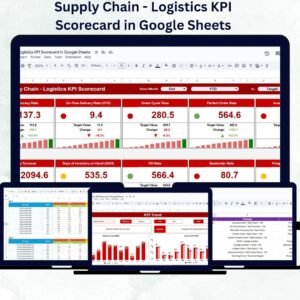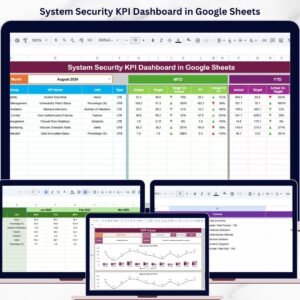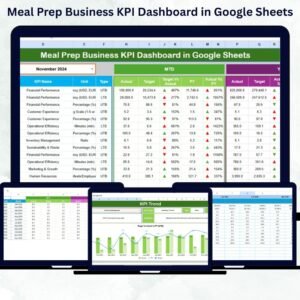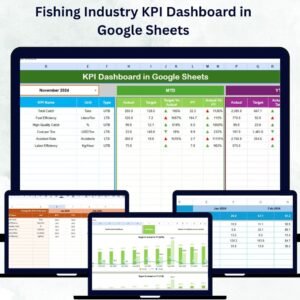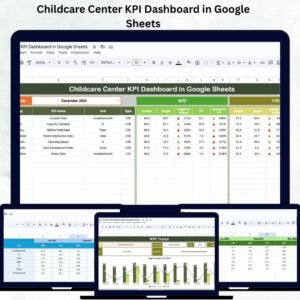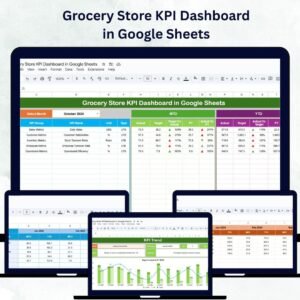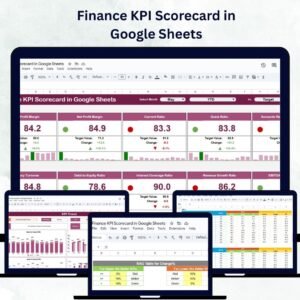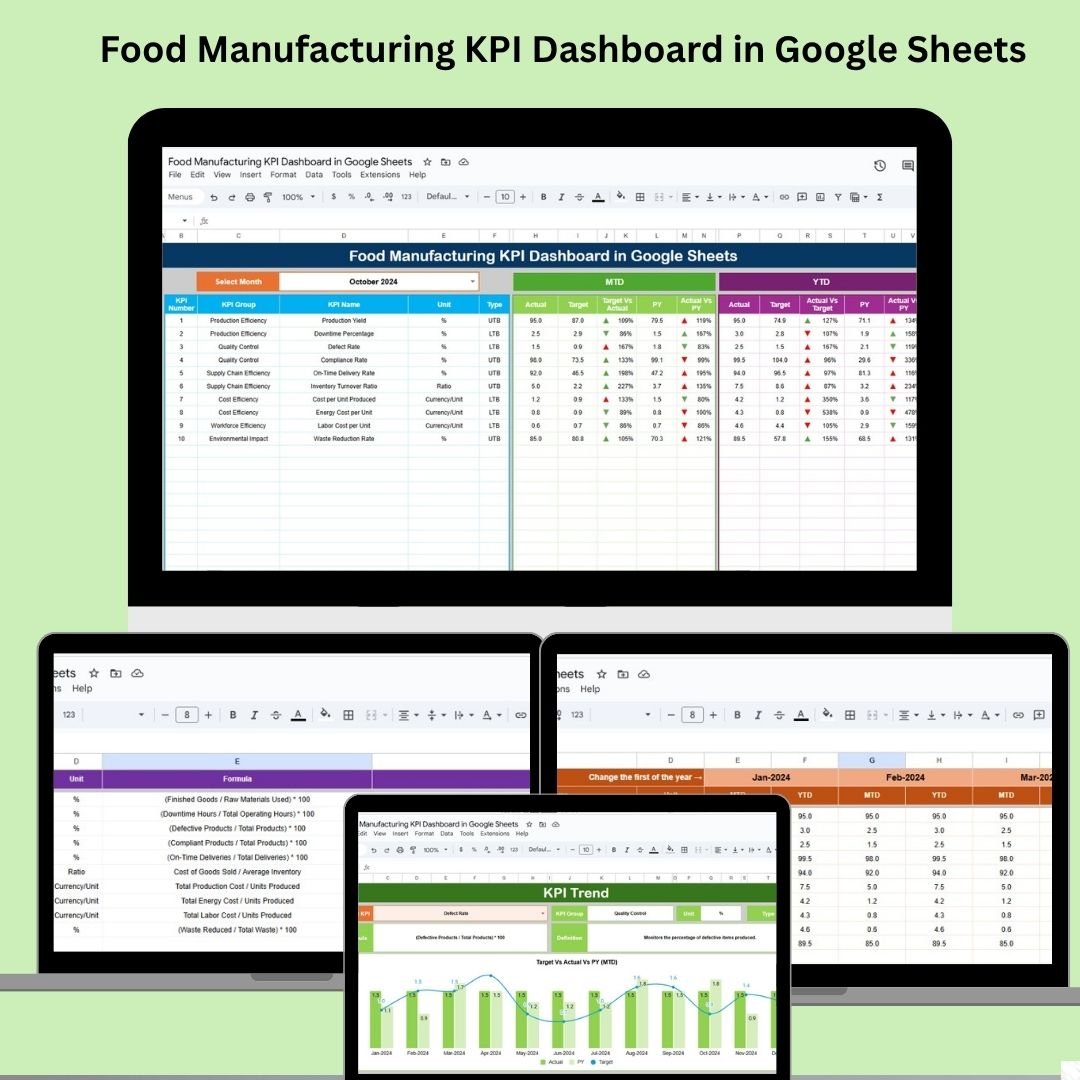
In today’s fast-paced food production environment, tracking and analyzing key performance indicators is vital for staying efficient, reducing waste, and hitting targets. That’s why we created the Food Manufacturing KPI Dashboard in Google Sheets — a powerful, ready-to-use solution designed to give you instant insight into your production line’s performance. 📊⚙️
Whether you’re managing production, quality, or inventory, this dashboard helps food manufacturers gain complete visibility across the entire operation. From real-time MTD and YTD tracking to detailed KPI trend analysis and performance comparisons, everything you need is built into one collaborative Google Sheet.
✨ Key Features of Food Manufacturing KPI Dashboard
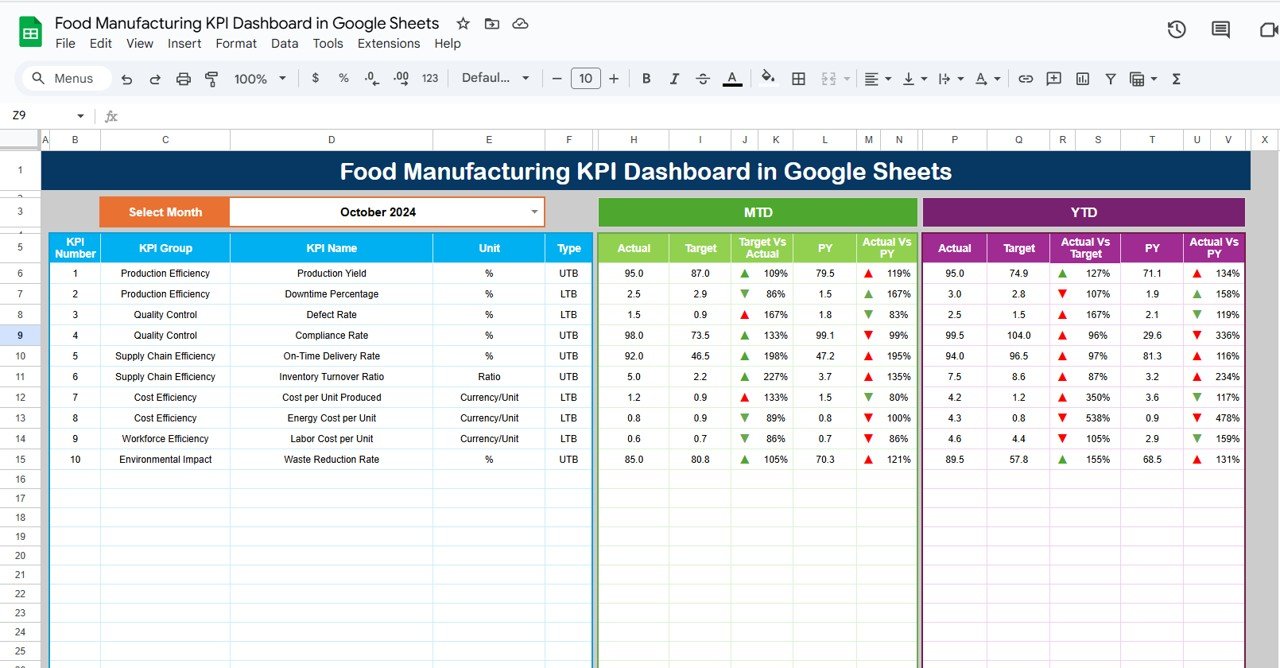
📊 Dashboard Sheet – Real-Time Visual Overview
Track MTD and YTD metrics
Visual performance indicators (green/red arrows)
Compare current performance to target and previous year
Monitor metrics like Production Volume, Quality Defects, Machine Downtime, and more
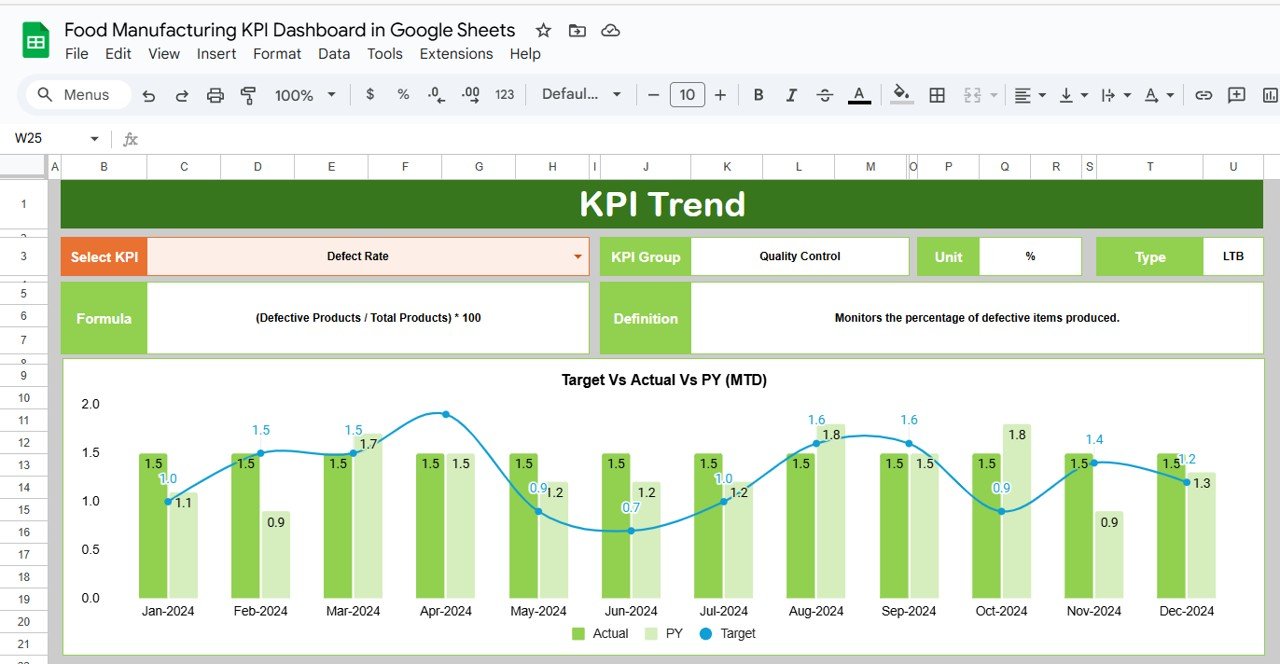
📈 KPI Trend Sheet – Spot Long-Term Trends
Select any KPI from a dropdown
View KPI group, unit, type, and calculation formula
Two trend charts (MTD and YTD) for comparison over time
Great for identifying improvements or problem areas
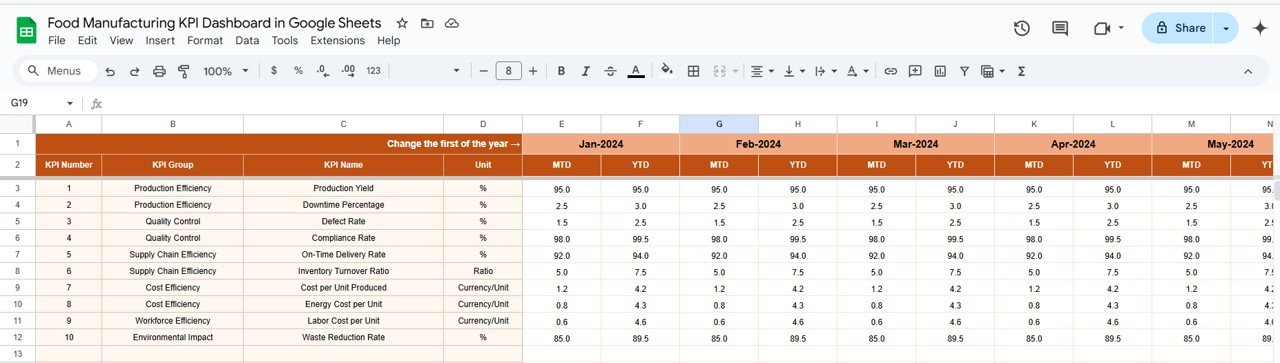
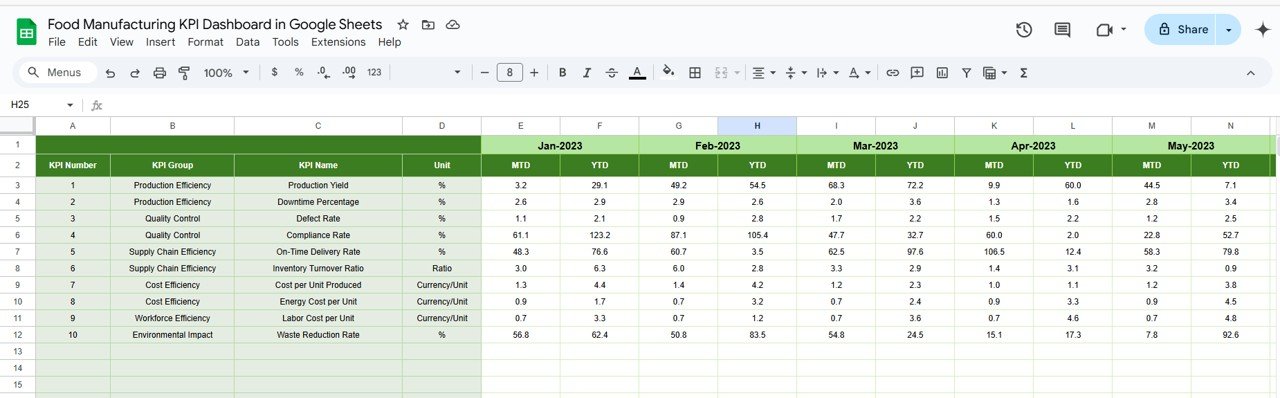
🧾 Actual Numbers Sheet – Monthly Data Entry
Enter real-time monthly values for both MTD and YTD
Use dropdown in cell E1 to select the month
Automatic updates to dashboard visuals
🎯 Target Sheet – Set Benchmarks
Input your monthly and annual KPI targets
Dashboards instantly calculate performance gaps
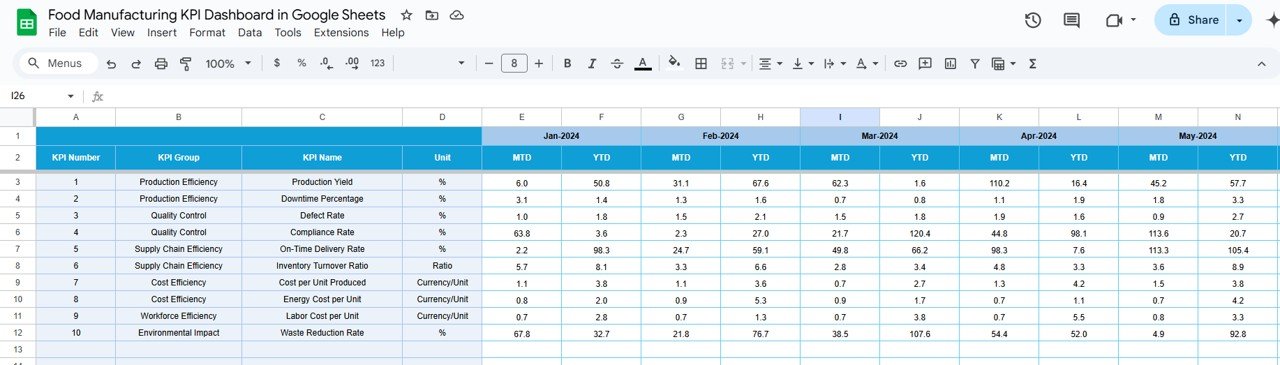
📅 Previous Year Numbers Sheet – Year-over-Year Analysis
Add historical data to track progress and improvements
Dashboards compare CY vs PY metrics side-by-side
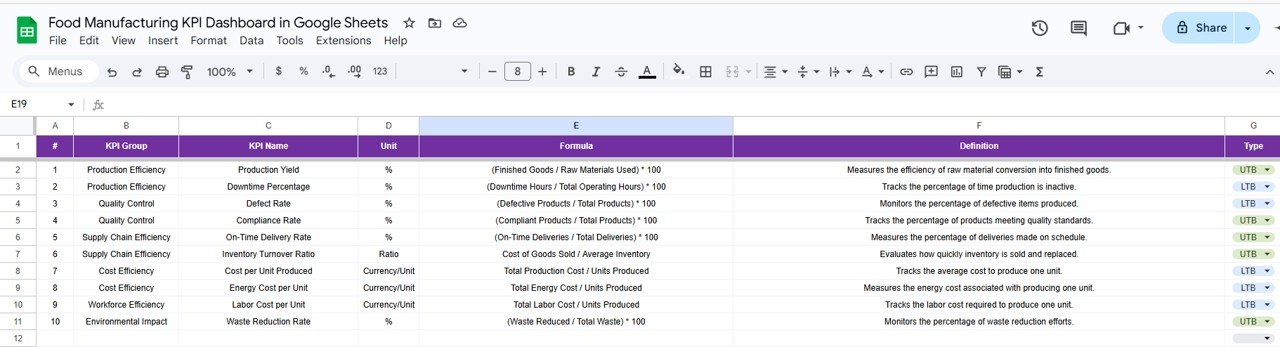
📘 KPI Definition Sheet – Aligned Understanding
Document each KPI’s name, group, unit, formula, and purpose
Keeps your whole team aligned and focused on the right metrics
📂 What’s Inside the Google Sheets Dashboard?
This template includes 6 fully connected worksheets, each with a specific function:
1️⃣ Dashboard Sheet – High-level monthly and YTD performance overview
2️⃣ KPI Trend Sheet – MTD/YTD chart analysis for each KPI
3️⃣ Actual Numbers Sheet – Monthly performance tracking
4️⃣ Target Sheet – Set performance goals for each metric
5️⃣ Previous Year Sheet – Store historical data for comparison
6️⃣ KPI Definition Sheet – Documentation for all tracked KPIs
Everything updates automatically once data is entered—no formulas or manual chart editing required.
👨🍳 Who Can Benefit from This Product?
✅ Production Managers – Track daily performance and downtime
✅ Quality Control Teams – Monitor defect rates, recalls, and inspections
✅ Inventory Planners – Measure stock turnover and loss percentages
✅ Operations Directors – Share progress with stakeholders using real-time data
✅ Plant Supervisors – Compare current vs previous year productivity
If you’re in food manufacturing and need reliable performance reporting—this tool is built for you.
🔗 Click here to read the Detailed blog post
Watch the step-by-step video Demo: