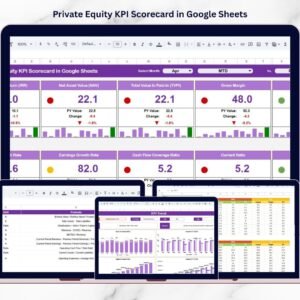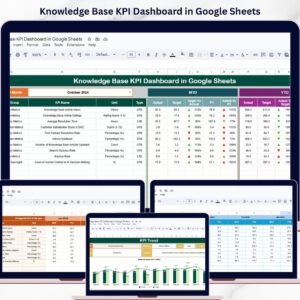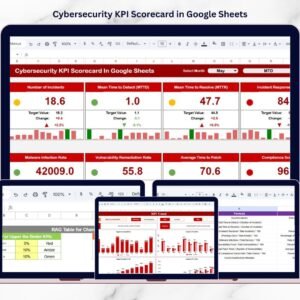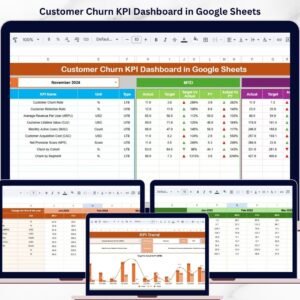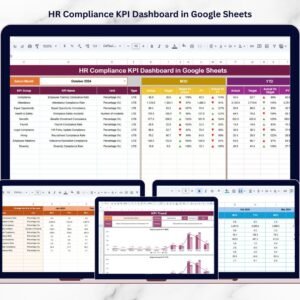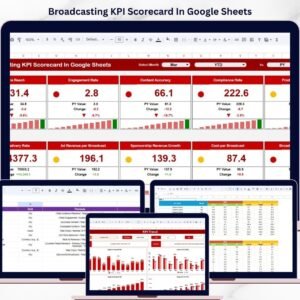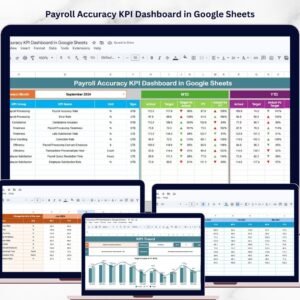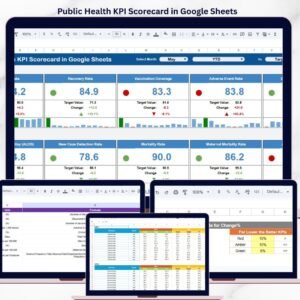
Delivering a smooth onboarding experience directly impacts customer satisfaction, product adoption, and long-term retention. However, many onboarding teams struggle because onboarding performance is not measured with clear KPIs and structured reporting. Without visibility into onboarding speed, completion, engagement, and satisfaction, teams rely on assumptions instead of data.
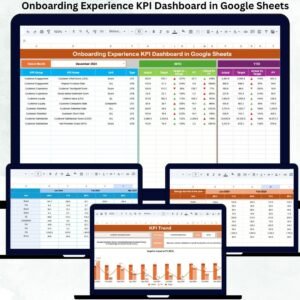
The Onboarding Experience KPI Dashboard in Google Sheets solves this challenge by providing a centralized, ready-to-use performance management system. It helps onboarding teams track onboarding efficiency, customer engagement, completion timelines, satisfaction scores, and adoption success—all in one interactive dashboard.
Because this dashboard is built in Google Sheets, it remains simple, collaborative, and highly flexible, without the need for expensive BI tools.
🚀 Key Features of the Onboarding Experience KPI Dashboard
✅ Centralized onboarding performance tracking
✅ MTD & YTD KPI monitoring
✅ Target vs Actual comparison
✅ Previous Year benchmarking
✅ KPI trend analysis
✅ Clear KPI definitions with formulas
✅ UTB / LTB performance indicators
✅ Fully automated calculations
✅ Built entirely in Google Sheets
This dashboard transforms onboarding data into actionable insights for faster improvement.
📊 What’s Inside the Onboarding Experience KPI Dashboard
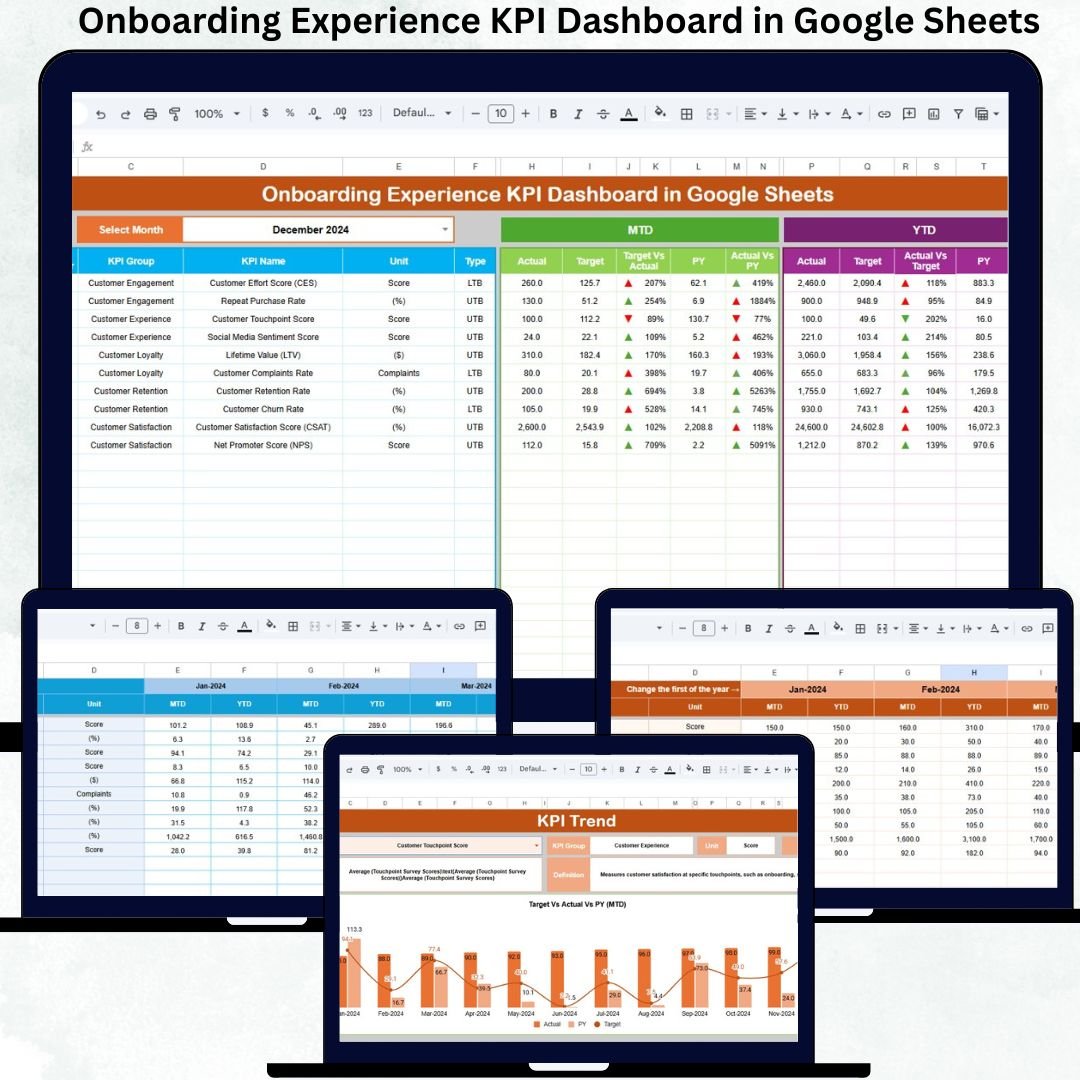
🧭 Dashboard Sheet Tab – Executive Overview
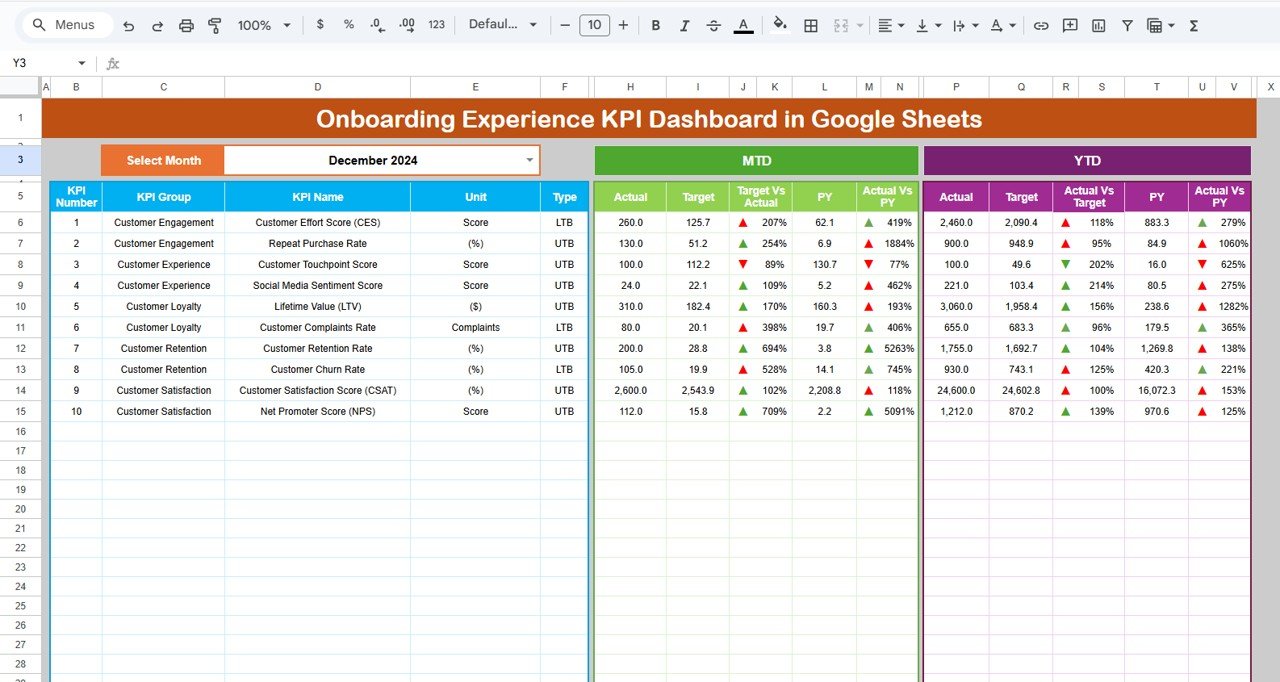
This is the main control center for onboarding performance.
You select the Month from the dropdown in cell D3, and the entire dashboard updates automatically.
MTD View Includes
MTD Actual
MTD Target
MTD Previous Year
Target vs Actual
Previous Year vs Actual
YTD View Includes
YTD Actual
YTD Target
YTD Previous Year
Target vs Actual
Previous Year vs Actual
Visual up and down arrows instantly indicate performance improvement or decline based on KPI direction (UTB / LTB).
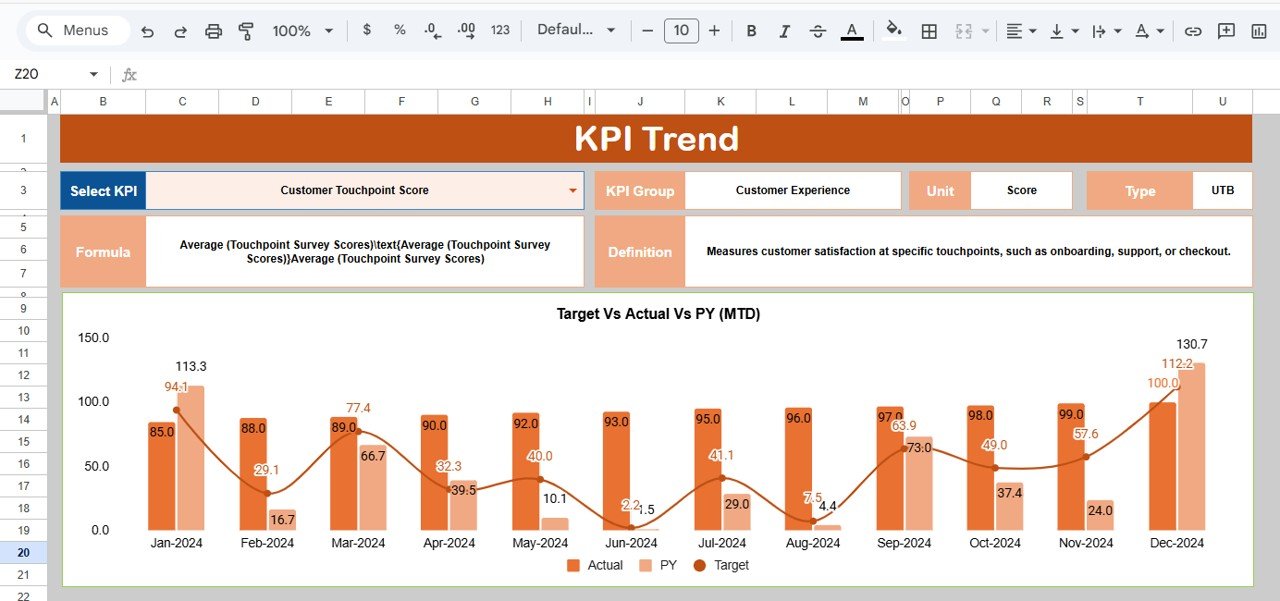
📈 KPI Trend Sheet Tab – KPI-Level Analysis
This sheet allows deep KPI diagnostics.
From the dropdown in cell C3, select any KPI to view:
KPI Group
KPI Unit
KPI Type (Upper the Better / Lower the Better)
KPI Formula
KPI Definition
A month-wise trend chart shows how onboarding performance evolves over time, helping teams identify bottlenecks and improvement opportunities early.
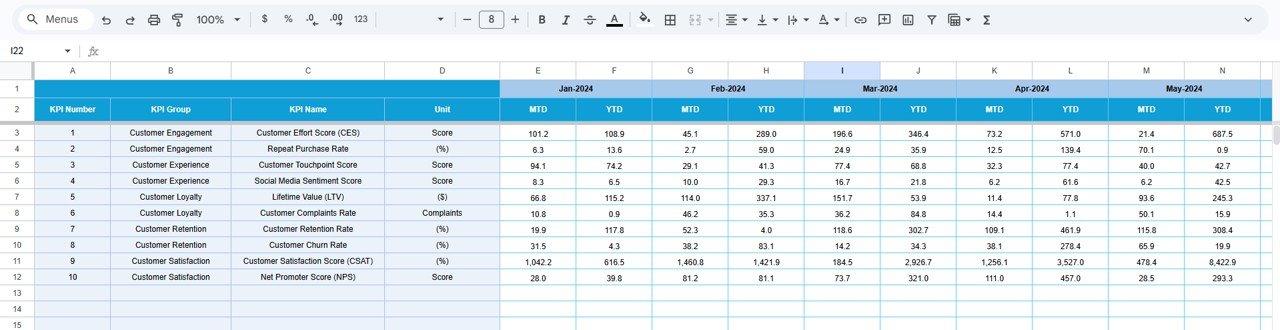
🧮 Actual Number Sheet Tab – Data Entry Layer
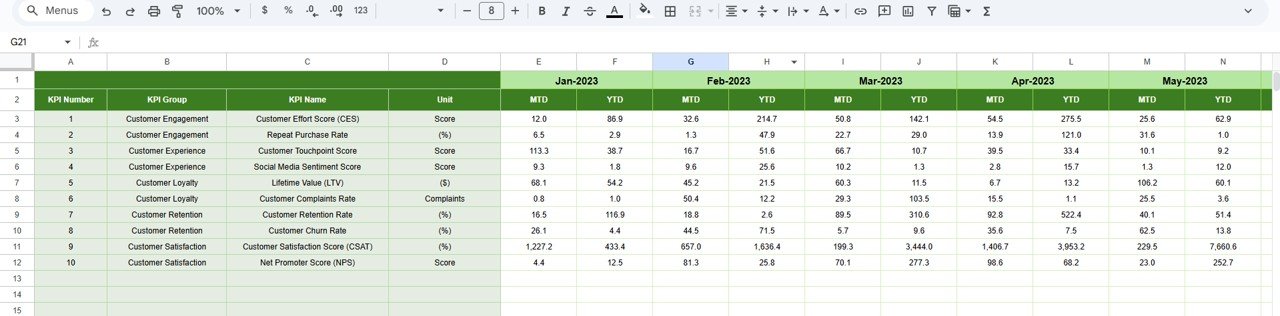
This sheet stores actual onboarding performance values.
Enter MTD Actual and YTD Actual values
Select the first month of the year in cell E1
YTD values update automatically
This clean separation ensures accuracy and easy maintenance.
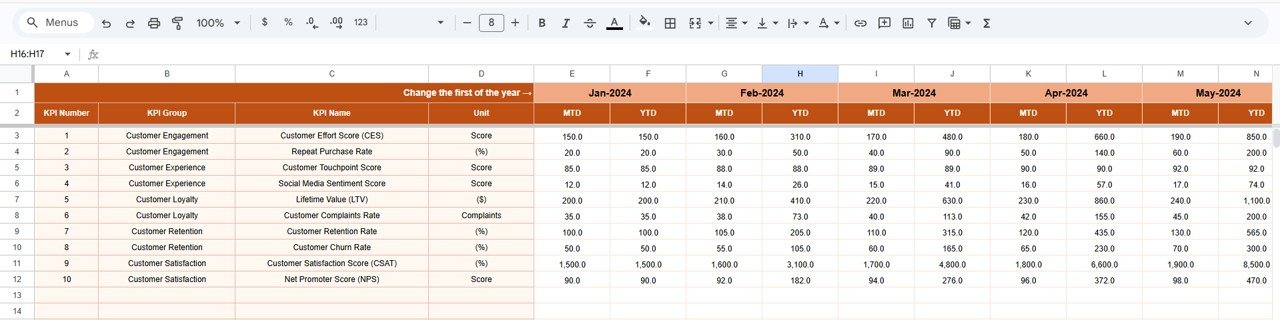
🎯 Target Sheet Tab – Performance Planning
This sheet contains:
Monthly (MTD) targets
Annual (YTD) targets
Targets flow automatically into the dashboard and trend analysis, enabling effective performance management.
⏳ Previous Year Number Sheet Tab – YoY Analysis
This sheet stores last year’s onboarding KPI values.
It enables:
Year-over-year comparison
Trend benchmarking
Realistic goal-setting
Teams clearly see whether onboarding experience is improving or declining.
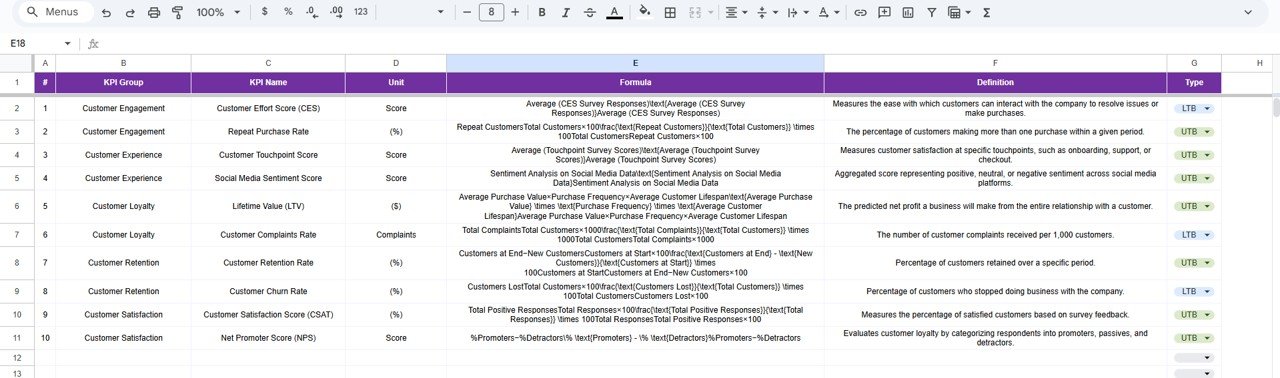
📚 KPI Definition Sheet Tab – Governance Backbone
This is the most important reference sheet.
It includes:
KPI Name
KPI Group
Unit
Formula
KPI Definition
KPI Type (UTB / LTB)
All dashboard logic pulls from this sheet, ensuring transparency, consistency, and scalability.
⚙️ How This Dashboard Helps Decision-Making
✔ Identifies onboarding delays early
✔ Reduces customer drop-offs
✔ Improves customer satisfaction
✔ Increases product adoption speed
✔ Optimizes onboarding resources
✔ Enables data-driven onboarding improvements
Leadership gains actionable insights in seconds.
👥 Who Can Use This Dashboard
🚀 Onboarding Teams
📊 Customer Experience (CX) Teams
🧑💼 Product Managers
🔧 Customer Success Teams
📈 Growth & Retention Teams
Ideal for SaaS platforms, digital products, apps, fintech, and subscription businesses.
✅ Advantages of the Onboarding Experience KPI Dashboard
✔ No expensive BI tools required
✔ Easy monthly KPI tracking
✔ Clear UTB vs LTB visibility
✔ Built-in MTD, YTD & YoY analysis
✔ Fully customizable KPI framework
✔ Simple collaboration via Google Sheets
🔧 Opportunities for Improvement
You can extend this dashboard by adding:
Funnel-step level onboarding KPIs
Automation via Google Forms
Integration with CRM or product analytics tools
Segmentation by customer type or plan
SLA and onboarding milestone tracking
✅ Best Practices
Maintain a standardized KPI definition sheet
Update actuals regularly
Review KPI trends monthly
Align targets with product maturity
Keep dashboard visuals focused and clean
✅ Conclusion
The Onboarding Experience KPI Dashboard in Google Sheets brings structure, clarity, and control to onboarding performance tracking. By combining KPI definitions, actuals, targets, trends, and comparisons in one place, onboarding teams move from reactive problem-solving to proactive optimization.
When used consistently, this dashboard transforms onboarding into a measurable growth engine.
📖 Click here to read the Detailed Blog Post
Watch the step-by-step video tutorial: