

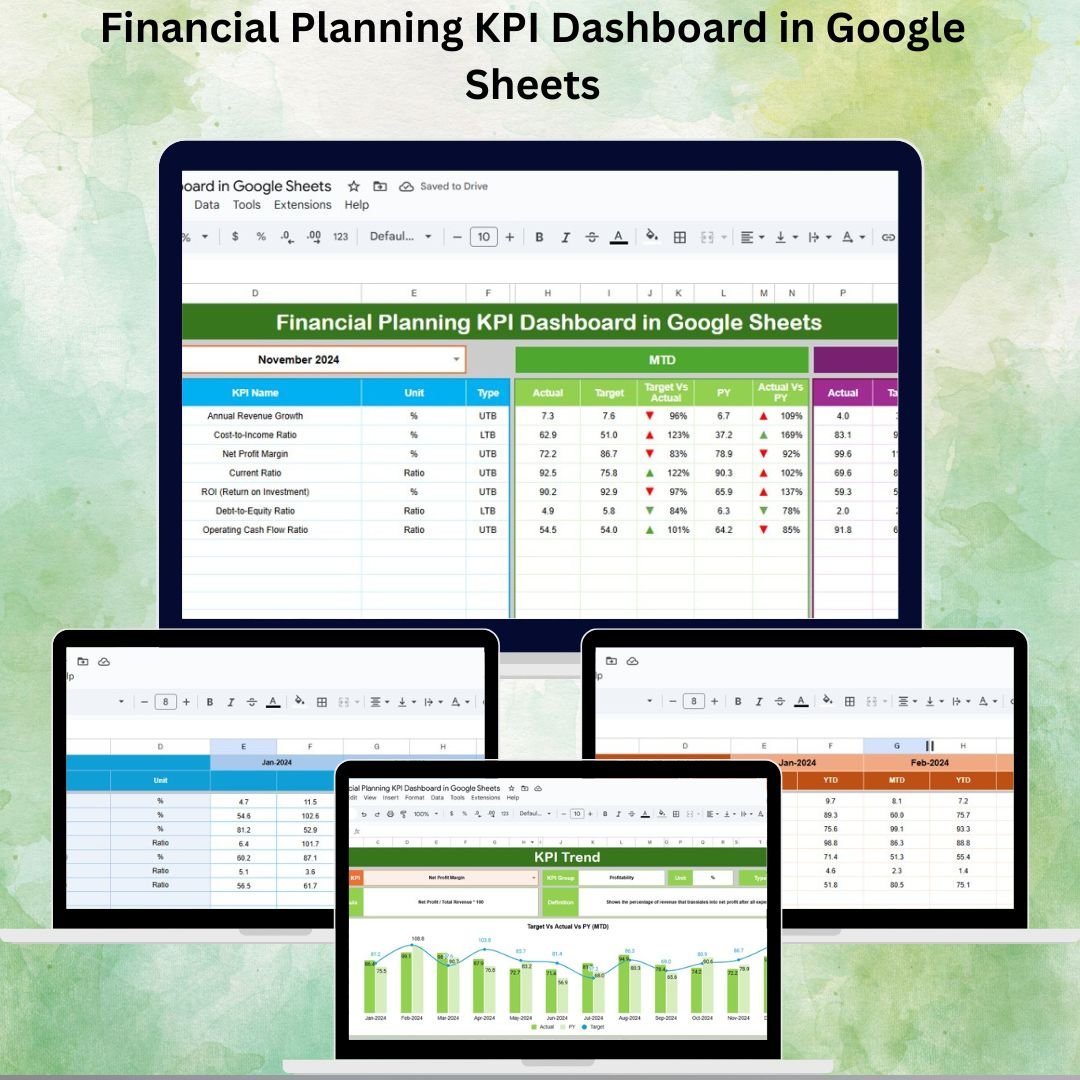

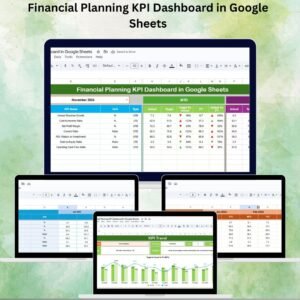
Managing finances effectively is a cornerstone of business success. Without clear insights into key financial metrics, organizations risk overspending, missed targets, and poor decision-making. The Financial Planning KPI Dashboard in Google Sheets is a ready-to-use, interactive solution designed to give finance teams, managers, and decision-makers full visibility over financial performance.
This dashboard consolidates Month-to-Date (MTD), Year-to-Date (YTD), targets, and previous year data into one easy-to-navigate tool. With real-time updates, automated calculations, and intuitive visuals, it ensures businesses stay informed and agile in managing their financial health.
🔑 Key Features of Financial Planning KPI Dashboard
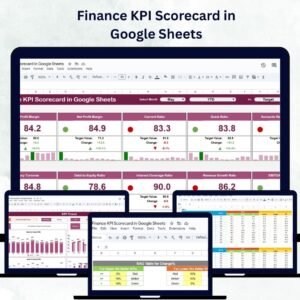
📊 Dashboard Sheet Tab
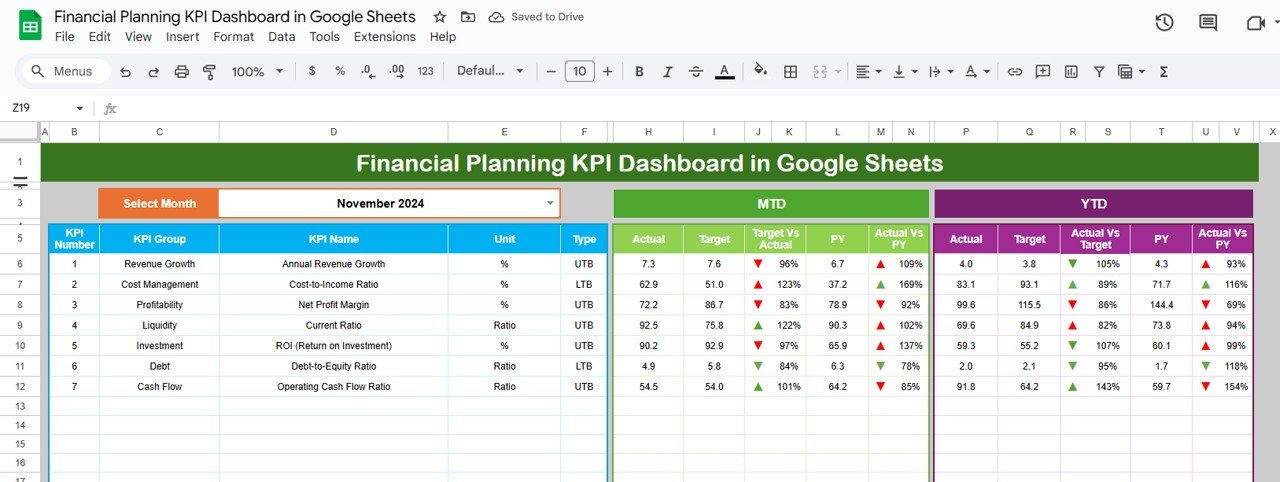
Main interface showing all KPIs at a glance.
Select a month (cell D3) to auto-update the entire dashboard.
Displays MTD Actual, Target, and Previous Year data with up/down arrows for trend analysis.
YTD insights with conditional formatting indicators.
Dynamic charts and progress visuals for instant clarity.
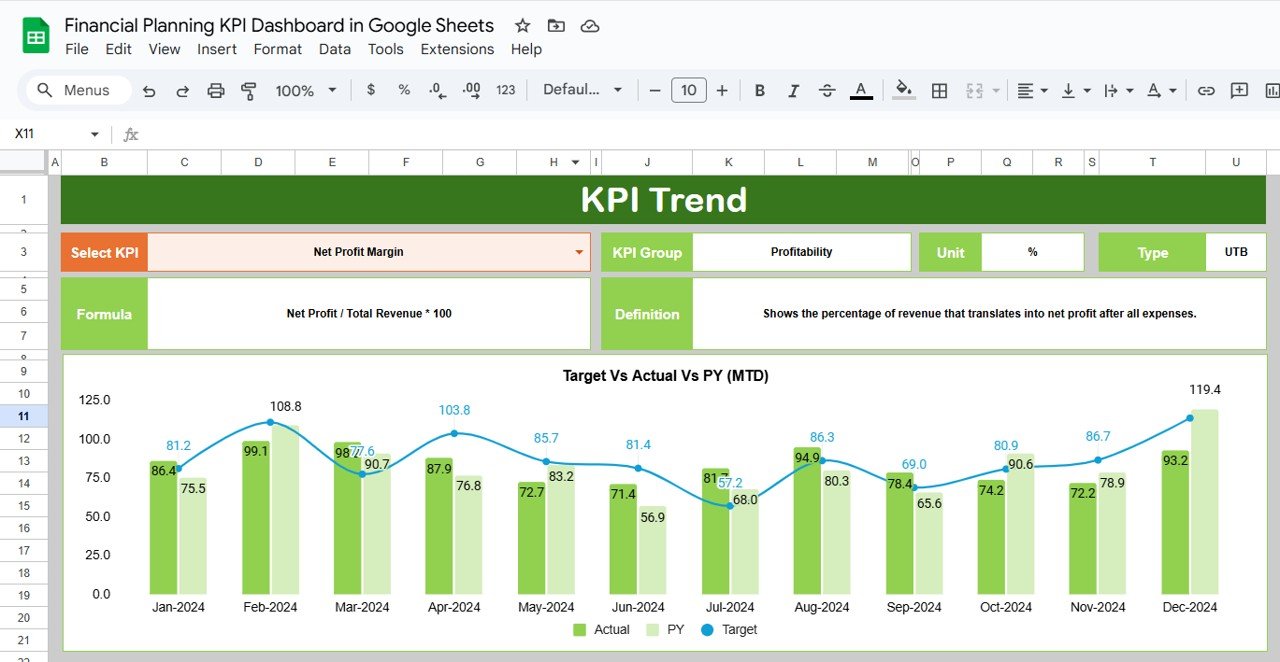
📈 KPI Trend Sheet Tab
Select a KPI (cell C3) for a detailed breakdown.
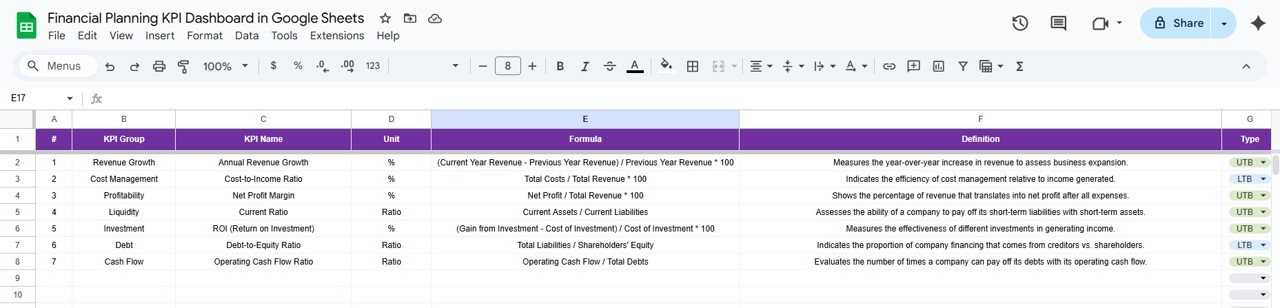
Includes KPI Group, Unit, Type (Lower the Better / Upper the Better), Formula, and Definition.
Helps users understand calculations and purpose for consistent tracking.
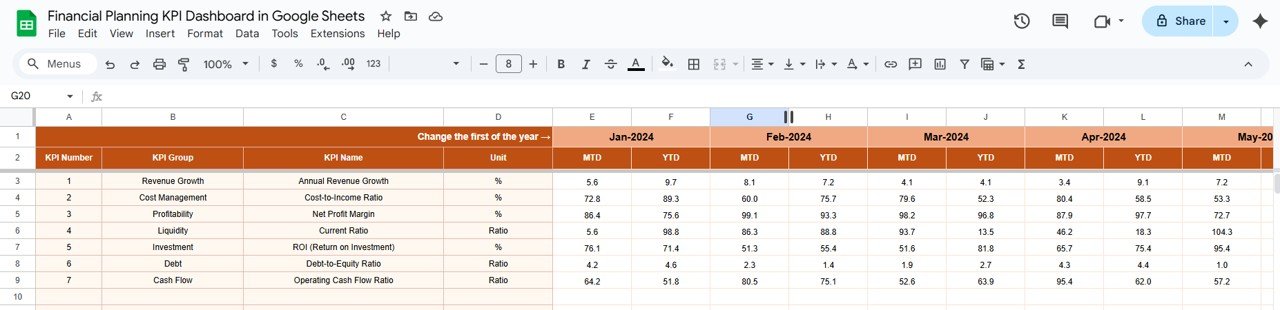
🧾 Actual Number Sheet Tab
Input monthly and yearly actual numbers.
Enter starting month (cell E1) to auto-update totals.
Ensures a single source of truth for all financial data.
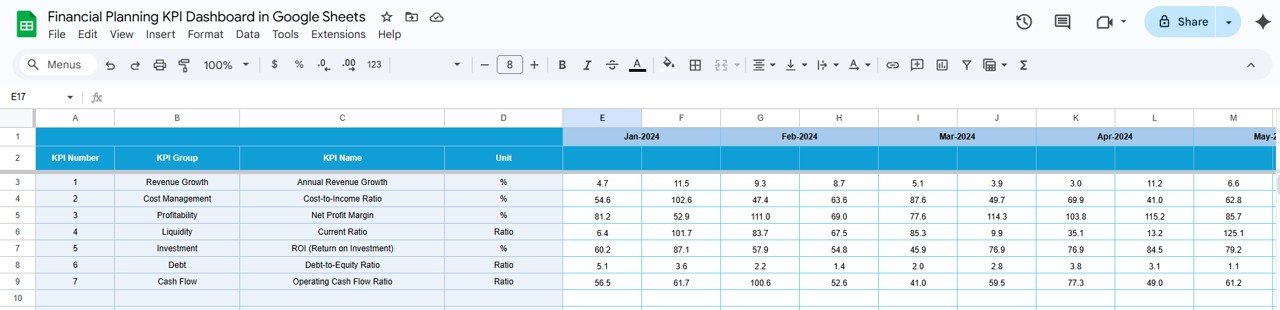
🎯 Target Sheet Tab
Enter planned MTD and YTD targets.
Provides benchmarks for measuring financial success.
📉 Previous Year Numbers Sheet Tab
Stores historical data for year-over-year comparisons.
Track growth patterns and identify recurring issues.
📑 KPI Definition Sheet Tab
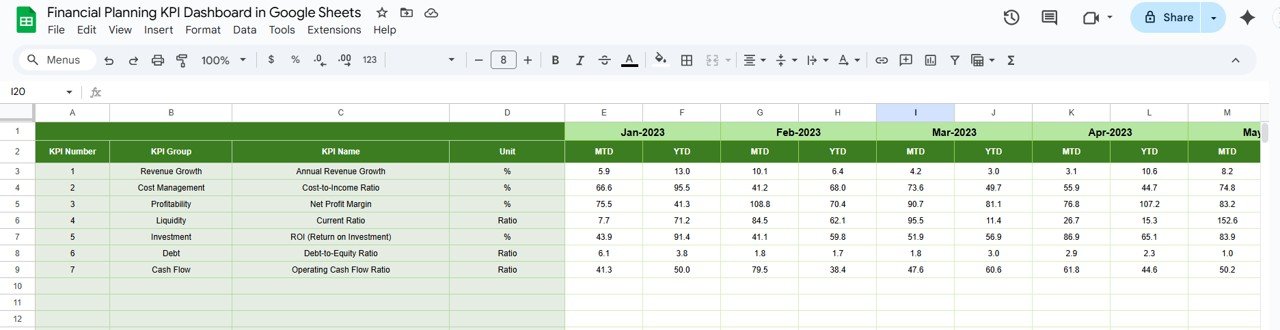
Master list of all KPIs with names, groups, formulas, and definitions.
Ensures clarity, standardization, and transparency across all users.
📦 What’s Inside the Dashboard
✅ 6 Structured Worksheets – Dashboard, KPI Trend, Actual Numbers, Targets, Previous Year, KPI Definitions
✅ Automated KPI Calculations – MTD, YTD, and PY comparisons
✅ Dynamic Visuals – Charts, conditional arrows, and progress indicators
✅ Customizable KPIs – Add, remove, or adjust KPIs as needed
✅ Cloud-Based Collaboration – Share in real time with Google Sheets
✅ User-Friendly Design – No coding or advanced knowledge required
👥 Who Can Benefit from This Dashboard?
💼 Finance Managers & CFOs – Get clear visibility of organizational financial health.
📊 Project Managers – Track budgets, expenditures, and performance targets.
🏢 Business Owners – Monitor profitability and growth at a glance.
👥 Finance Teams – Collaborate on real-time data for accuracy and compliance.
This dashboard is ideal for businesses of all sizes looking to improve transparency, efficiency, and decision-making in financial planning.
📋 Best Practices for Using the Dashboard
🔄 Update Data Regularly – Keep MTD/YTD numbers current.
🎯 Set Realistic Targets – Align goals with capacity and market conditions.
📊 Review Monthly Trends – Use arrows to quickly spot underperformance.
📘 Document KPI Formulas – Maintain transparency for audits and training.
👥 Collaborate in Real Time – Share with finance and management teams.
✅ Advantages of Financial Planning KPI Dashboard
Centralized Data – All financial KPIs in one sheet.
Real-Time Updates – Monthly selection updates dashboard instantly.
Comparative Insights – MTD vs YTD and PY vs Actual comparisons.
Customizable – Adapt KPIs to match business objectives.
Affordable & Accessible – Built in Google Sheets, no expensive software needed.
Decision Support – Data-driven insights improve financial strategies.
🔗 Click here to read the Detailed blog post
Watch the step-by-step video Demo:
🔗 Visit our YouTube channel to learn step-by-step video tutorials
Compatibility and Requirements
- Works in Google Sheets. You need a free Google account and a web browser.
- You pick the month in cell D3 of the Dashboard sheet and the KPI in cell C3 of the KPI Trend sheet. Google explains dropdowns in Create an in-cell dropdown list.
Frequently Asked Questions
Which sheets are included?
Six sheets: Dashboard, KPI Trend, Actual Number, Target, Previous Year Numbers and KPI Definition.
How do I update the dashboard for a new month?
Enter your monthly and yearly actual numbers in the Actual Number sheet and your MTD and YTD targets in the Target sheet. Then select the month in cell D3 on the Dashboard sheet and everything updates.
Can I compare this year with last year?
Yes. Add last year’s figures to the Previous Year Numbers sheet. The Dashboard shows MTD Actual, Target and Previous Year data with up and down arrows.
How do I see the details of one KPI?
Open the KPI Trend sheet and select the KPI in cell C3. It shows the KPI group, unit, type (Lower the Better or Upper the Better), formula and definition.
Is there an Excel or Power BI version?
Yes. See the Financial Planning KPI Dashboard in Excel and the Financial Planning KPI Dashboard in Power BI.
Related Financial Planning Templates
- Financial Planning KPI Dashboard in Excel: the same KPIs in Excel
- Financial Planning KPI Dashboard in Power BI: the Power BI edition
- Financial Planning Calendar in Google Sheets: schedule your planning tasks
- Training Financial Planning Dashboard in Google Sheets: a planning dashboard for training budgets
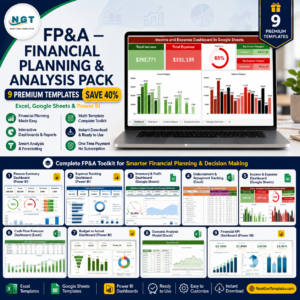
- FP&A Financial Planning & Analysis Pack: 9 templates for planning and analysis in one download
Browse all Google Sheets KPI dashboards.

Reviews
There are no reviews yet.