

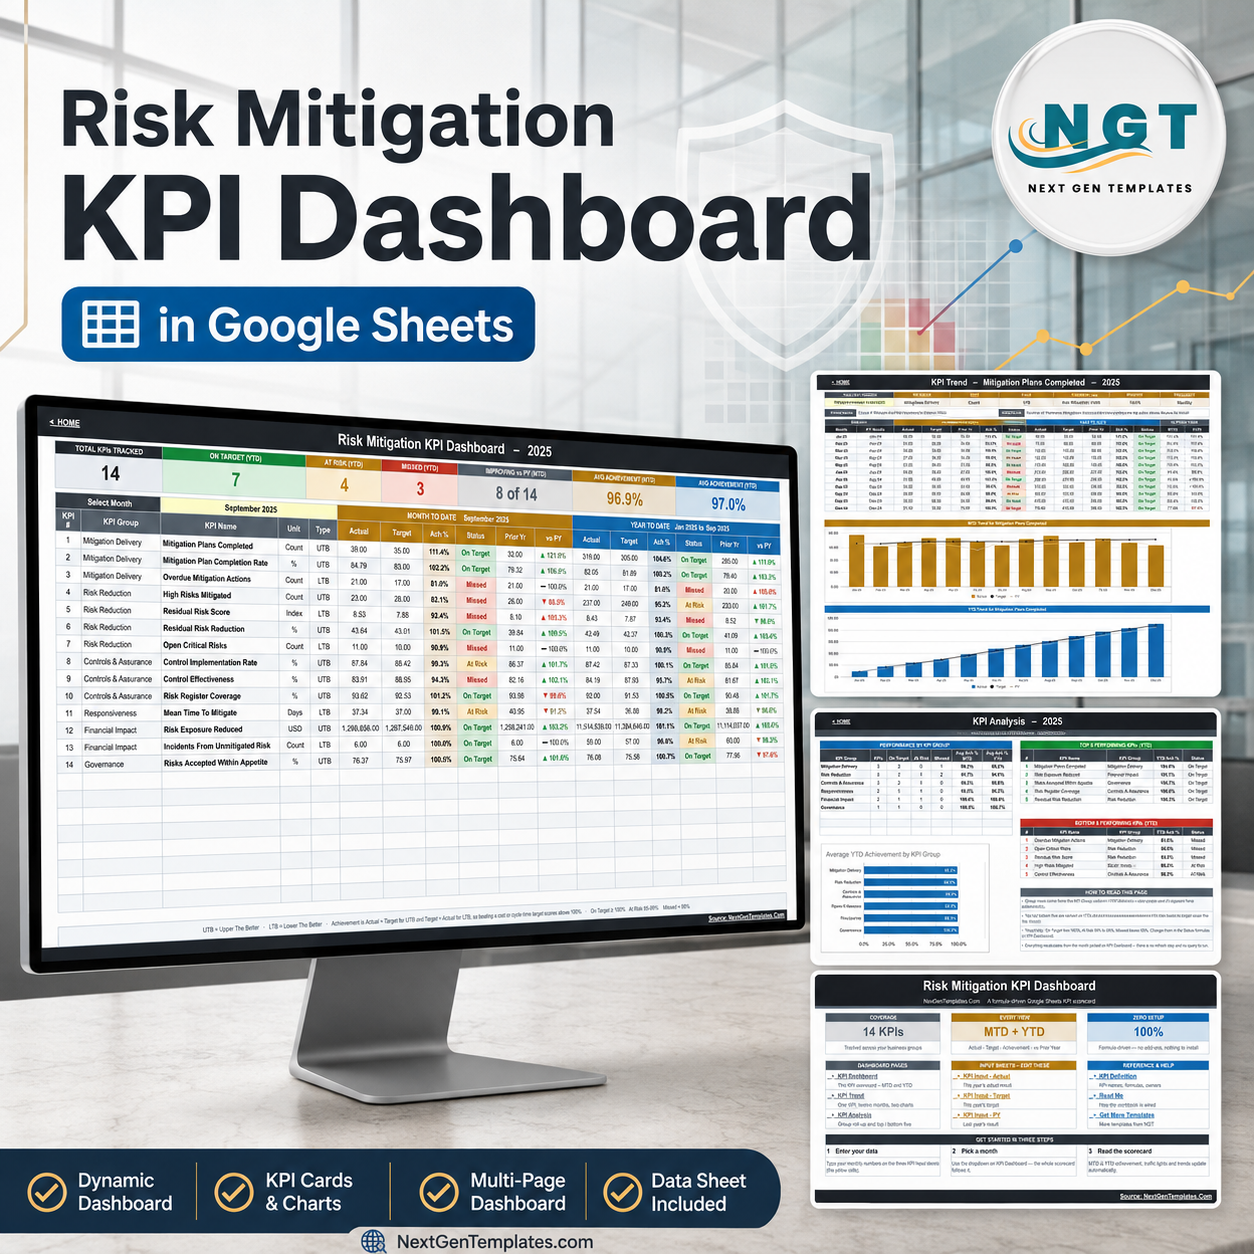

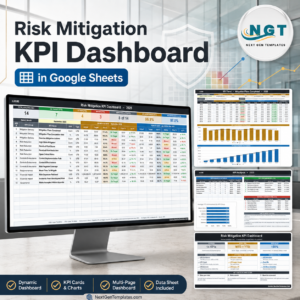
The Risk Mitigation KPI Dashboard in Google Sheets is a formula-driven monthly scorecard that tracks 14 risk mitigation KPIs across 6 groups – Mitigation Delivery, Risk Reduction, Controls & Assurance, Responsiveness, Financial Impact and Governance. Pick a month from one dropdown and every number on the sheet re-bases: month-to-date and year-to-date actual, target, achievement percentage, prior-year comparison and a traffic light. It ships with a full sample year (January to December 2025), opens on September 2025, and needs no add-on, no Apps Script and no refresh step. Built by a Microsoft Certified Professional with 15+ years in spreadsheets. Instant download, lifetime access, use it on unlimited projects.
Be clear about what this is: a reporting sheet for numbers you already have. It is not a risk management system of record, it runs no risk scoring or assessment methodology, it is not aligned to or certified against ISO 31000, COSO, NIST or SOC 2, it keeps no audit trail, and it satisfies no regulatory or insurance requirement. Every figure in it is typed in by you and evidences nothing on its own.
Key Features of the Risk Mitigation KPI Dashboard in Google Sheets
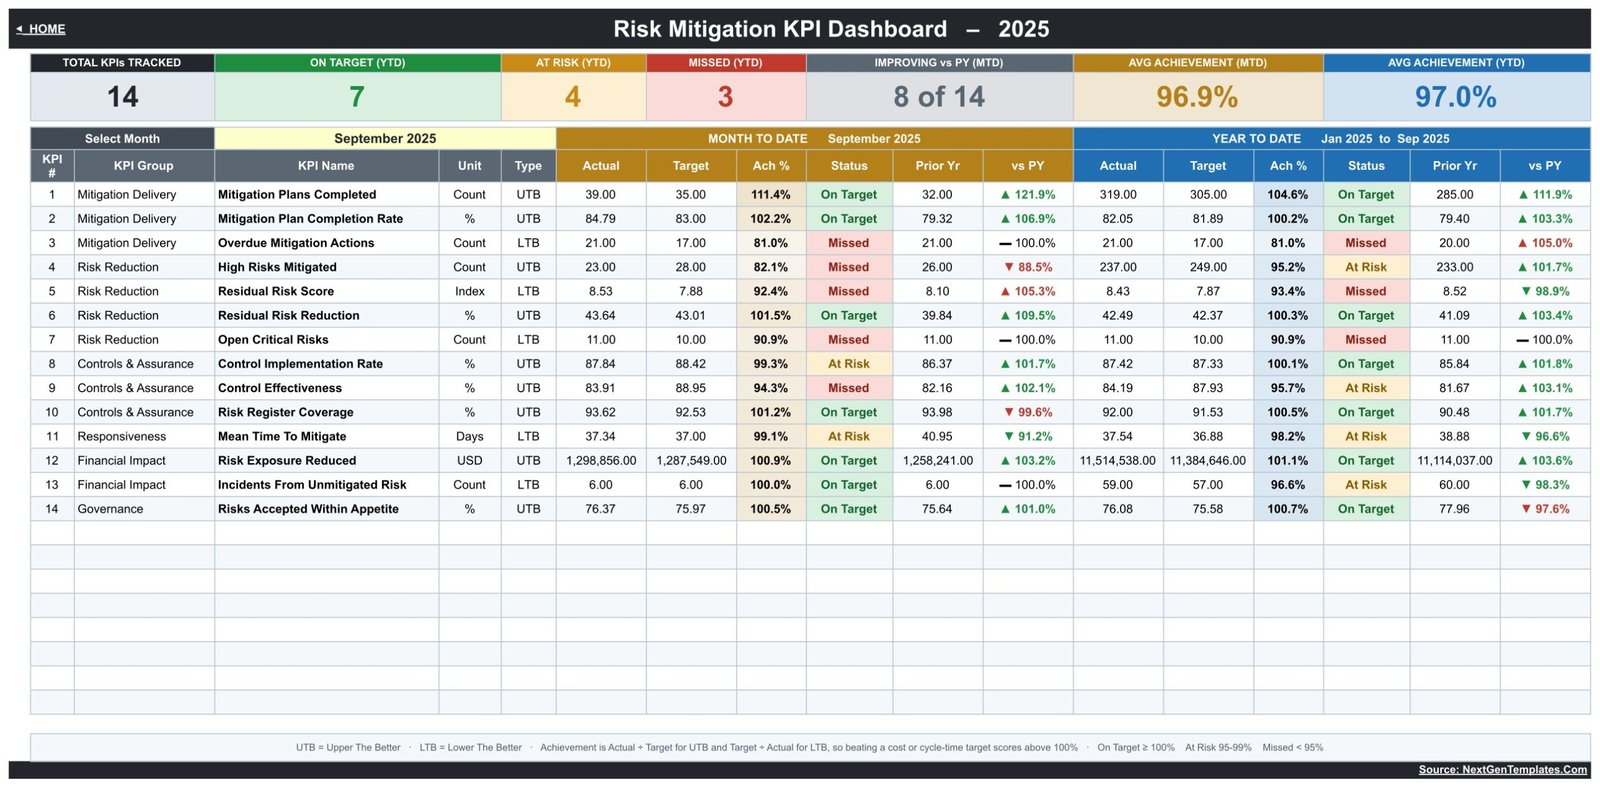
- 14 risk mitigation KPIs, six groups. Mitigation Plans Completed, Mitigation Plan Completion Rate, Overdue Mitigation Actions, High Risks Mitigated, Residual Risk Score, Residual Risk Reduction, Open Critical Risks, Control Implementation Rate, Control Effectiveness, Risk Register Coverage, Mean Time To Mitigate, Risk Exposure Reduced, Incidents From Unmitigated Risk and Risks Accepted Within Appetite.
- One month picker drives everything. Change the dropdown on the KPI Dashboard sheet and the scorecard, the group roll-up and the top/bottom five all follow it.
- MTD and YTD side by side. Each KPI shows actual, target, achievement %, status and prior-year for both windows, so a good month inside a bad year is visible immediately.
- Direction-aware achievement. Every KPI is typed UTB (upper the better) or LTB (lower the better). Achievement is Actual ÷ Target for UTB and Target ÷ Actual for LTB, so beating a cost or cycle-time target scores above 100%.
- Three traffic lights, editable thresholds. On Target from 100%, At Risk 95-99%, Missed below 95%. The thresholds live in the status formulas, not in a locked script.
- Seven header cards. Total KPIs tracked, On Target (YTD), At Risk (YTD), Missed (YTD), improving vs prior year (MTD), and average achievement for MTD and YTD.
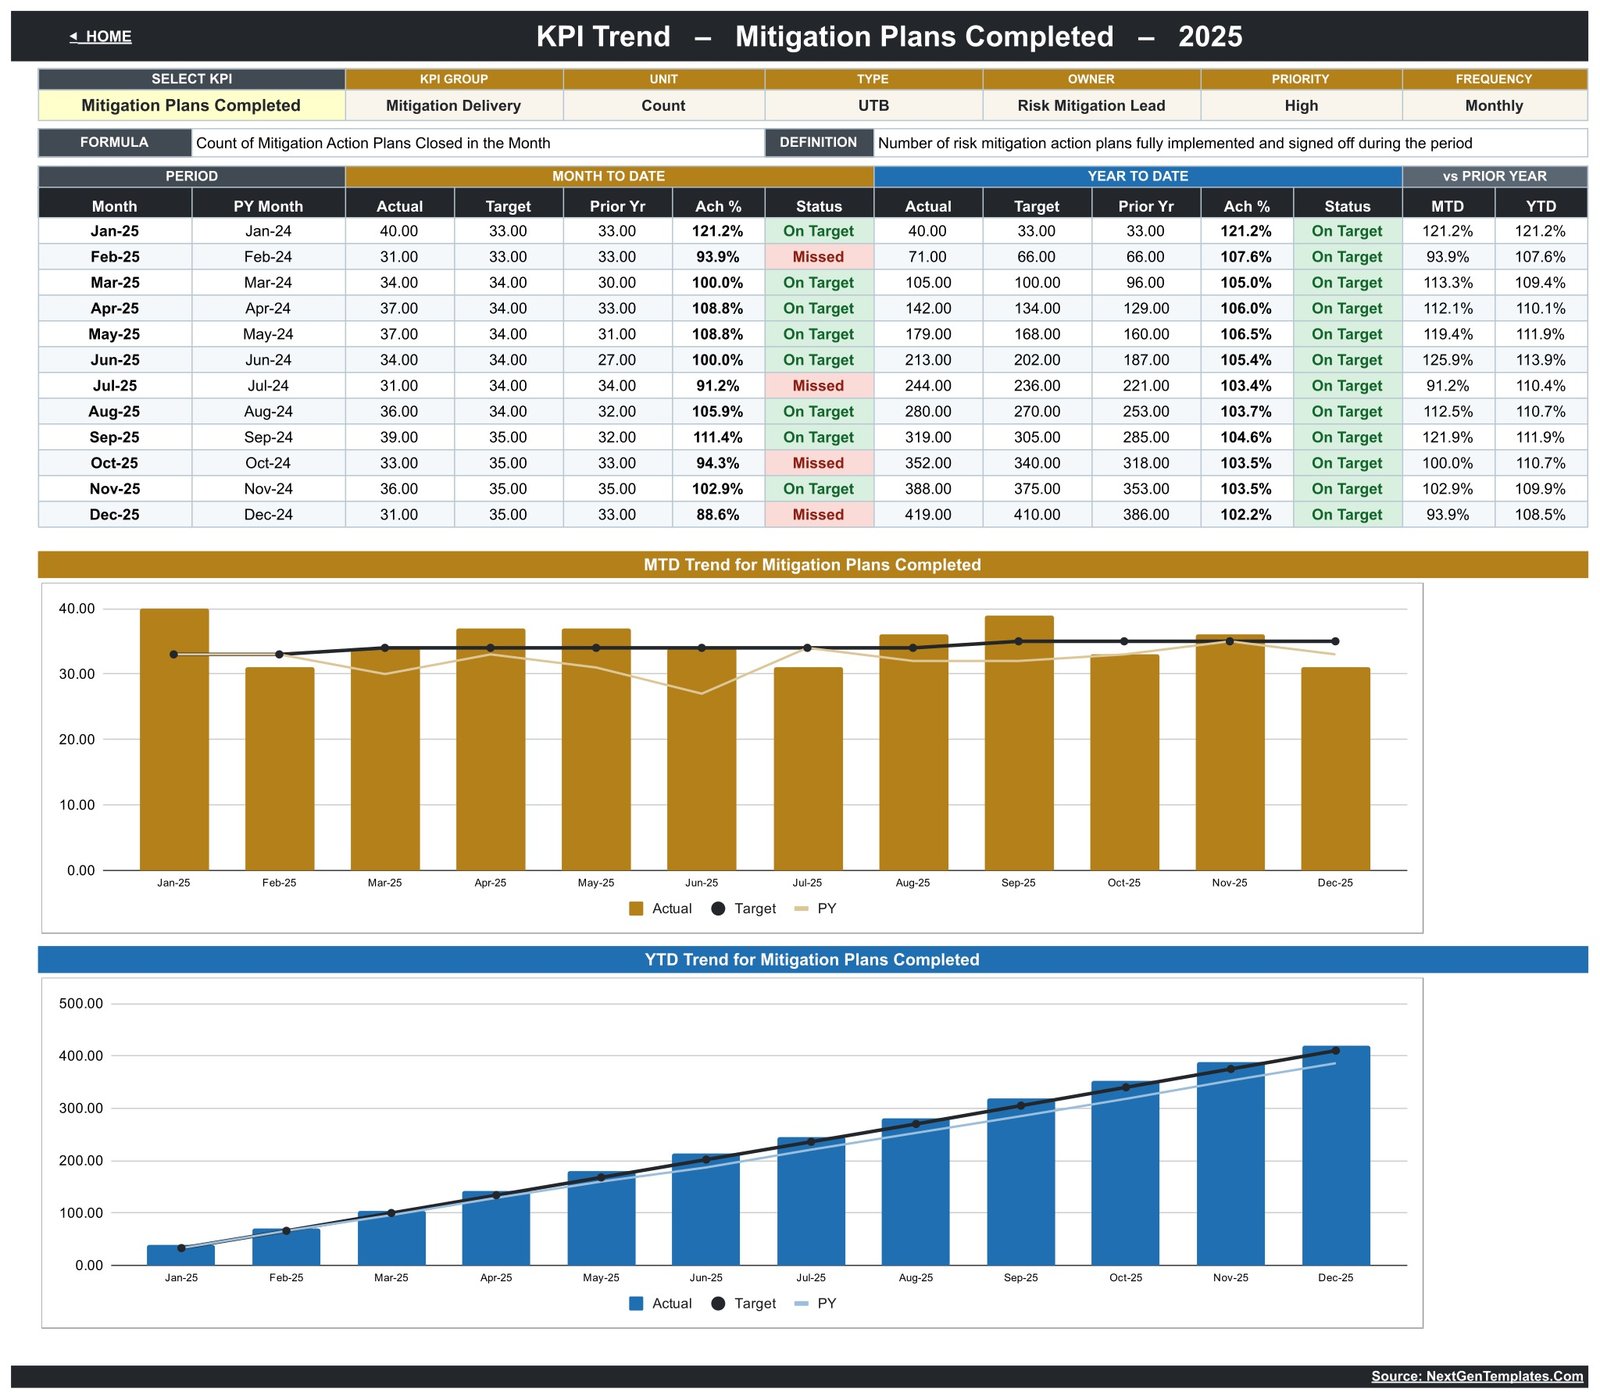
- A single-KPI trend page. Choose one KPI and see twelve months of MTD and YTD figures plus two charts – Actual vs Target vs Prior Year monthly, and the cumulative YTD build.
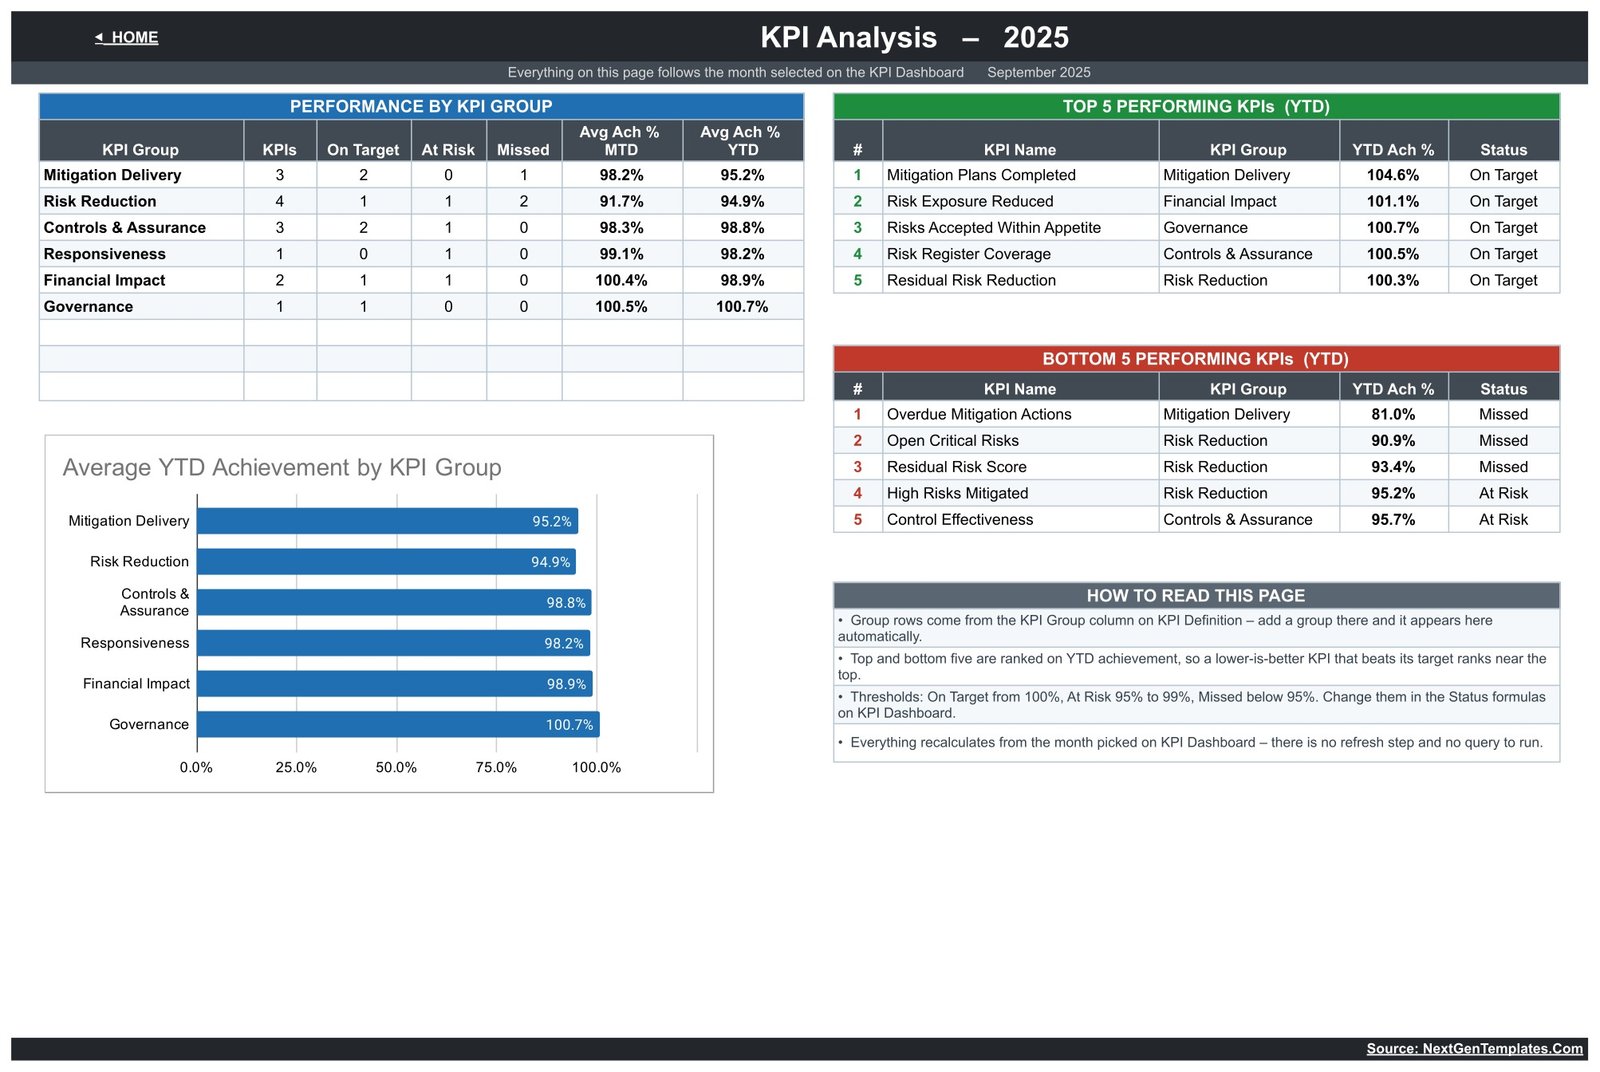
- An analysis page. Performance by KPI group, top five and bottom five performing KPIs on YTD achievement, and a bar chart of average YTD achievement by group.
- The KPI list is data, not code. Add, rename or delete a KPI on the KPI Definition sheet and every other sheet follows automatically – no formula edits.
- Mixed units handled. Count, %, Index, Days and USD KPIs sit in the same scorecard without breaking the achievement maths.
What’s Inside the Risk Mitigation KPI Dashboard in Google Sheets
Ten tabs, grouped by what you do with them. The Home sheet is the navigation hub and lists all of them with a three-step start guide.
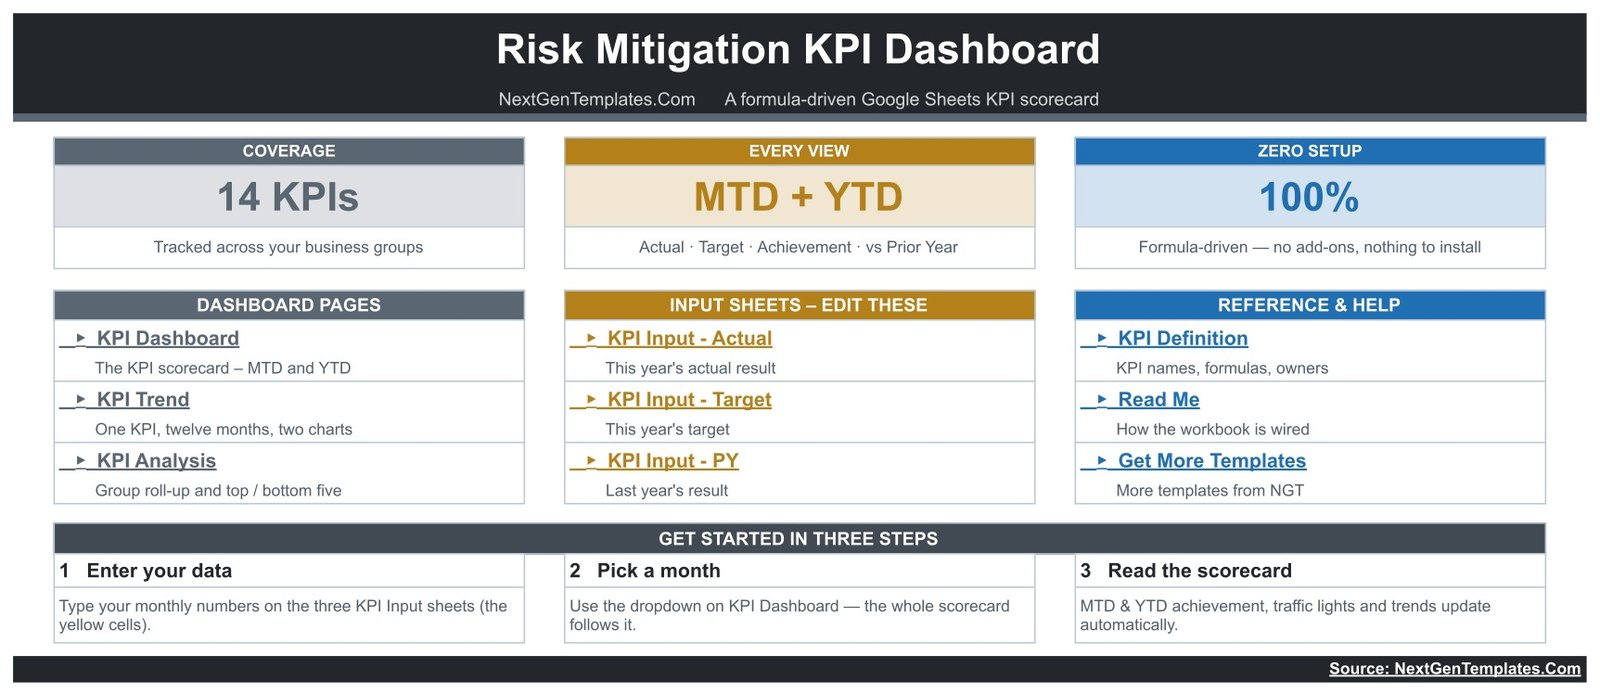
Dashboard pages. KPI Dashboard is the scorecard – 14 rows, the month picker, MTD and YTD blocks and the seven header cards. KPI Trend takes one KPI and gives you its group, unit, type, owner, priority, frequency, formula and definition, then twelve months of numbers and two charts. KPI Analysis rolls the 14 KPIs up into their six groups and ranks the best and worst five on YTD achievement.
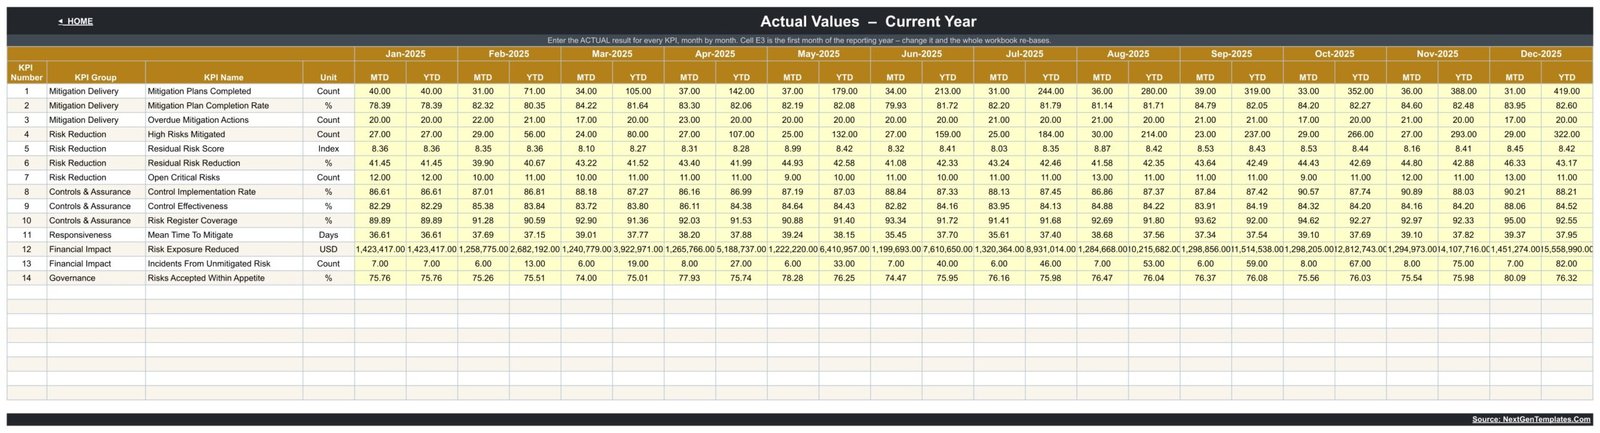
Input sheets – the only cells you edit. KPI Input – Actual, KPI Input – Target and KPI Input – PY share one layout: 14 KPI rows across twelve months, with MTD and YTD columns per month, in yellow entry cells. Cell E3 on the Actual sheet sets the first month of the reporting year – change it and the whole workbook re-bases.
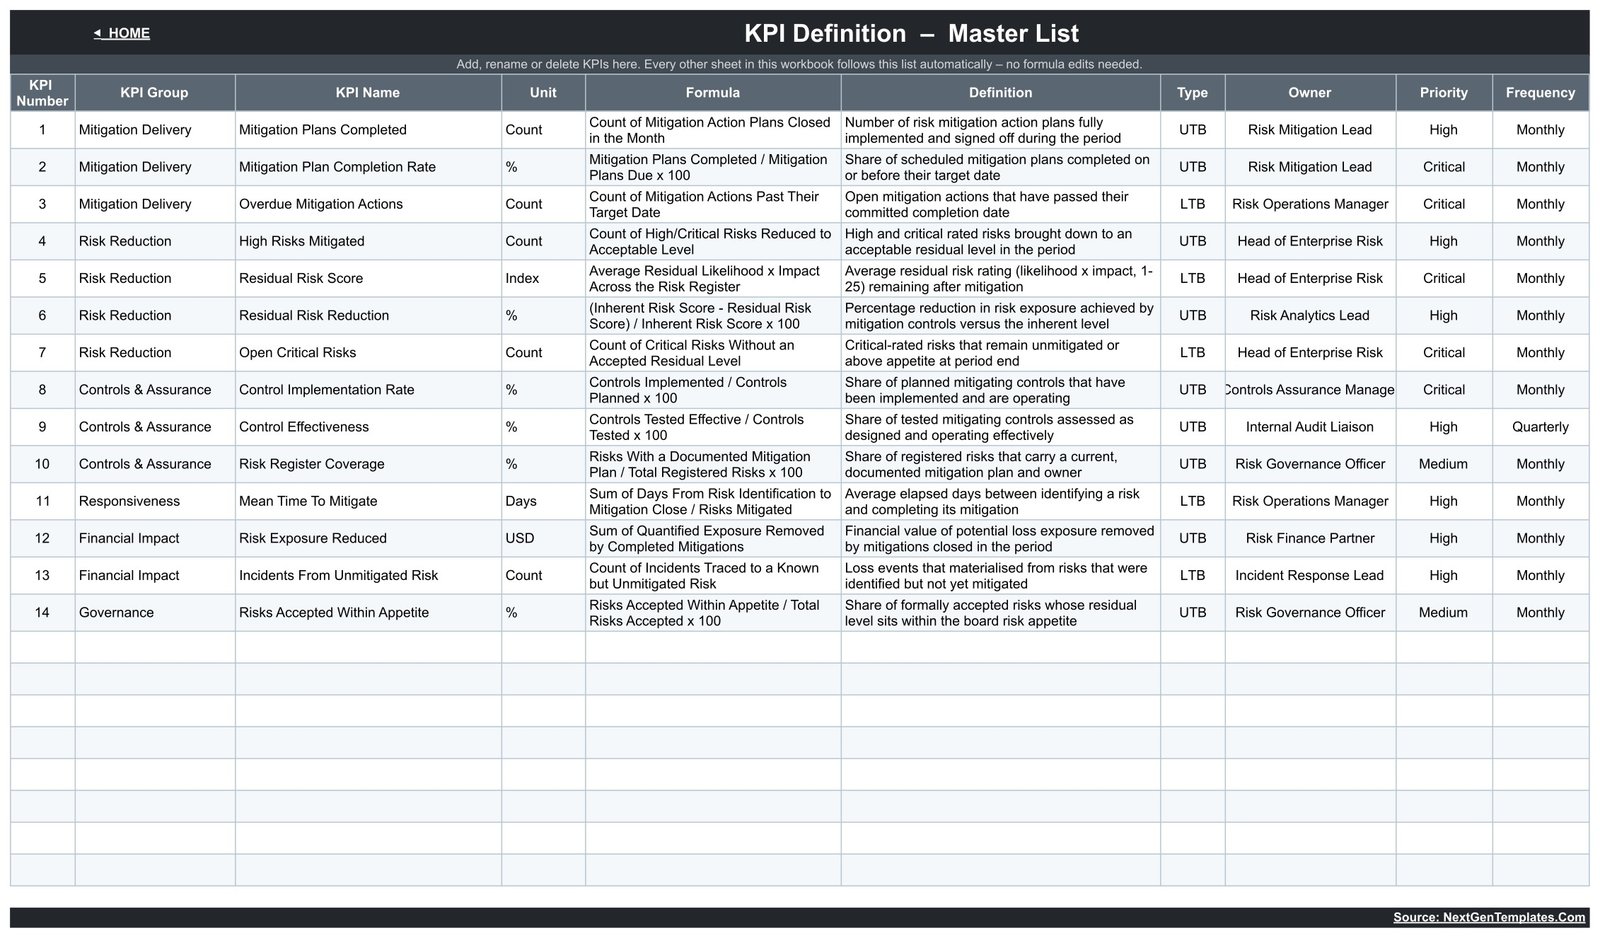
Reference and help. KPI Definition is the master list: KPI number, group, name, unit, formula, definition, type, owner, priority and frequency for all 14. The sample owners run from Risk Mitigation Lead and Risk Operations Manager to Head of Enterprise Risk, Internal Audit Liaison and Risk Governance Officer, with Critical / High / Medium priorities and Monthly or Quarterly cadences. A Read Me sheet explains the wiring and a Get More Templates sheet links back to the catalogue.
Google Sheets vs. Excel vs. Paid GRC Software – Where This Fits
| This template (Google Sheets) | Excel KPI dashboard | Paid GRC / risk platform | |
|---|---|---|---|
| Cost | One-off, under $15 | One-off, similar | $5,000-$50,000+ per year |
| Platform | Google Sheets, browser only | Desktop Excel | Vendor-hosted SaaS |
| Setup time | Minutes – copy and type | Minutes | Weeks of implementation |
| Real-time team collaboration | Yes, native | Via OneDrive only | Yes |
| Mobile access | Sheets app | Excel app | Vendor app |
| Customisable KPI list | Yes – edit one sheet | Yes | Usually vendor-configured |
| Share with a link | Yes | No | Seat-based |
| Year-1 cost at 5 users | Under $15 total | Under $20 total | Often five figures |
| Risk register with workflow and approvals | No | No | Yes |
| Audit trail / e-signature / evidence store | No | No | Yes |
The honest read: a GRC platform holds the register, the evidence and the approvals. This sheet holds the numbers you report upward once that work is done – and it costs about as much as lunch.
Who This Template Is For – and Who It’s Not For
A good fit for risk and assurance leads who already keep a register somewhere and need a monthly one-pager for a risk committee; operations managers tracking whether mitigation actions actually close; small and mid-size teams with no GRC budget; consultants who want a reusable client reporting format; and anyone who has been rebuilding the same board slide by hand every month.
Not a fit if you need the register itself – risk descriptions, owners, likelihood/impact scoring, treatment workflow, approvals or evidence attachments. It is also wrong for you if you need a system that calculates risk scores rather than displaying ones you supply, if you need per-user permissions inside the file, if you must demonstrate control operation to an auditor or insurer, or if your reporting is real-time rather than monthly. In every one of those cases, buy software.
How to Use the Risk Mitigation KPI Dashboard in Google Sheets
- Open the PDF in your download and click the Google Sheets link, then use File > Make a copy. The shared sheet is view-only by design; the copy in your Drive is yours to edit.
- Edit the KPI Definition sheet first. Replace the 14 sample KPIs with yours – name, group, unit, formula, definition, UTB or LTB, owner, priority, frequency. Every other sheet reads from this list.
- Set the reporting year. Cell E3 on KPI Input – Actual is the first month; change it and the twelve month columns re-label themselves.
- Type your numbers into the yellow cells on the three input sheets – actual, target and prior year, month by month.
- Pick a month on the KPI Dashboard. The scorecard, the analysis page and the roll-ups all follow it.
- Adjust the thresholds if 100/95 is wrong for you – they sit in the Status formulas on the KPI Dashboard sheet.
Real-World Use Cases
Priya, Risk Operations Manager at a 400-person logistics firm. Her register lives in a GRC tool the board never opens. Each month she exports six numbers, types them in, and takes one printed page to the risk committee – Overdue Mitigation Actions at 81.0% and Open Critical Risks at 90.9% get the conversation without a single slide.
Daniel, an independent assurance consultant. He copies the sheet per client, swaps the KPI Definition list for their metrics, and hands over a scorecard branded to their groups. Setup takes an afternoon instead of a fortnight.
Meera, Head of Enterprise Risk at a mid-market insurer. She uses the KPI Trend page to answer the one question the board always asks – “is this getting better or worse?” – by showing twelve months of Residual Risk Score against target and prior year on one chart.
Two Things to Fix in Sixty Seconds
Two cosmetic column widths ship slightly too narrow, and it is fairer to say so than to let you find them:
- On KPI Definition, the Owner cell for KPI 8 (Control Implementation Rate) shows “Controls Assurance Manager” clipped at both ends.
- On KPI Input – Actual, the eight-digit YTD figures on row 12 (Risk Exposure Reduced, USD) lose their last character from August onward.
Both are display-only – the underlying values are intact and every calculation is correct. Widen the two columns and they are gone.
Frequently Asked Questions
Does this make my organisation compliant with anything?
No. It is a reporting spreadsheet. It is not aligned to or certified against ISO 31000, COSO, NIST or SOC 2, it satisfies no regulatory or insurance requirement, and no auditor will accept it as evidence of anything.
Does it score or assess risks for me?
No. There is no scoring model and no assessment methodology anywhere in the file. Residual Risk Score is a number you type in; the sheet only compares it to the target you also typed in.
Is there an audit trail?
Not in the template. Google Sheets keeps its own version history, but the sheet itself records no approvals, sign-offs, timestamps or evidence links.
Can I change the KPI list?
Yes – that is the design. Add, rename or delete rows on the KPI Definition sheet and the dashboard, trend and analysis pages follow automatically. No formula edits.
Does it need an add-on, a script or a paid Google account?
No. It is pure spreadsheet formulas and charts, and it runs on a free Google account.
Is the data in the screenshots real?
No. Every figure is invented sample data for one year (2025) so you can see the sheet working. Delete it and type your own.
Can my team use it at the same time?
Yes. Once you have made your copy, share it like any Google Sheet. There are no per-user permissions inside the file, so anyone with edit access can change any input cell.
About the Author
Built by PK – Microsoft Certified Professional with 15+ years of Excel, Google Sheets, and Power BI experience. Founder of NextGenTemplates, reaching 300K+ subscribers across YouTube channels. Every template is hand-built and tested before release.
Explore Related Templates
Prefer a desktop file? The same scorecard exists as the Risk Mitigation KPI Dashboard in Excel. For a broader, register-flavoured view of risk in the same platform, see the Risk Management KPI Dashboard in Google Sheets and the analytics-style Risk Management Dashboard in Google Sheets – both are separate templates with their own metric lists, not versions of this one.
Neighbouring scorecards on the same engine: Compliance Audit KPI Dashboard in Google Sheets, Workplace Safety KPI Dashboard in Google Sheets and Operational Efficiency KPI Dashboard in Google Sheets. For control-level detail try the Audit & Internal Controls Dashboard in Google Sheets, and for the recovery side of risk, Business Continuity Dashboard in Google Sheets.
Browse the whole shelf: KPI Dashboards in Google Sheets and all Google Sheets templates.
Get the Risk Mitigation KPI Dashboard in Google Sheets today. Instant download, lifetime access, unlimited projects. Your download is a PDF containing the “Make a copy” link – one click and the sheet is in your Drive.
Watch the step-by-step video Demo:
Last updated: 26 August 2026.
































Reviews
There are no reviews yet.