



The Media & Entertainment KPI Dashboard in Excel is a powerful tool designed for media, entertainment, and broadcasting professionals to track, analyze, and optimize key performance indicators (KPIs) that are critical to the industry. Whether you’re managing a TV network, film production company, streaming service, or content creation agency, this dashboard provides an organized, real-time overview of your business’s performance.
With customizable features, visual charts, and real-time monitoring, this dashboard helps industry professionals make informed decisions, increase audience engagement, and improve overall operational efficiency. Track content performance, audience growth, revenue generation, and production efficiency all in one place.

Key Features of the Media & Entertainment KPI Dashboard in Excel:
📊 Comprehensive KPI Tracking
Track vital KPIs including audience reach, revenue, content views, user engagement, and production costs across various platforms and channels.
📈 Real-Time Performance Monitoring
Monitor the performance of your media content, advertising campaigns, and audience engagement metrics in real time, ensuring you’re always up-to-date.
📅 Month-to-Date (MTD) and Year-to-Date (YTD) Analysis
Analyze performance over different periods, comparing current data with historical performance, to identify trends and opportunities for growth.
🎯 Goal Setting and Performance Comparison
Set specific targets for each KPI and compare actual performance with your goals, ensuring that your media and entertainment efforts align with business objectives.
🛠 Customizable Inputs
Easily input data such as revenue, content views, production costs, and audience feedback, and customize the dashboard to meet your unique business needs.
🔔 Conditional Formatting Alerts
Get real-time alerts with color-coded indicators to quickly identify underperforming areas, such as low engagement or missed revenue targets.
🎬 Content and Audience Insights
Track the performance of your media content across multiple platforms, measure audience growth, and analyze engagement to make data-driven decisions about future content strategies.
🚀 Why You’ll Love the Media & Entertainment KPI Dashboard in Excel:
✅ Track Content Performance – Monitor how your content is performing across multiple platforms and audience segments.
✅ Increase Audience Engagement – Track audience interaction metrics, including comments, shares, and likes, to boost content relevance and viewer engagement.
✅ Optimize Revenue Generation – Monitor advertising revenue, subscriptions, and sponsorships to maximize profitability.
✅ Improve Production Efficiency – Track production costs and timelines to ensure that content production stays on budget and on schedule.
✅ User-Friendly Interface – The dashboard is easy to navigate and provides real-time insights without requiring technical expertise.
✅ Fully Customizable – Tailor the dashboard to track specific KPIs that matter most to your media or entertainment business.
What’s Inside the Media & Entertainment KPI Dashboard in Excel:
- Audience Reach KPI: Track total audience reach, segmented by platform (TV, social media, streaming services, etc.).
- Content Views KPI: Monitor the number of views for each piece of content, whether it’s a video, article, or social media post.
- User Engagement KPI: Measure audience engagement metrics, such as likes, comments, shares, and watch time.
- Revenue KPI: Track income generated from advertising, subscriptions, merchandise, or sponsorship deals.
- Production Efficiency KPI: Measure production timelines, costs, and resource allocation to ensure that your projects stay within budget and deadlines.
- Content ROI KPI: Track the return on investment for content produced, comparing production costs to revenue generated.
How to Use the Media & Entertainment KPI Dashboard in Excel:
1️⃣ Download the Template – Access the Excel dashboard instantly upon purchase.
2️⃣ Input Your Data – Enter content performance data, revenue details, and engagement metrics into the pre-designed fields.
3️⃣ Set Targets – Define specific KPIs for audience reach, engagement, and revenue generation to align with your business goals.
4️⃣ Monitor Performance – Track content performance in real-time and make adjustments based on audience insights and business needs.
5️⃣ Generate Reports – Use the dashboard to create detailed reports for internal reviews, client presentations, or stakeholder meetings.
Who Can Benefit from the Media & Entertainment KPI Dashboard in Excel:
- Media Companies
- TV Networks
- Film and Video Production Companies
- Digital Streaming Platforms
- Content Creators
- Marketing Teams
- Advertising Agencies
- Business Owners in the Entertainment Industry
The Media & Entertainment KPI Dashboard in Excel is the ideal tool for any media business looking to streamline operations, optimize content performance, and improve profitability.
Click here to read the Detailed blog post
https://www.pk-anexcelexpert.com/media-entertainment-kpi-dashboard/
Visit our YouTube channel to learn step-by-step video tutorials
Youtube.com/@PKAnExcelExpert
Compatibility and Requirements
- Works in Microsoft Excel desktop (Excel 2016 or later, or Microsoft 365).
- Color-coded conditional formatting and charts are built into the workbook.
- New to Excel charts? Microsoft explains the basics in Create a chart from start to finish.
Frequently Asked Questions
Which KPIs does the Media & Entertainment KPI Dashboard track?
Audience reach, content views, user engagement, revenue, production efficiency and content ROI.
Can I set targets?
Yes. You set a target for each KPI and the dashboard compares actual results with it.
Does it show MTD and YTD figures?
Yes. It analyzes Month-to-Date and Year-to-Date performance and compares it with past results.
How are weak areas flagged?
Conditional formatting adds color-coded indicators, so low engagement or missed revenue targets stand out.
Is it available for Power BI or Google Sheets?
Yes. See the Media & Entertainment KPI Dashboard in Power BI and the Google Sheets version.
Related Media and Entertainment Templates
- Media & Entertainment KPI Dashboard in Power BI: the same KPIs in Power BI
- Media & Entertainment KPI Dashboard in Google Sheets: a shared online version
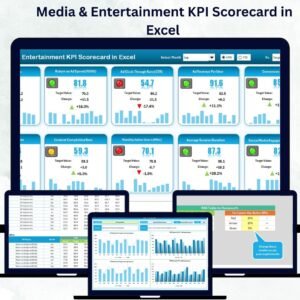
- Media & Entertainment KPI Scorecard in Excel: a scorecard view of the same targets
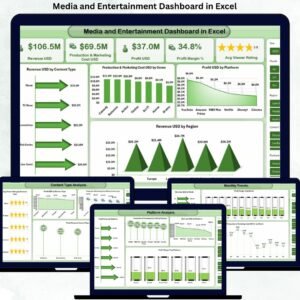
- Media and Entertainment Dashboard in Excel: a data dashboard with charts and filters
- KPI Dashboard Library (Excel): 15 Excel KPI dashboards in one bundle
Browse all Excel KPI dashboards or the Excel dashboards.






























Reviews
There are no reviews yet.