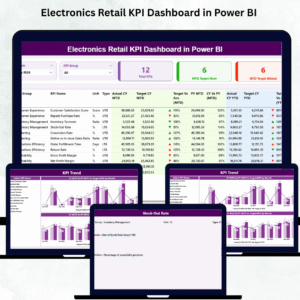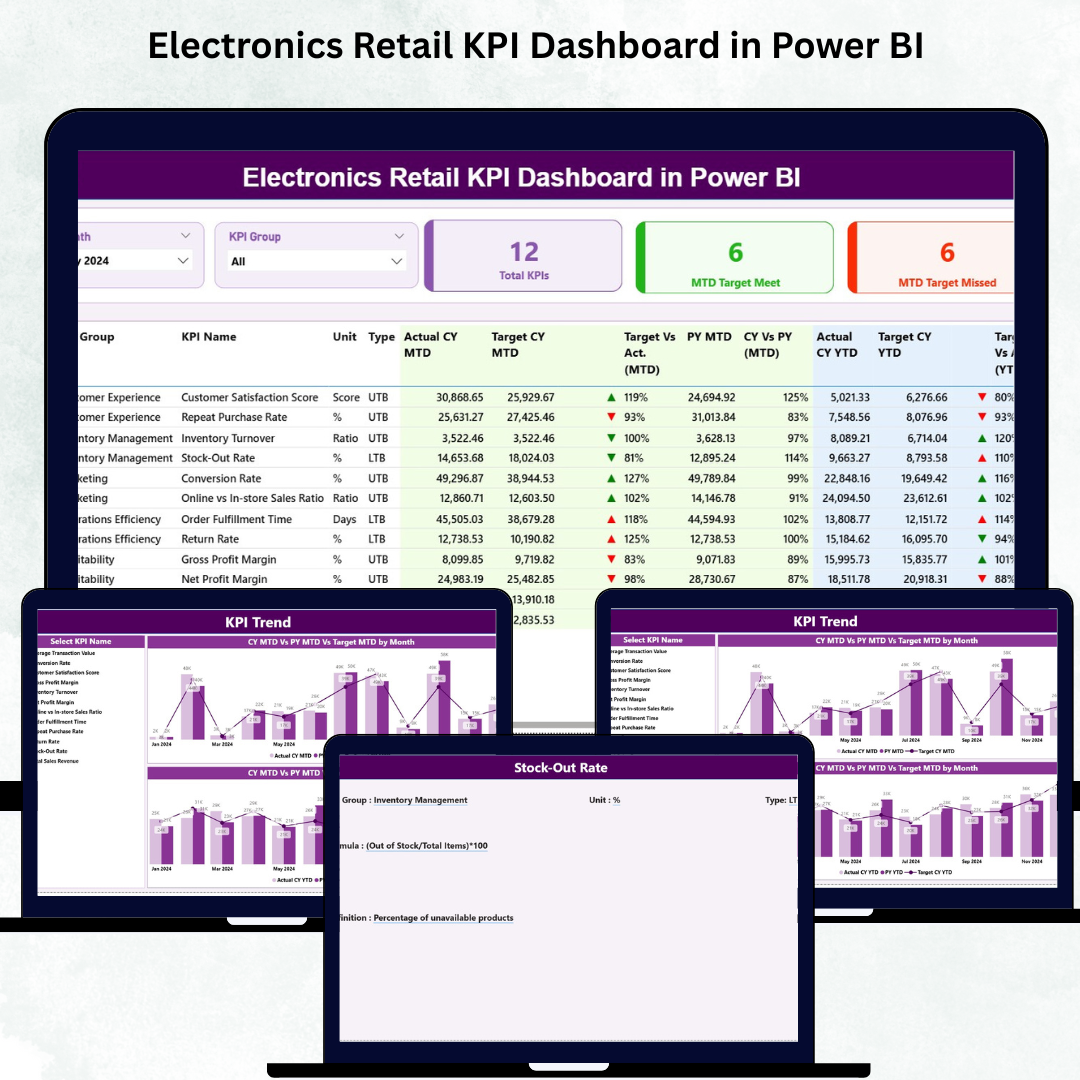
The electronics retail industry moves fast — new launches, fluctuating prices, competitor promotions, return challenges, and customer behavior shifts all happen daily. In such a dynamic environment, retailers must analyze performance quickly and take decisions confidently. That’s exactly why the Electronics Retail KPI Dashboard in Power BI was created. It gives you a complete view of sales, customer experience, store efficiency, and operational performance — all in one interactive, visual, and intelligent dashboard.
This ready-to-use dashboard transforms raw Excel data into meaningful insights. Whether you want to track category-wise sales, reduce return rates, monitor store performance, or measure customer satisfaction, this dashboard makes everything simple, clear, and fast. With slicers, charts, icons, drill-through insights, and automated calculations, your decision-making becomes stronger than ever.
⭐ Key Features of the Electronics Retail KPI Dashboard in Power BI
✨ Interactive Summary Page – View all KPIs in one place
📊 MTD & YTD Analysis – Track current month & yearly progress
📈 Trend Charts – Compare CY, PY & Target values
🎯 Target vs Actual Insights – Identify KPIs met & KPIs missed
🔍 KPI Drill-Through Page – Understand KPI formula, logic & definition
⚡ Auto Refresh with Excel – Update data → Refresh → Dashboard updated
🏬 Category, Store & Customer Insights – Make smarter retail decisions
✔️ Beginner-Friendly Structure – No coding, no complex setup
This dashboard is ideal for any retailer who wants accuracy, speed, and clarity in performance reporting.
📦 What’s Inside the Electronics Retail KPI Dashboard in Power BI
This dashboard includes three professionally designed analytical pages, each serving a unique purpose.
🔹 1. Summary Page – Your Main Control Center
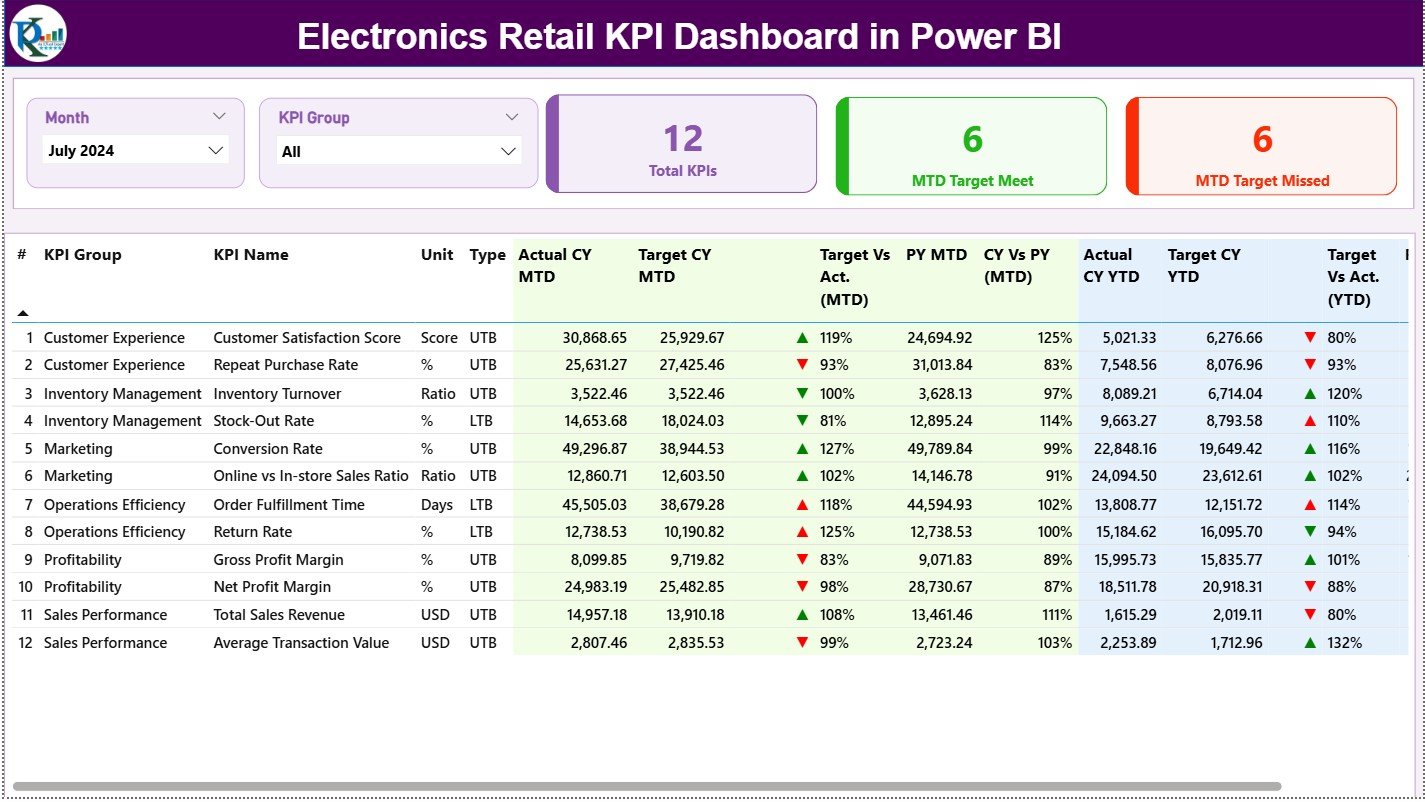
The Summary Page is the heart of the dashboard. It gives you a complete snapshot of your electronics retail performance.
At the top, two slicers allow instant filtering:
Month Slicer
KPI Group Slicer
Switch between groups like Sales KPIs, Customer KPIs, Service KPIs, Store KPIs, and Operations KPIs.
Below these slicers, three smart KPI cards display:
Total KPIs Count
MTD Target Met
MTD Target Missed
This instantly shows whether the business is moving in the right direction.
The detailed KPI performance table gives everything you need:
KPI Number, Group, Name
Unit of measurement
Type: UTB or LTB
Actual CY MTD, Target CY MTD, MTD Icons
Target vs Actual (MTD) %
PY MTD & CY vs PY (MTD) %
Actual CY YTD, Target CY YTD
YTD Icons, YTD Achievement %
PY YTD & CY vs PY (YTD) %
This page becomes your daily performance dashboard for decision-making.
🔹 2. KPI Trend Page – Deep Performance Insights
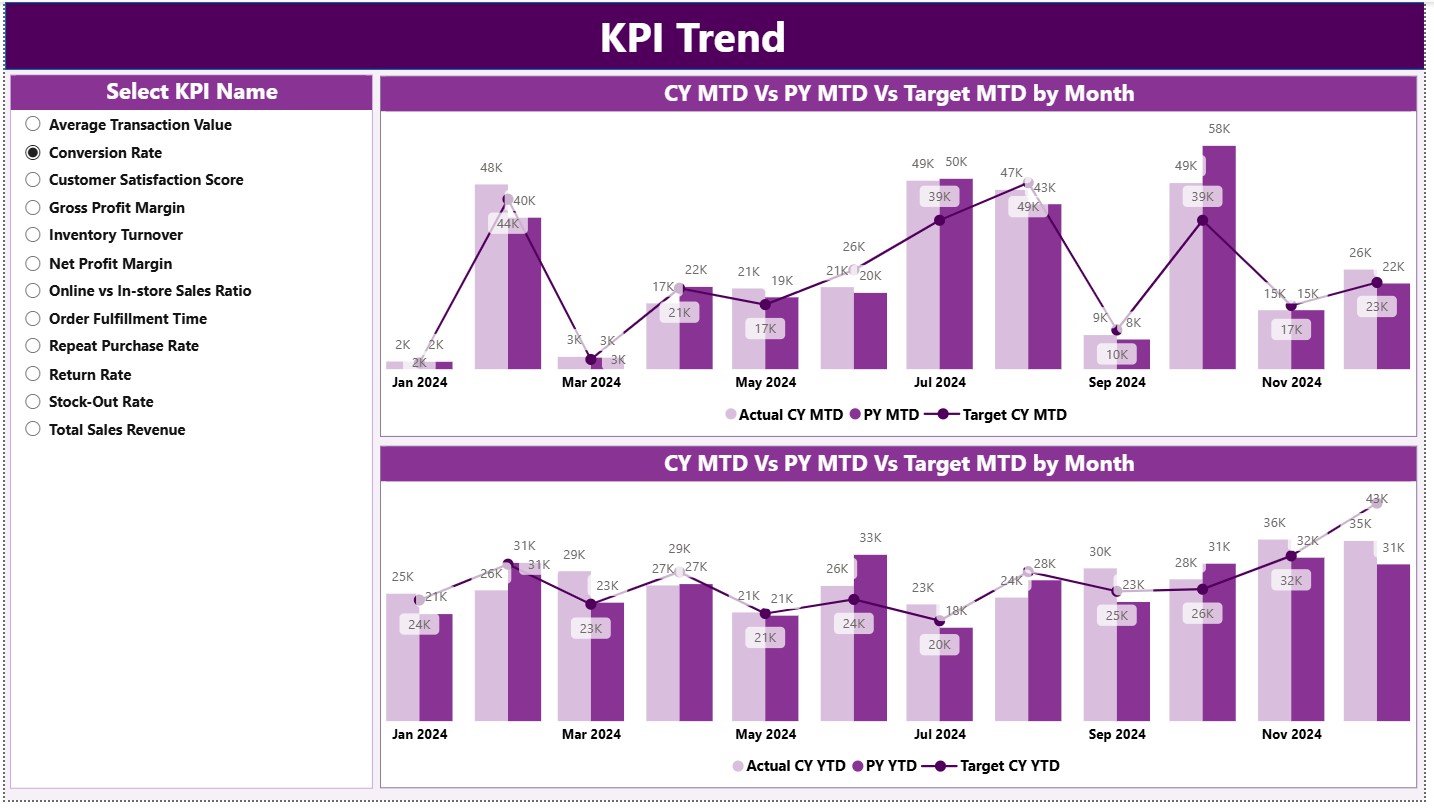
The KPI Trend Page allows you to study performance patterns clearly.
Select any KPI using the slicer on the left and instantly view:
📈 MTD Trend Chart
– CY MTD
– PY MTD
– Target MTD
📉 YTD Trend Chart
– CY YTD
– PY YTD
– Target YTD
Use this page to understand seasonal behavior, forecast future sales, analyze customer trends, and plan inventory better.
🔹 3. KPI Definition Page – Complete KPI Documentation
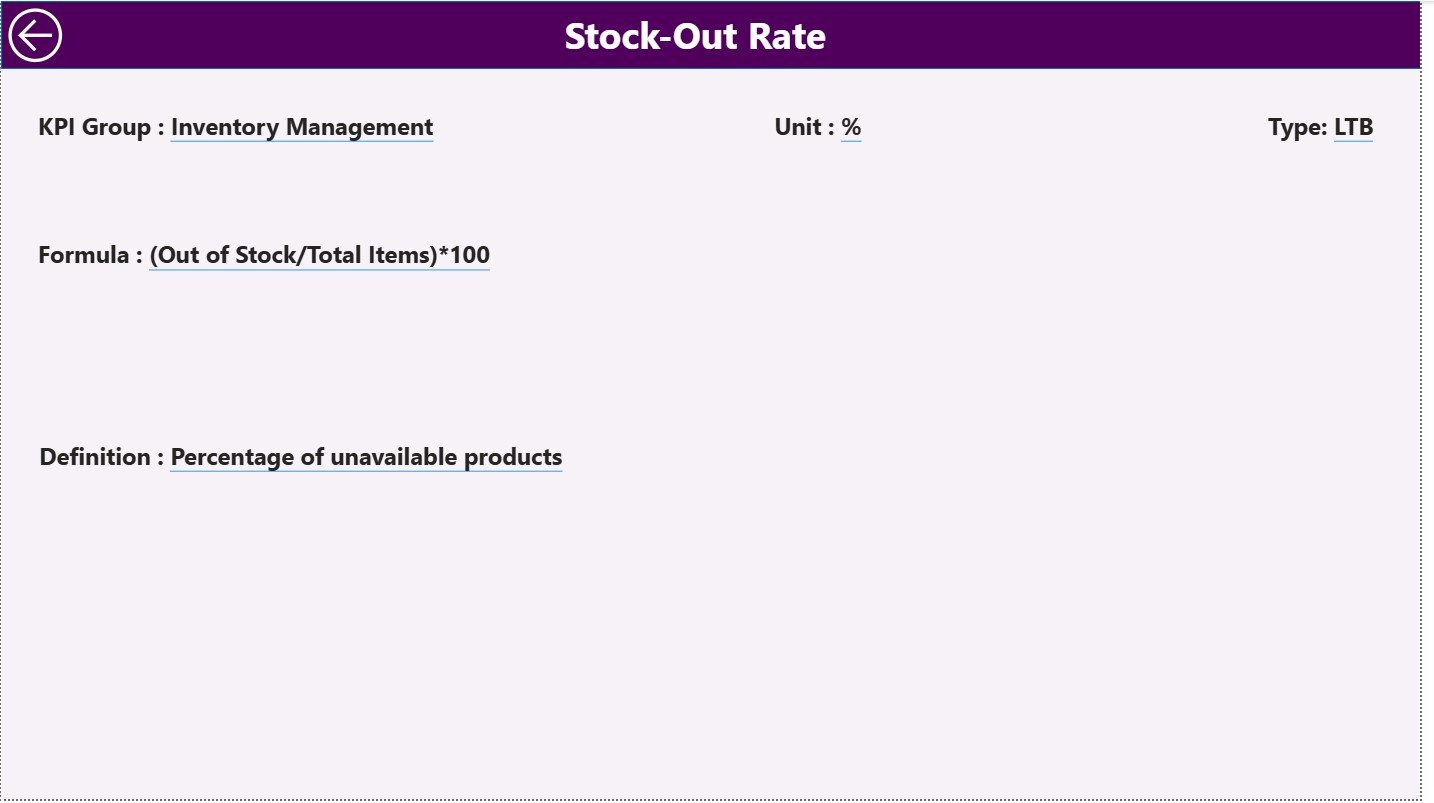
This drill-through page helps users understand KPI logic.
It contains:
KPI Number
KPI Group
KPI Name
Unit
Formula
KPI Definition
KPI Type (UTB/LTB)
Ideal for reporting, presentations, audits, and team training.
Click the “Back” button to return to the main page.
🛠️ How to Use the Electronics Retail KPI Dashboard
The dashboard runs entirely on Excel + Power BI. Just follow these steps:
Update the Input_Actual Sheet (MTD & YTD values).
Update the Input_Target Sheet (MTD & YTD targets).
Update the KPI Definition Sheet when adding new KPIs.
Open Power BI Desktop.
Click Refresh.
View updated insights instantly.
Use slicers to analyze by month or KPI group.
Drill through a KPI to view its definition.
No coding, no heavy BI setup — simple and fast.
👥 Who Can Benefit from This Dashboard?
🛒 Electronics Retail Chains – Multi-store, multi-category analysis
🏬 Store Managers – Daily dashboard for improvements
📊 Retail Analysts – Trend, forecasting & performance insights
📦 Category Managers – Track category contribution & performance gaps
⭐ Customer Experience Teams – Monitor satisfaction & return rates
💰 Business Owners – Quick visibility of performance health
🔍 Consultants – Deliver professional retail analytics to clients