Eco resorts face a unique challenge. They must deliver unforgettable guest experiences while protecting nature, controlling costs, and achieving sustainability goals. However, tracking all these objectives using traditional reports or scattered spreadsheets often leads to confusion, delays, and missed insights.
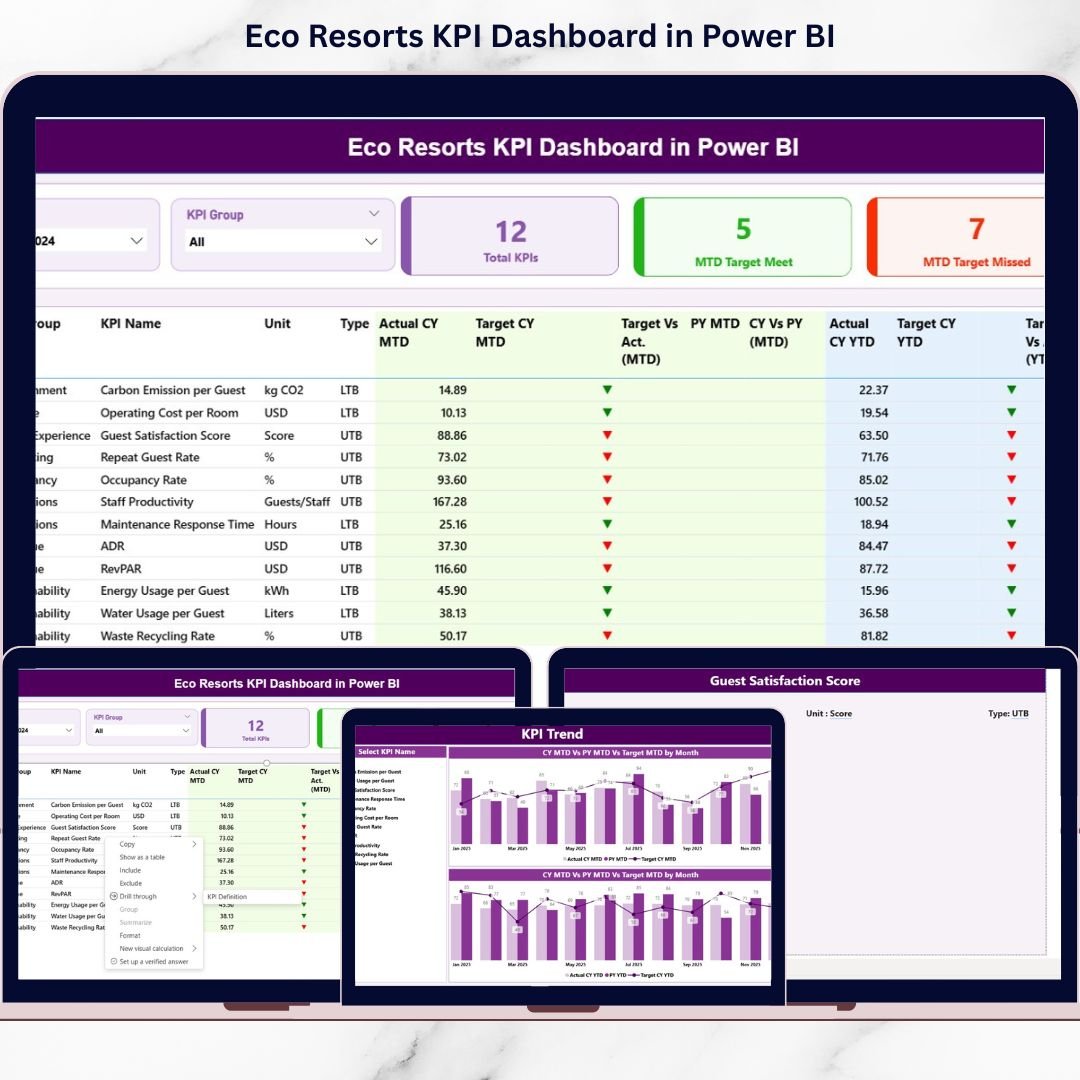
That is exactly why the Eco Resorts KPI Dashboard in Power BI is a powerful, must-have analytics solution for modern eco resorts 🌱📊.
This professionally designed, ready-to-use Power BI dashboard helps eco resort owners, managers, and sustainability teams track operational, financial, and environmental KPIs in one centralized view. Instead of spending hours on manual reporting, you instantly see where performance stands, what needs attention, and how trends are evolving.
Because the dashboard combines Excel simplicity with Power BI intelligence, even non-technical users can maintain, update, and analyze KPIs confidently. As a result, decision-making becomes faster, clearer, and more sustainable.
🔑 Key Features of Eco Resorts KPI Dashboard in Power BI
✅ Centralized KPI Monitoring – Track operational, financial, and sustainability KPIs in one interactive dashboard
✅ MTD & YTD Performance Tracking – Instantly analyze Month-to-Date and Year-to-Date results
✅ Target vs Actual Analysis – Identify target met and target missed KPIs at a glance
✅ Previous Year Comparison – Compare current performance with last year to measure improvement
✅ Visual KPI Status Indicators – Green ▲ and Red ▼ icons make performance interpretation easy
✅ Interactive Slicers – Filter by Month and KPI Group for focused analysis
✅ Trend Analysis Charts – Understand KPI movement over time using MTD and YTD trends
✅ Drill-Through KPI Definitions – Avoid confusion with clear KPI formulas and definitions

📦 What’s Inside the Eco Resorts KPI Dashboard in Power BI
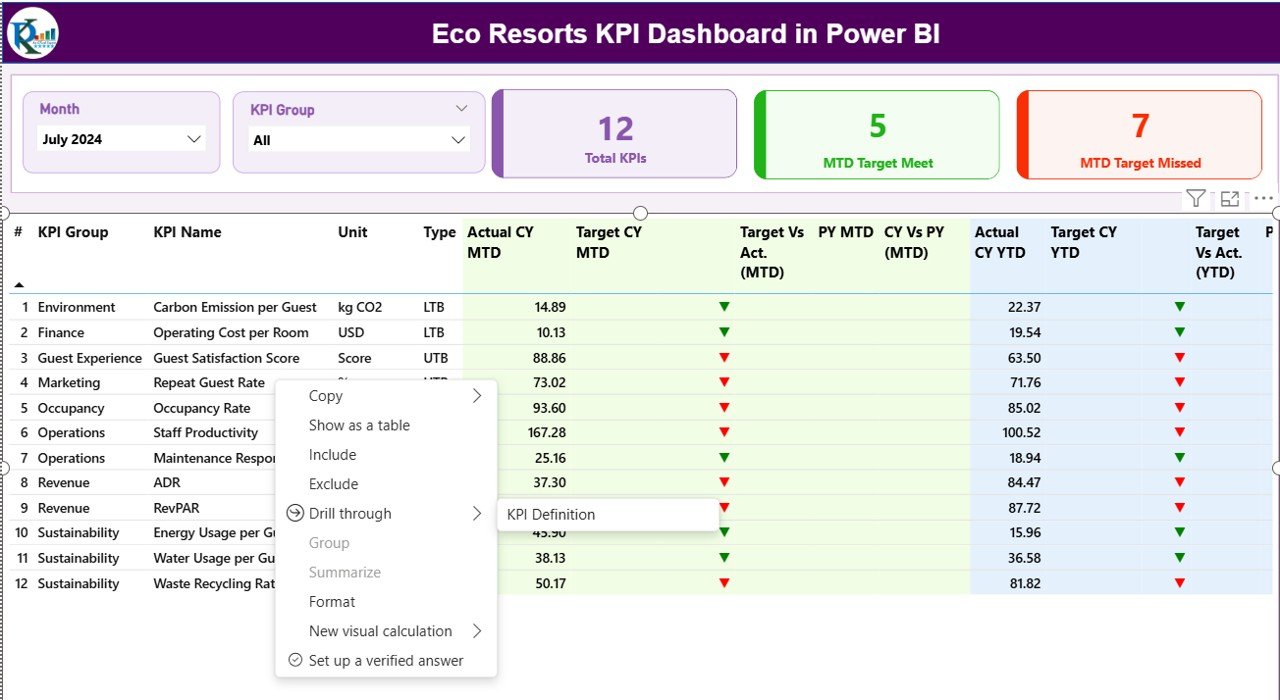
📊 Summary Page
This is the main control panel of the dashboard. It displays KPI cards for total KPIs, MTD target met, and MTD target missed. A detailed KPI table shows MTD, YTD, target, actual, and previous year comparisons.
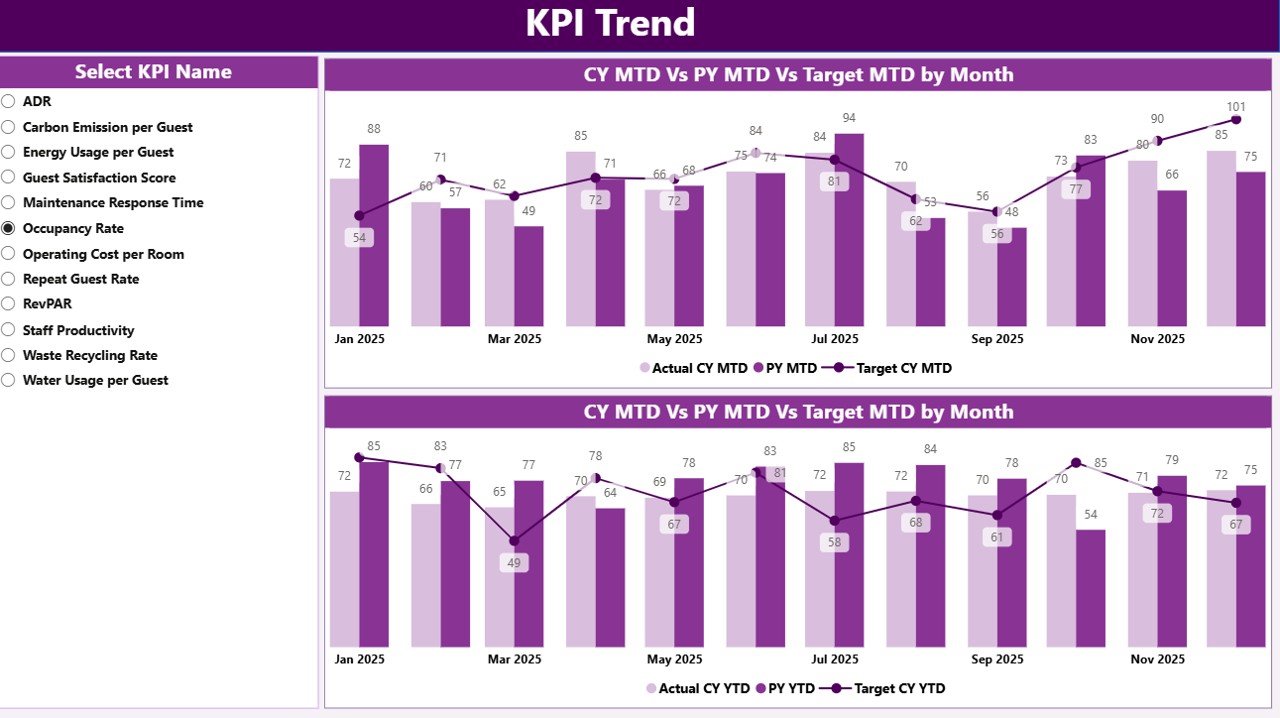
📈 KPI Trend Page
This page helps you analyze performance trends over time. Select any KPI and instantly view MTD and YTD trend charts comparing Actual, Target, and Previous Year values.
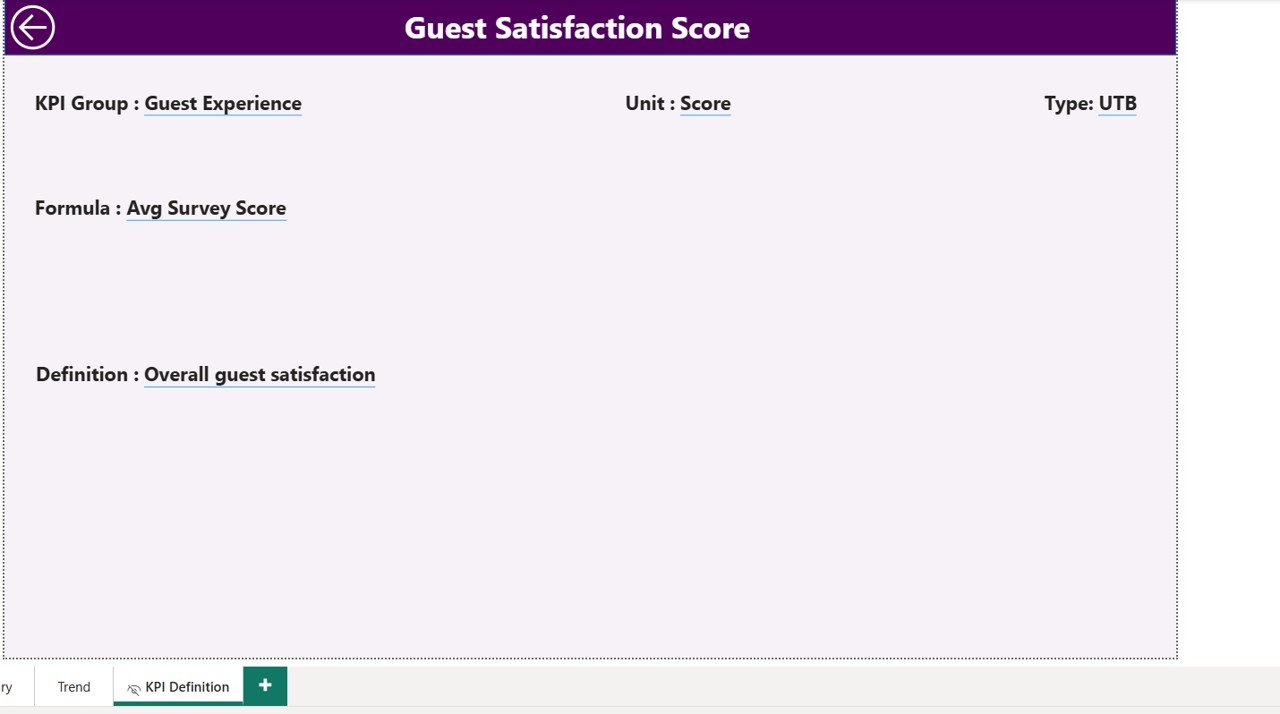
📘 KPI Definition Page (Drill-Through)
This hidden but powerful page explains each KPI clearly. It includes KPI group, unit, formula, definition, and KPI type (LTB or UTB), ensuring complete transparency.
📁 Excel Data Source File
The dashboard connects to a structured Excel file with:
-
Input_Actual sheet for actual KPI values
-
Input_Target sheet for target KPI values
-
KPI Definition sheet for master data
🛠️ How to Use the Eco Resorts KPI Dashboard in Power BI
1️⃣ Enter actual KPI data in the Input_Actual Excel sheet
2️⃣ Enter target KPI values in the Input_Target Excel sheet
3️⃣ Maintain KPI details in the KPI Definition sheet
4️⃣ Refresh the Power BI dashboard
5️⃣ Instantly view updated KPIs, trends, and comparisons
No advanced Power BI skills are required. This makes the dashboard perfect for daily, weekly, and monthly performance reviews.
👥 Who Can Benefit from This Eco Resorts KPI Dashboard in Power BI
🏨 Eco Resort Owners & General Managers
🌿 Sustainability & Environmental Teams
📊 Operations & Finance Managers
📈 Business Analysts & Strategy Teams
🧾 Reporting & MIS Teams
🌍 Resorts focusing on sustainable growth
If your eco resort wants clarity, control, and sustainability-driven insights, this dashboard is built for you.
Click here to read the Detailed blog post
Watch the step-by-step video tutorial:


