


In the high-risk environment of construction, safety isn’t optional—it’s essential. When managing crews, deadlines, and site hazards, you need a reliable system to track safety KPIs with precision and ease. That’s where our Construction Safety KPI Dashboard in Google Sheets comes in.
This fully automated, ready-to-use dashboard empowers construction managers, site supervisors, and safety officers to monitor vital metrics like accident rates, training completions, and inspection outcomes—all in one centralized Google Sheets workspace. Whether you’re overseeing one site or multiple projects, this tool gives you real-time visibility into your safety performance.
Say goodbye to scattered spreadsheets and hello to data-driven decision-making that protects your team and your business.

✨ Key Features of Construction Safety KPI Dashboard
-
📊 All-in-One Dashboard View – See MTD & YTD actuals vs. targets, plus previous year comparisons
-
🚦 Conditional Formatting with Visual Cues – Up/down arrows show how your KPIs are trending
-
📈 KPI Trend Sheet – Track progress over time with detailed performance analytics
-
📋 KPI Definition Sheet – Clear definitions, formulas, and units for full transparency
-
🧠 Smart Data Entry Tabs – Enter actuals, targets, and PY data in dedicated sheets
-
🛠️ Customizable for Any Site – Tailor metrics to match your specific safety goals
-
☁️ Google Sheets Based – Access from anywhere—ideal for multi-site teams
-
🔁 Auto-Updates – Dashboard refreshes automatically with each data entry
-
📎 Compliance-Ready Reporting – Present your safety KPIs to stakeholders with confidence
📦 What’s Inside the Construction Safety KPI Dashboard
This template includes 6 interactive worksheets to help you track construction safety performance with accuracy:
-
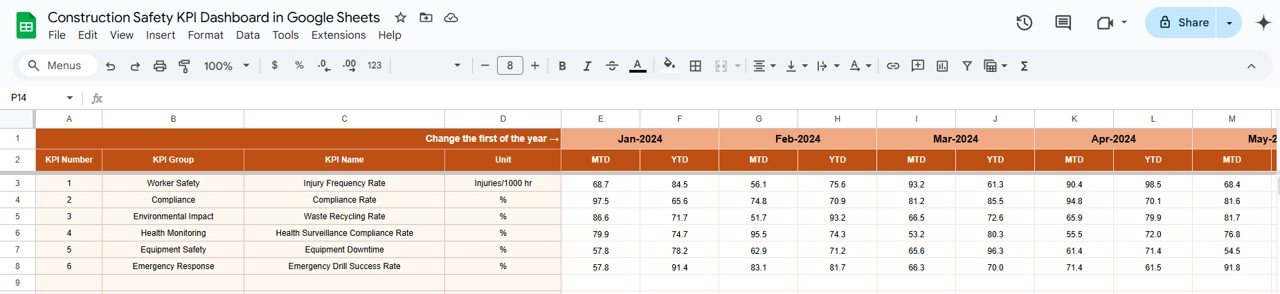
Dashboard Sheet Tab
-
Displays a comprehensive view of safety KPIs using conditional formatting, visual charts, and YTD/MTD data comparisons.
-
-
KPI Trend Sheet Tab
-
Select a KPI from the dropdown and analyze its trend over time. It includes KPI Group, Unit, Type, Formula, and Definition for clarity.
-
-
Actual Number Sheet Tab
-
Input actual performance values for each month. These numbers automatically update the dashboard in real-time.
-
-
Target Sheet Tab
-
Set your monthly and yearly safety targets to benchmark performance and stay aligned with your safety goals.
-
-
Previous Year Number Sheet Tab
-
Input last year’s KPI data to compare performance across years and assess safety improvement.
-
-
KPI Definition Sheet Tab
-
Contains all safety KPIs with their names, units, formulas, and purpose, ensuring that your entire team is on the same page.
-
👷♂️ How to Use the Construction Safety KPI Dashboard
📍 Step 1: Input actual data in the “Actual Number” sheet
📍 Step 2: Set monthly and yearly goals in the “Target” sheet
📍 Step 3: Add prior year metrics in the “Previous Year” sheet for comparison
📍 Step 4: Visit the “Dashboard Sheet” to visualize performance instantly
📍 Step 5: Use the “KPI Trend Sheet” to monitor trends and adjust safety protocols
It’s easy to use, fully customizable, and requires zero advanced spreadsheet skills.
👷♀️ Who Can Benefit from This Safety Dashboard?
-
Construction Site Managers – Track safety inspections, incidents, and training progress
-
HSE Officers – Monitor compliance and measure improvements in injury rates
-
Project Supervisors – Stay informed on near-miss and safety audit results
-
Contractors & Subcontractors – Report safety performance to clients and agencies
-
Corporate Safety Teams – Standardize metrics across multiple construction sites
-
Training Coordinators – Ensure timely completion of mandatory safety courses
Whether you’re in residential, commercial, or industrial construction, this tool gives your team the safety intelligence they need to act fast and stay compliant.
🔗 Click here to read the Detailed blog post
Watch the step-by-step video Demo:


Reviews
There are no reviews yet.