

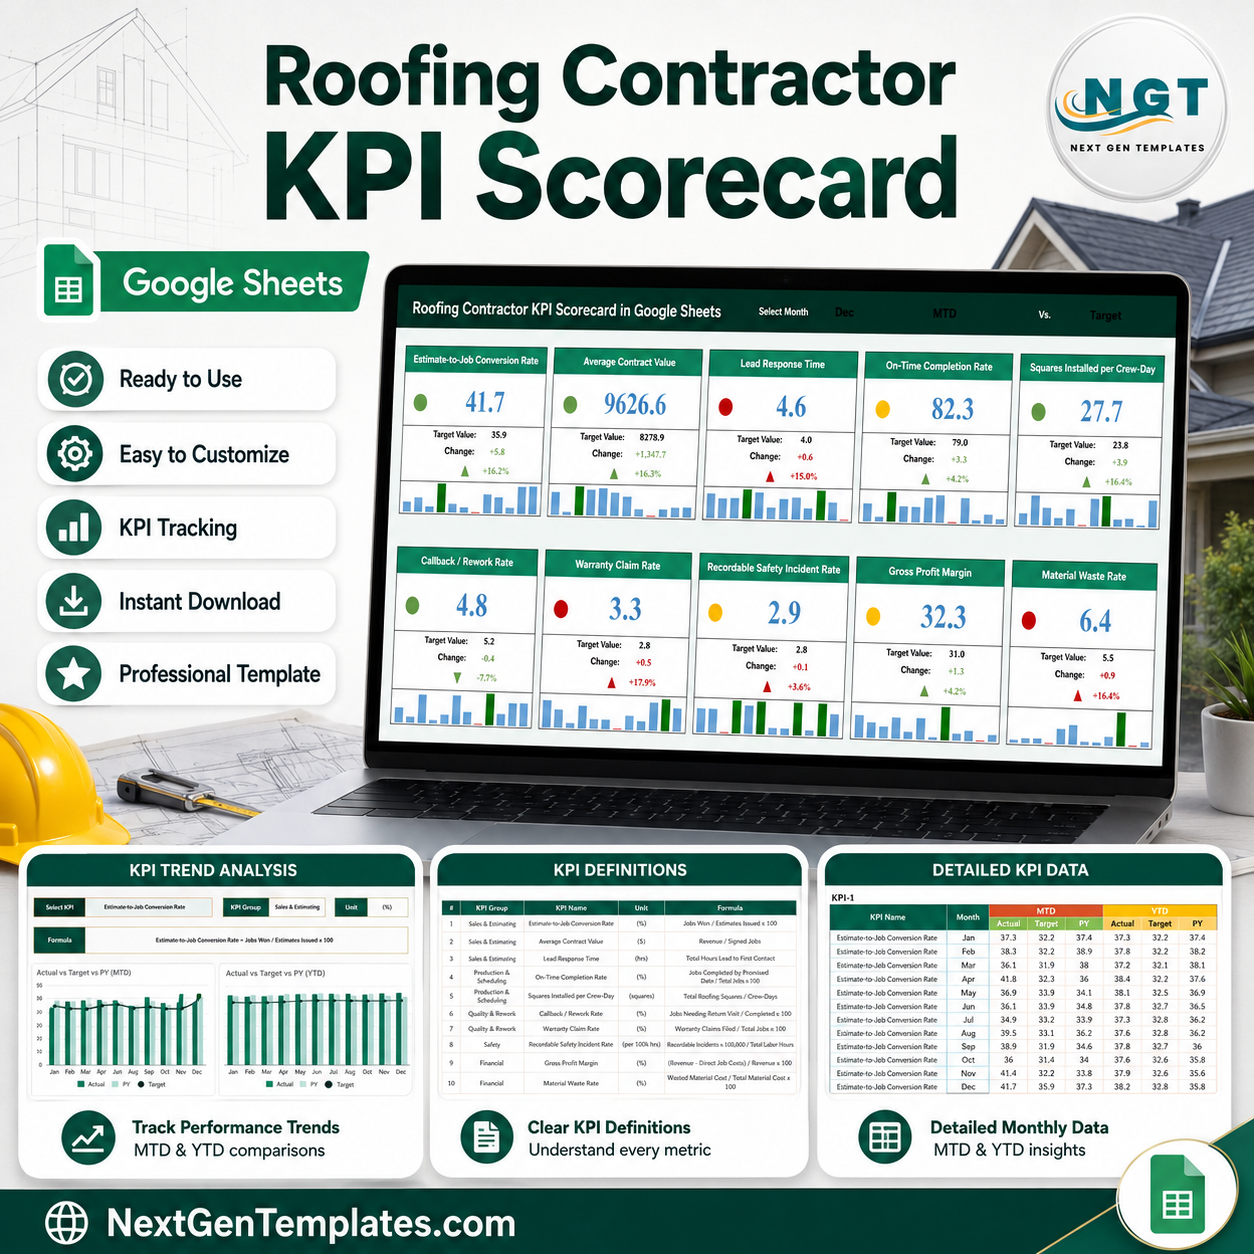

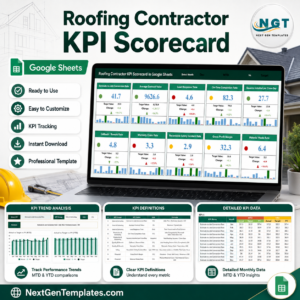
The Roofing Contractor KPI Scorecard in Google Sheets puts 10 roofing KPIs on one traffic-light page: estimate-to-job conversion, average contract value, lead response time, on-time completion, squares installed per crew-day, callback/rework rate, warranty claim rate, recordable safety incident rate, gross profit margin and material waste rate. Pick a month from the dropdown and all ten cards recalculate – value, target, change, percentage move and a 12-month mini bar chart. Four sheets, 120 rows of editable sample data (10 KPIs x 12 months), no add-ons and no subscription. Instant download, lifetime access and free bug fixes. If the file does not open, email us and we will fix it or refund you.
Key Features of the Roofing Contractor KPI Scorecard in Google Sheets
- 10 roofing-specific KPIs grouped into Sales & Estimating, Production & Scheduling, Quality & Rework, Safety and Financial – so estimating, crews, callbacks and margin are read side by side instead of in five different places.
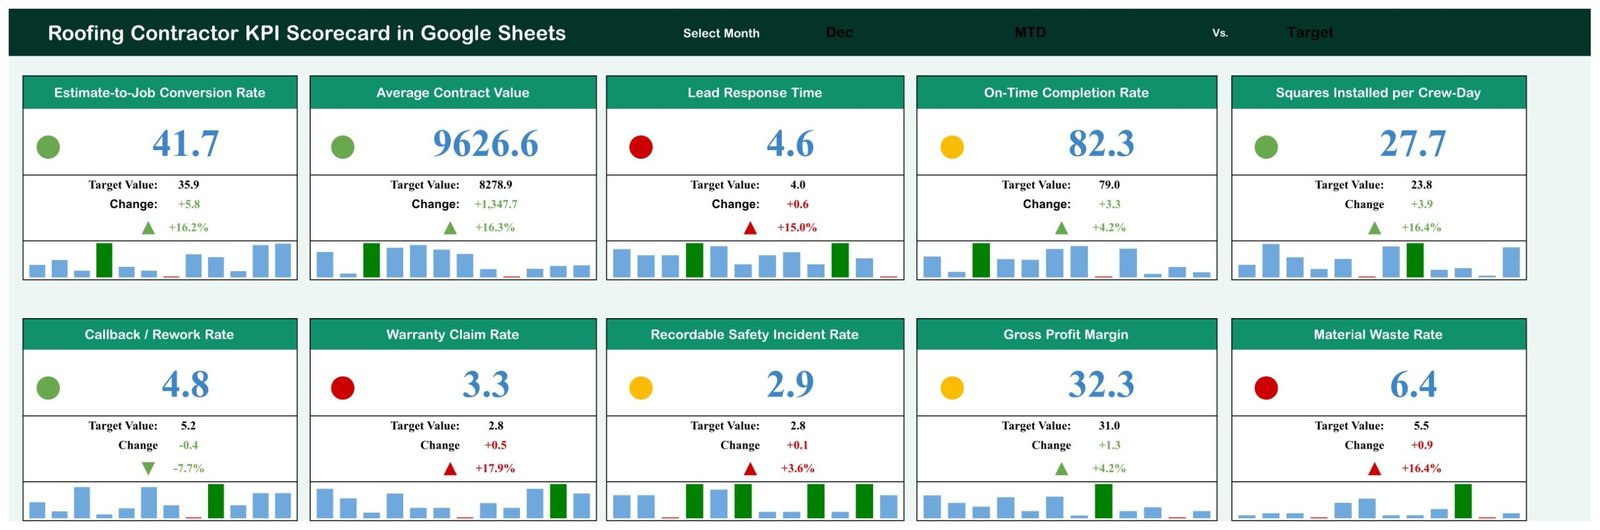
- One-click month picker. The banner carries a Select Month dropdown. Choose Dec and every card, arrow and sparkline redraws for December.
- MTD / YTD switch and a Vs. Target / Vs. PY switch in the same banner, so the identical ten cards answer “how was this month against target” and “how is the year against last year” without rebuilding anything.
- Red / amber / green scoring on every card, driven by that month’s own target rather than a fixed threshold.
- Direction-aware maths. Each KPI is tagged UTB (up-the-better) or LTB (lower-the-better), so a fall in Callback / Rework Rate scores green while a rise in Material Waste Rate scores red.
- Target, absolute change and % move printed under every value with an up or down arrow – the December sample shows conversion at 41.7% against a 35.9% target, +5.8 points, +16.2%.
- 12-month mini bar chart inside each card, with the selected month highlighted, so a single good month is never mistaken for a trend.
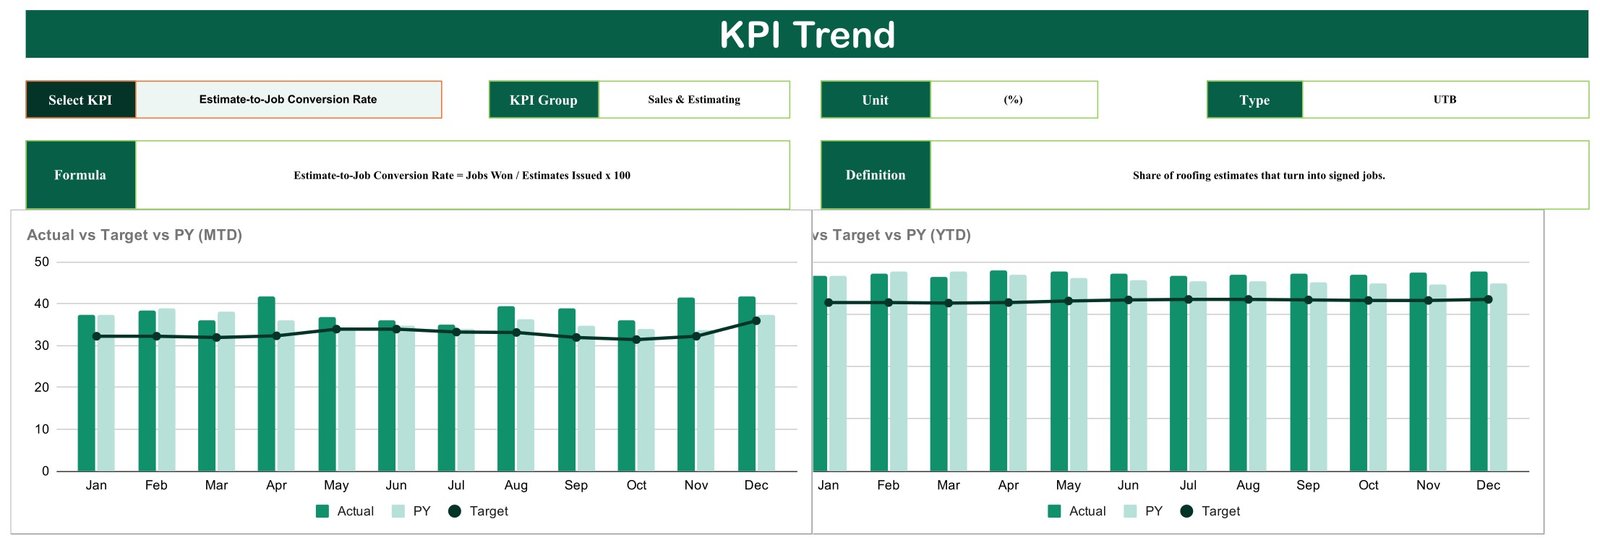
- KPI Trend sheet with its own KPI picker and two 12-month charts: Actual vs Target vs PY (MTD) and Actual vs Target vs PY (YTD).
- Every formula documented – the KPI Analysis sheet lists group, unit, formula, plain-English definition and UTB/LTB type for all ten metrics.
- Plain Google Sheets. No scripts to authorise, no add-ons to install, no monthly fee. It opens in a browser on any laptop or phone.
What’s Inside the Roofing Contractor KPI Scorecard in Google Sheets
Sheet 1 – KPI Scorecard. The one-page management view. Ten cards across two rows, each with a coloured status dot, the headline number, the target value, the change, the percentage move and a 12-bar history strip. The banner holds the month picker and the two comparison switches.
Sheet 2 – KPI Trend. Choose any of the ten KPIs and the sheet fills in its group, unit, type, formula and definition, then draws Actual vs Target vs PY twice – once month-to-date, once year-to-date – across Jan to Dec.
Sheet 3 – KPI Analysis. The definition register. One row per KPI with number, KPI group, name, unit, the exact formula (for example Squares Installed per Crew-Day = Total Roofing Squares Installed / Total Crew-Days Worked), a one-line definition and the UTB/LTB flag. This is the sheet that stops two people arguing about what “on-time” means.
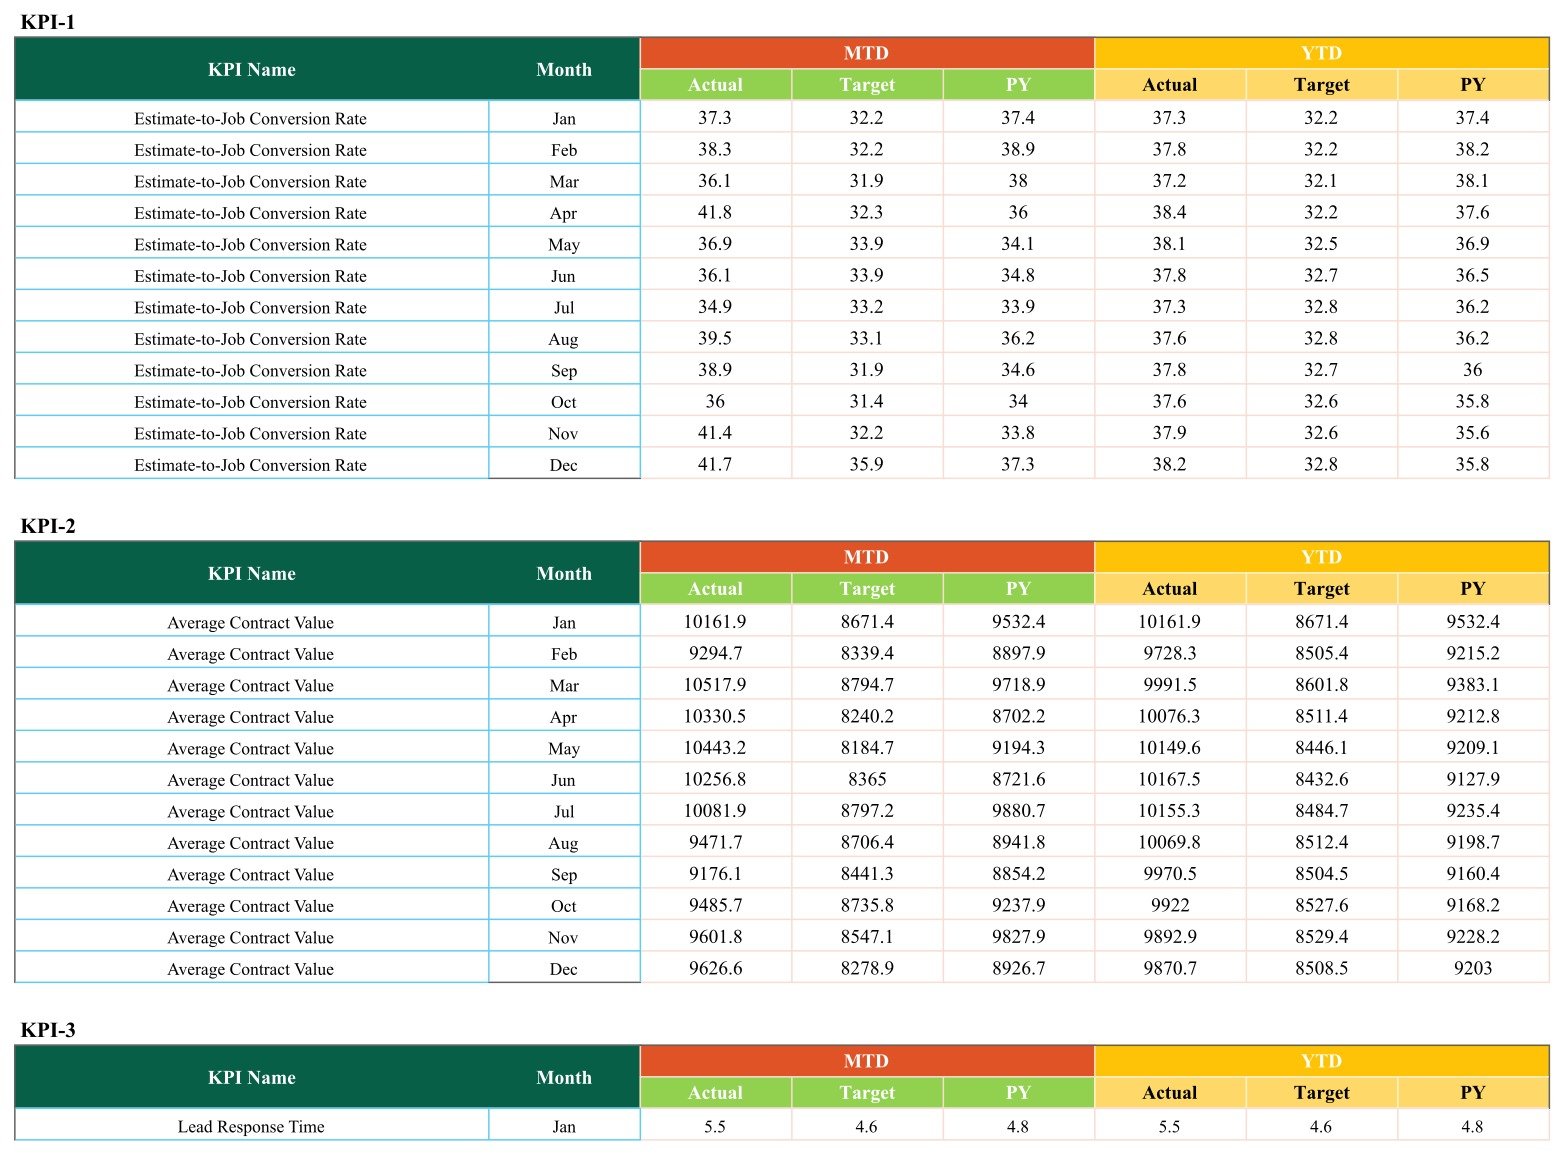
Sheet 4 – Data. The single place you type. Ten blocks – KPI-1 to KPI-10 – each holding twelve months of MTD Actual, Target and PY plus YTD Actual, Target and PY. Overtype the sample figures with your own and the first three sheets follow.

Roofing Contractor KPI Scorecard in Google Sheets vs. Excel vs. Paid Roofing Software – Where This Fits
| This Google Sheets scorecard | An Excel KPI workbook | Paid roofing / field-service software | |
|---|---|---|---|
| Cost | One payment, no renewal | One payment, needs Excel | Typically a per-user monthly fee |
| Platform | Browser, any OS | Excel desktop preferred | Web plus mobile app |
| Setup time | Copy the sheet, type your numbers – under an hour | Similar, once Excel is installed | Onboarding, data migration, training |
| Real-time team collaboration | Yes, native to Google Sheets | Only via OneDrive co-authoring | Yes |
| Mobile access | Google Sheets app | Excel mobile, layout permitting | Purpose-built app |
| Customisable fields | Rename or replace any of the 10 KPIs | Same | Usually limited to vendor fields |
| Share with link | Yes, view or edit | Needs a cloud folder | Yes, inside licensed seats |
| Year-1 cost at 5 users | The one-off price on this page | The one-off price plus Office licences | Often four figures |
| Job costing and invoicing | No – this is a measurement layer | No | Yes |
| Where the numbers come from | You type or paste them into the Data sheet | Same | Captured by the system itself |
Who This Template Is For – and Who It’s Not For
A good fit for: residential and commercial roofing companies running 2-20 crews; owner-operators who want one monthly page instead of a stack of job reports; estimators and sales managers tracking conversion and lead response; production managers watching squares per crew-day and on-time completion; and anyone preparing a monthly review for a partner, lender or franchise office.
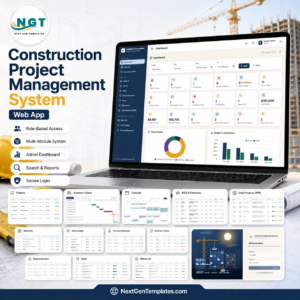
Not a good fit if you need job-level costing, invoicing, scheduling, crew dispatch or material ordering – this is a measurement layer, not an operations system. It does not connect to accounting, CRM or field-service software, it does not import data on its own, and it does not send alerts. Someone has to enter the monthly figures. If you want a full job-management system instead, look at the Construction Project Management System Web App.
How to Use the Roofing Contractor KPI Scorecard in Google Sheets
- Open the PDF in your download and click the “Make a copy” link. Google Drive creates your own editable copy – the original is never touched.
- Read the KPI Analysis sheet first. Ten formulas, ten definitions. Agree them with your estimator and production manager before anyone types a number.
- Go to the Data sheet and replace the sample figures. Work block by block: KPI-1 is Estimate-to-Job Conversion Rate, KPI-10 is Material Waste Rate. Each block wants MTD Actual, Target and PY, and the YTD equivalents.
- Set your targets honestly. The scorecard colours cards against the target in that row, so a target nobody believes turns the whole page green and teaches you nothing.
- Open the KPI Scorecard sheet and pick the month. Read the reds first, then the ambers.
- Use the KPI Trend sheet for anything red two months running – the MTD and YTD charts show whether it is a blip or a slide.
- Share the link view-only with anyone who should read the numbers but not edit them.
Real-World Use Cases
Marcus, owner of a 12-crew residential roofing company. He kept a monthly numbers meeting but every manager brought their own spreadsheet. He now enters the ten figures on the Data sheet the first Monday of each month and projects the scorecard on the wall. December’s page showed Lead Response Time red at 4.6 hours against a 4.0 target, which changed the meeting agenda in about ten seconds.
Dana, an estimator at a commercial roofing firm. She only cares about the Sales & Estimating block. The KPI Trend sheet lets her flick between Estimate-to-Job Conversion Rate and Average Contract Value and see both against last year, so she can show that a lower conversion rate came with a higher average contract value rather than a worse quarter.
Ray, production manager for a storm-restoration crew. He watches Squares Installed per Crew-Day and On-Time Completion Rate together, and pairs them with the Roof Inspection Checklist in Google Sheets so a fast month is not paid for with a callback three months later.
Frequently Asked Questions
Is this the KPI Scorecard or the KPI Dashboard product?
This is the KPI Scorecard. It is a one-page card layout with traffic lights, a month picker, a KPI Trend sheet and a KPI Analysis sheet, fed by a single monthly Data sheet. Our analytical dashboards are a different product line with charts, slicers and transaction-level data. Buying one does not duplicate the other.
Does it connect to my accounting or roofing software?
No. There is no integration, no import routine and no sync. You type or paste the monthly figures into the Data sheet. That is deliberate – it keeps the file to plain Google Sheets with nothing to authorise or break.
Does the Recordable Safety Incident Rate make my company OSHA compliant?
No. The scorecard divides recordable incidents by labour hours and multiplies by 100,000, which is the arithmetic behind that ratio. It is a monitoring figure only. It is not a recordkeeping system, not an OSHA log, and not a substitute for your own reporting obligations or safety programme.
Can I change the ten KPIs?
Yes. The KPI names, groups, units, formulas and definitions all live in ordinary cells. Rename a KPI, change its unit, flip it from UTB to LTB, and the cards and charts follow.
Do I need Excel or any paid add-on?
No. It is a native Google Sheets file. A free Google account is enough, and it works in a browser on Windows, Mac, ChromeOS, iPhone and Android.
What data comes in the file?
Twelve months of realistic sample figures for all ten KPIs – 120 rows in total – so every card, colour and chart is populated the moment you open it. It is demo data, not benchmark data, and it is meant to be overwritten.
Can more than one person use it at once?
Yes. It behaves like any Google Sheet: share the link, set edit or view-only access, and several people can work in it at the same time.
About the Author
Built by PK – Microsoft Certified Professional with 15+ years of Excel, Google Sheets, and Power BI experience. Founder of NextGenTemplates, reaching 300K+ subscribers across YouTube channels. Every template is hand-built and tested before release.
Explore Related Templates
- Roof Inspection Checklist in Google Sheets – the job-level companion to this monthly scorecard.
- Construction Progress & Cost Control Dashboard in Google Sheets – project-level cost and progress analysis.
- Construction Project Timeline in Google Sheets – schedule the work the scorecard measures.
- Equipment Maintenance Log Tracker in Google Sheets – keep lifts, nailers and trucks on the road.
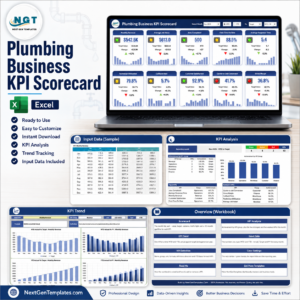
- Plumbing Business KPI Scorecard in Excel – the same scorecard idea for another trade, in Excel.
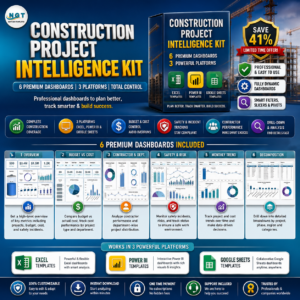
- Construction Project Intelligence Kit – six premium construction templates across Excel, Power BI and Google Sheets.
Browse more in Google Sheets KPI Dashboards & Scorecards or the full Google Sheets template library.
Add the Roofing Contractor KPI Scorecard in Google Sheets to your cart, open the PDF, click “Make a copy” and you can have December’s numbers on the wall before the end of the day. Instant download, lifetime access, free bug fixes.
Watch the step-by-step video Demo:
Last updated: 23 August 2026.

























Reviews
There are no reviews yet.