

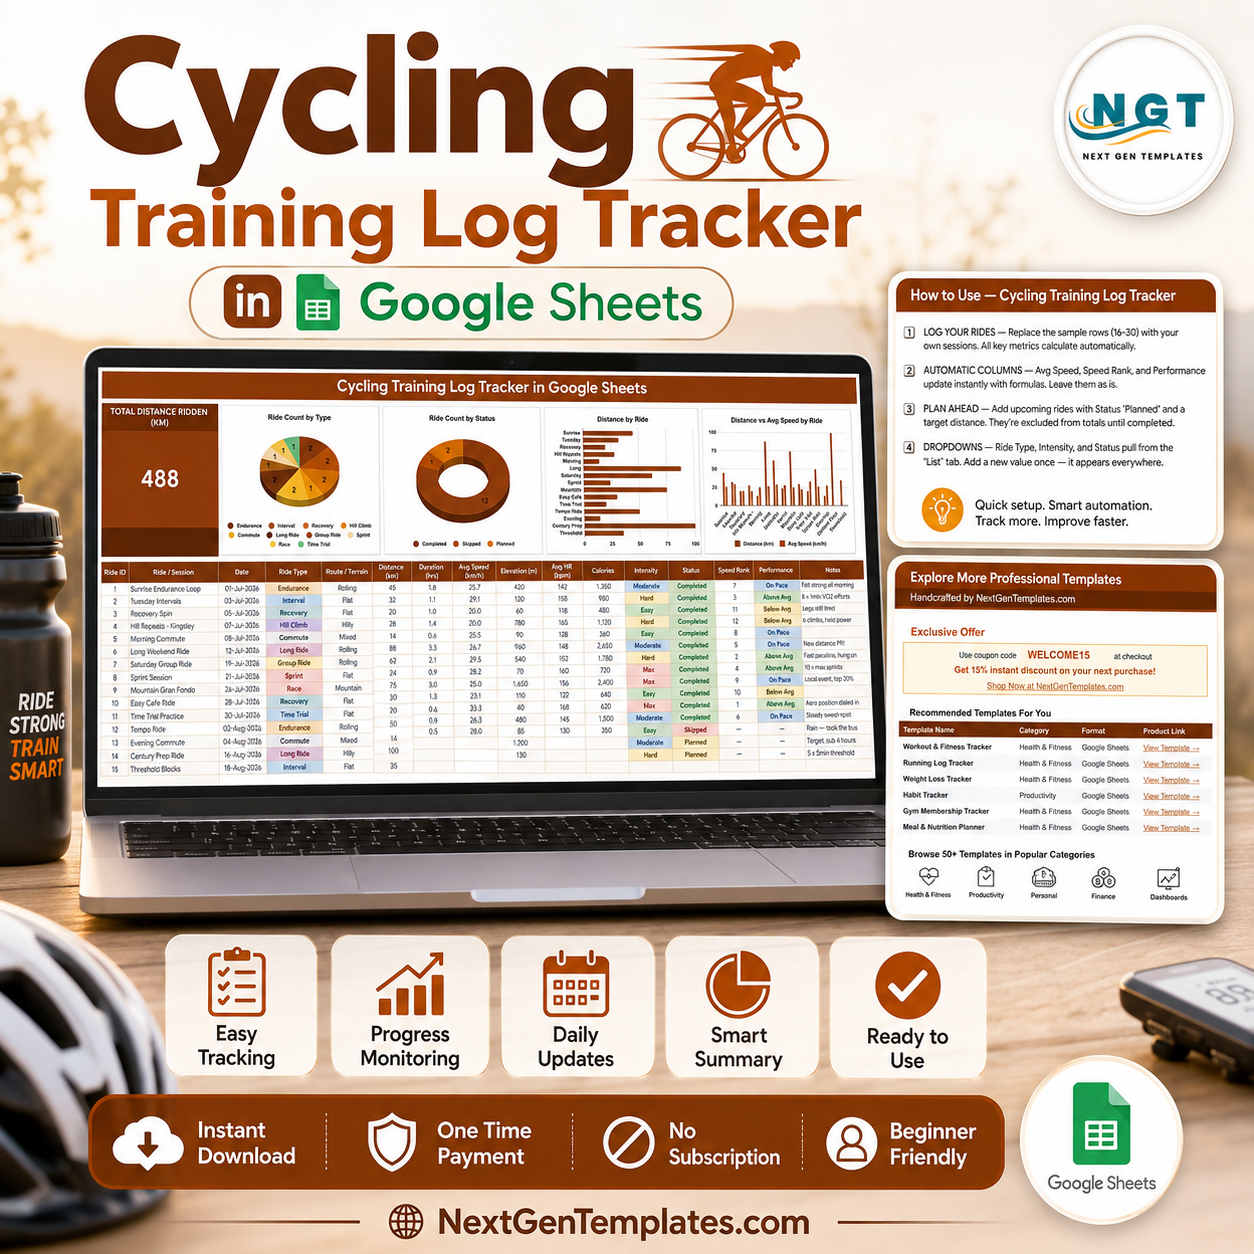
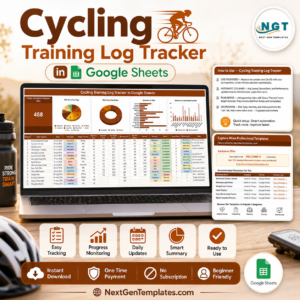
The Cycling Training Log Tracker in Google Sheets records 16 fields for every ride on one scrolling page, feeds 1 headline KPI card and 4 live charts, and works out 4 of those columns for you – Ride ID, Avg Speed, Speed Rank and Performance. It ships with 15 sample rides already logged, so every formula is visible and working before you type a single thing.
🌍 Join 8,400+ teams in 40+ countries using NextGenTemplates to replace paid SaaS tools with one-time-purchase Excel, Google Sheets, Power BI and HTML templates.
✅ Instant download · One-time payment · No subscription · No per-user fees · Lifetime access
⚠️ Please note: this is a logging and charting template, not medical or coaching advice. It records the ride data you enter and draws charts from it. It does not prescribe training, assess fitness, or make any claim about performance or injury.
🔑 Key Features of the Cycling Training Log Tracker
📋 A 16-column ride log. Every session captures Ride ID, Ride / Session name, Date, Ride Type, Route / Terrain, Distance (km), Duration (hrs), Avg Speed (km/h), Elevation (m), Avg HR (bpm), Calories, Intensity, Status, Speed Rank, Performance and free-text Notes. That is one row per ride and no second sheet to reconcile.
🧮 Four columns you never type. Ride ID numbers itself, Avg Speed divides Distance by Duration, Speed Rank orders your completed rides fastest-first, and Performance compares each ride against your own completed-ride average and returns Above Avg, On Pace or Below Avg. Change one distance and all four update instantly.
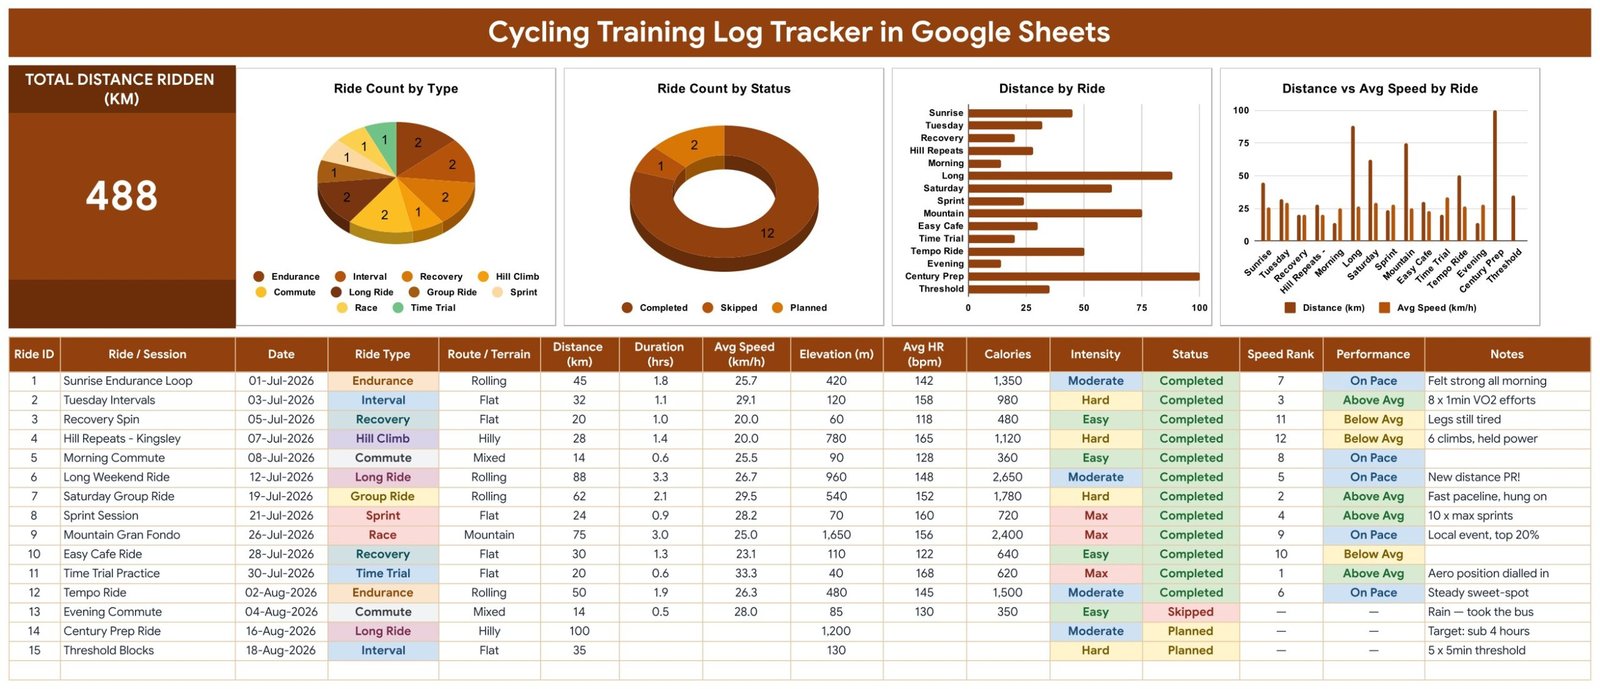
📊 One KPI card and four charts, all live. Total Distance Ridden (km) sits top-left as the headline number. Beside it, Ride Count by Type, Ride Count by Status, Distance by Ride and Distance vs Avg Speed by Ride redraw themselves as you log. All four charts read the data columns directly across rows 16-1000 using the built-in Aggregate option – there are no hidden helper tables anywhere in the file.
🎨 Dropdowns that grow with you. Ride Type offers 10 values out of the box (Endurance, Interval, Recovery, Hill Climb, Commute, Long Ride, Group Ride, Sprint, Race, Time Trial), Intensity offers Easy, Moderate, Hard and Max, and Status offers Completed, Skipped and Planned. All three pull from the List tab across rows 2-500, so adding your own value takes one keystroke and no re-setup.
🗓️ Plan first, log later. Add an upcoming ride with Status set to Planned and a target distance. It stays out of the Total Distance Ridden figure until you switch it to Completed. Sessions you miss get marked Skipped rather than deleted, which keeps the log honest and the chart counts meaningful.
📦 What’s Inside the Cycling Training Log Tracker
Page 1: The Tracker
The working page. A dark title banner, the Total Distance Ridden (km) KPI card, then Ride Count by Type, Ride Count by Status, Distance by Ride and Distance vs Avg Speed by Ride running left to right. Below them sits the full 16-column ride log with colour-coded Ride Type, Intensity, Status and Performance cells and 15 sample rides in place.
Page 2: How to Use
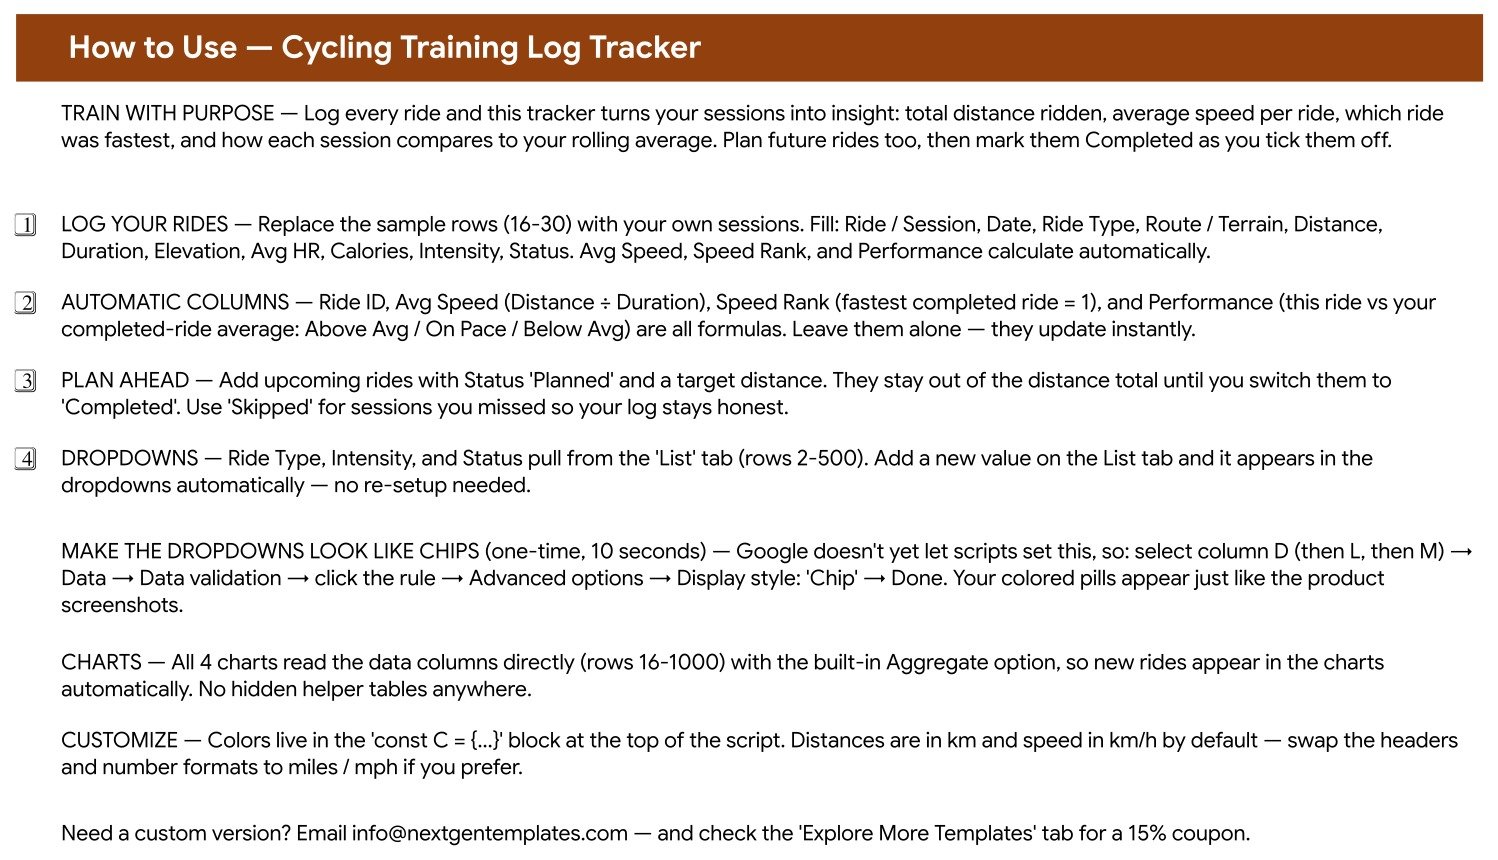
A plain-English setup tab covering the five things that matter: which rows to replace, which columns are formulas and must be left alone, how Planned and Skipped behave, how the List tab drives the dropdowns, and the one-time 10-second Data validation step that turns the dropdowns into the coloured chips you see in the screenshots.
Page 3: Explore More Templates
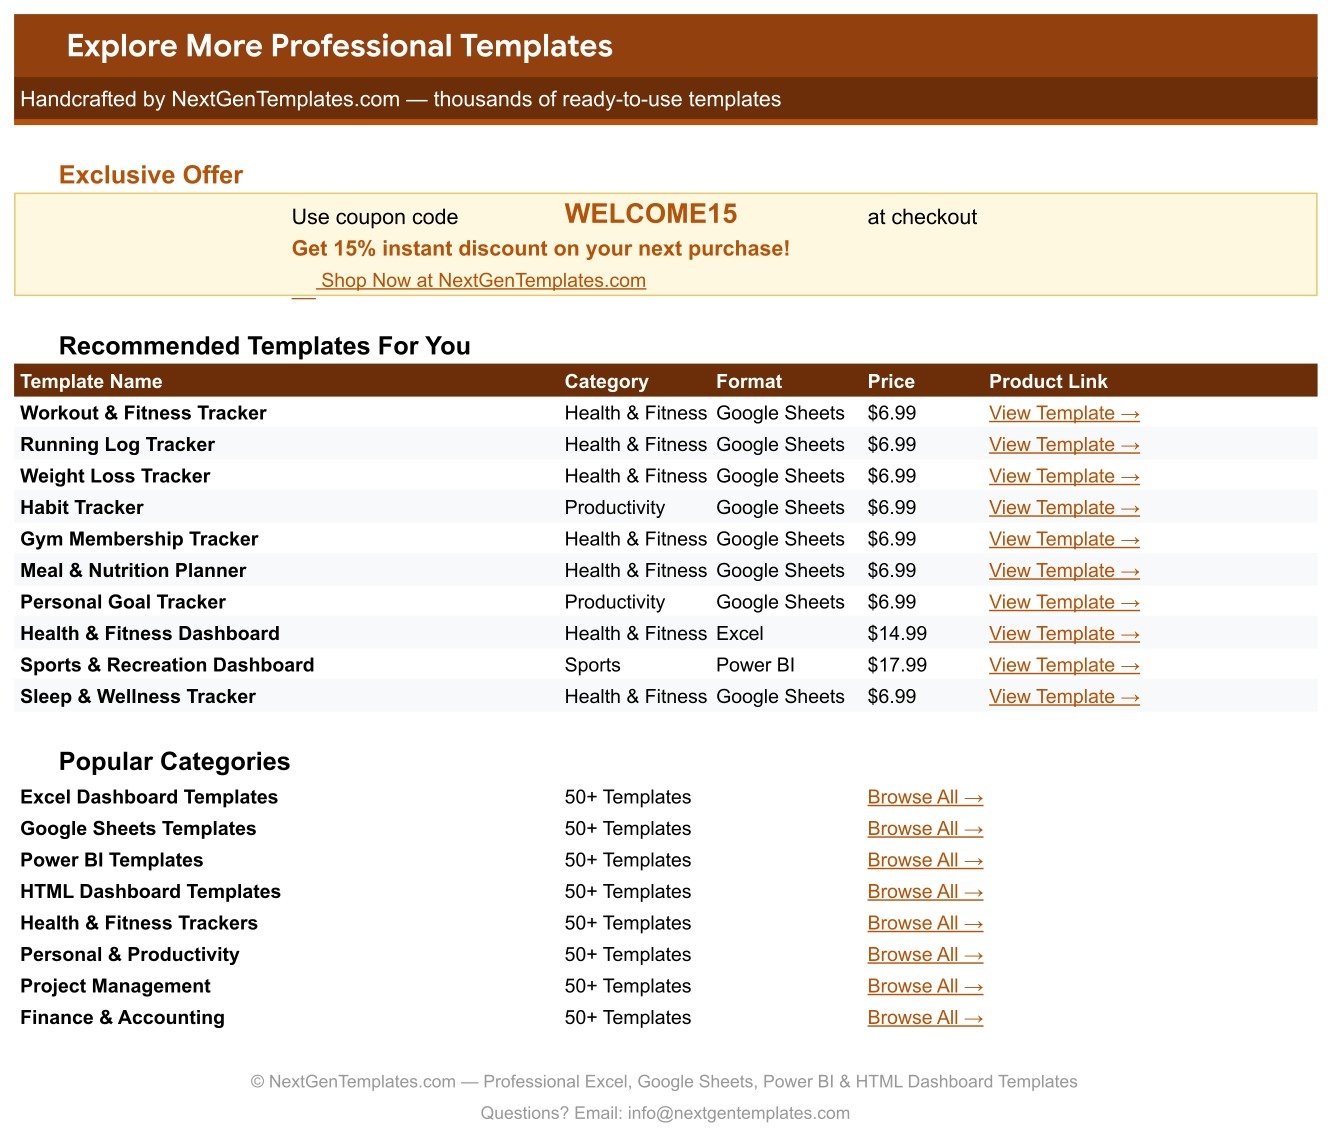
A built-in index of related NextGenTemplates products with a WELCOME15 coupon code, plus browse links to the main template categories. Handy if you want the matching running, steps or workout logs after a few weeks with this one.
The List tab
The quiet engine behind the dropdowns. Three columns of values across rows 2-500 feed Ride Type, Intensity and Status. Type a new ride type here – Gravel, Zwift, Bikepacking, whatever you actually do – and it is in the dropdown the moment you press Enter.
📊 Cycling Training Log Tracker vs. a Microsoft Excel Ride Log vs. Strava Premium / TrainingPeaks
| Feature | Cycling Training Log Tracker in Google Sheets | Microsoft Excel ride log | Strava Premium / TrainingPeaks |
|---|---|---|---|
| Cost | $6.99 one-time ✅ | $6.99-$15 one-time, plus an Office licence | $12-$20 / user / month |
| Platform | Google Sheets – browser, nothing to install ✅ | Desktop Excel or Microsoft 365 | Vendor’s app and web portal |
| Setup time | Under 10 minutes – copy, clear the samples, log ✅ | 10-20 minutes, plus macro trust prompts | Account, device pairing and permissions |
| Real-time sharing with a coach or ride partner | Share the sheet by link, edits appear live ✅ | File copies emailed back and forth | Yes, on paid tiers ✅ |
| Mobile access | Google Sheets app, free on iOS and Android ✅ | Excel mobile, limited formula editing | Yes ✅ |
| Add your own ride types and fields | Type them on the List tab – no limits ✅ | Yes, but you rebuild the validation rules | Fixed to the vendor’s schema |
| Your raw data stays yours | A file in your own Google Drive ✅ | A file on your own disk ✅ | Held on the vendor’s servers |
| Works without a GPS bike computer | Yes – type the numbers from any source ✅ | Yes ✅ | Mostly built around device uploads |
| Year-1 cost at 5 riders | $6.99 total ✅ | $6.99 + licences | $720-$1,200 |
For riders who want their own ride history in a file they control – without a monthly subscription or a device requirement – the Cycling Training Log Tracker sits in the sweet spot.
👥 Who This Template Is For – and Who It’s Not For
✅ This template is built for:
- Recreational and club cyclists who want a tidy season-long record of distance, speed and elevation
- Commuters who want to see how many of their weekly rides actually happened
- Riders building toward a specific event who want Planned rides sitting alongside Completed ones in the same list
- Anyone who logs from a bike computer, a phone app or memory, and wants it all in one place they own
- Coaches or ride partners who want a shared, editable log rather than screenshots
❌ This template is NOT for:
- Anyone looking for a training plan, workout prescription or coaching guidance – this template logs what you did, it does not tell you what to do
- Anyone wanting medical, physiological or injury-related interpretation of their data – it offers none
- Riders who want automatic GPS or Strava sync – every row is typed in by hand
- Power-based training analysis with FTP curves, TSS or normalised power – there are no power fields and no such calculations
- Teams needing user permissions, audit trails or an approval workflow
⚙️ How to Use the Cycling Training Log Tracker
- Open the PDF in your download and click the Google Sheets copy link to create your own editable copy in your Drive.
- Read the How to Use tab once. It takes two minutes and covers everything below.
- Replace the 15 sample rows (rows 16-30) with your own rides. Fill Ride / Session, Date, Ride Type, Route / Terrain, Distance, Duration, Elevation, Avg HR, Calories, Intensity and Status.
- Leave Ride ID, Avg Speed, Speed Rank and Performance alone – they are formulas and fill themselves in.
- Do the one-time chip step: select column D, then L, then M, go to Data, Data validation, click the rule, Advanced options, Display style Chip. Your coloured pills now match the screenshots.
- Add upcoming rides with Status set to Planned. They stay out of the distance total until you mark them Completed.
- Add your own ride types, intensities or statuses on the List tab whenever you need one – the dropdowns pick them up straight away.
💼 Real-World Use Cases
Marco rides with a club three evenings a week. He logs each session the same night – distance, duration, terrain and a line in Notes about how the group ride went. The Ride Count by Type chart shows him at a glance that his season has been heavier on Group Rides than on anything else, which is simply a fact about his own log rather than a verdict on it.
Priya is riding toward a 100 km event in the autumn. She keeps her next month of rides in the sheet as Planned with target distances, then flips each one to Completed as it happens. The Total Distance Ridden card only ever counts what she actually rode, so the number never flatters her.
Dan commutes by bike and wanted to know how often he really does it. He marks the wet mornings he takes the bus as Skipped rather than deleting them. Three months in, the Ride Count by Status donut gives him an honest completed-versus-skipped split he could not have guessed.
❓ Frequently Asked Questions
Is the Cycling Training Log Tracker medical or coaching advice?
No. The Cycling Training Log Tracker in Google Sheets is a logging and charting template. It stores the ride figures you type and draws charts from them. It gives no training prescription, no health interpretation, and makes no claim about performance, recovery or injury.
What exactly does the Performance column calculate?
Performance compares each completed ride’s average speed against the average of all your completed rides in the same sheet, and returns Above Avg, On Pace or Below Avg. It is a purely arithmetic comparison against your own data – nothing is benchmarked against anyone else.
Can I switch from kilometres to miles?
Yes. The Cycling Training Log Tracker ships in km and km/h, and the How to Use tab explains the swap: change the column headers and the number formats to miles and mph. The formulas are unit-agnostic and keep working either way.
Does it sync with Strava, Garmin or Wahoo?
No. The Cycling Training Log Tracker has no integrations – every ride is typed in by hand. That is deliberate: it means the template works whether your numbers come from a bike computer, a phone, or the odometer on your handlebars.
How long does setup take?
Under 10 minutes. Copy the sheet from the link in the PDF, delete the 15 sample rides, and start logging. The only optional extra is the 10-second Data validation step that turns the three dropdowns into coloured chips.
Will the charts pick up rides I add later?
Yes. All four charts in the Cycling Training Log Tracker read the data columns directly across rows 16-1000 with the built-in Aggregate option, so new rides appear automatically. You never need to edit a chart range.
How does this compare to a Strava Premium subscription?
Strava Premium costs $12-$20 per month and holds your history on its servers. The Cycling Training Log Tracker is a one-time $6.99 file that lives in your own Google Drive, has no monthly fee, and lets you add any field or ride type you like – but it has no GPS, no sync and no social feed.
👤 About the Author
Built by PK – Microsoft Certified Professional with 15+ years of Excel, Google Sheets and Power BI experience. Founder of NextGenTemplates, reaching 300K+ subscribers across YouTube channels (@PK-AnExcelExpert, @NextGenTemplates, @NeoTechNavigators). Every template is hand-built and tested before release.
🔗 Explore Related Templates
The closest neighbour is the Running Log & Mileage Tracker in Google Sheets – same one-page layout, same auto-calculated columns, built around pace and mileage instead of ride type and terrain. Pair it with the Daily Steps Tracker in Google Sheets for the days you are off the bike, or the Workout Log Tracker in Google Sheets for gym sessions.
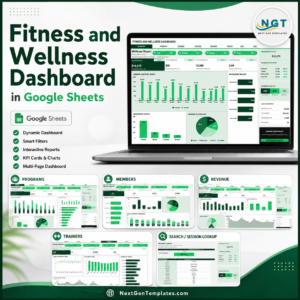
If you want charts across a whole facility rather than one rider, the Fitness and Wellness Dashboard in Google Sheets and the Sports and Recreation Dashboard in Google Sheets are the multi-page step up, and the Gym Membership Tracker in Google Sheets covers the admin side. Browse the full Google Sheets Trackers range or all Google Sheets Templates.
📖 Click here to read the Detailed Blog Post<
Watch the step-by-step video Demo:
Watch the step-by-step video Demo:
🎥 Visit our YouTube channel for step-by-step video tutorials
👉 YouTube.com/@NextGenTemplates
📅 Last updated: August 2026




















Reviews
There are no reviews yet.