


Elevate Your Customer Experience Strategy with Real-Time Performance Insights.
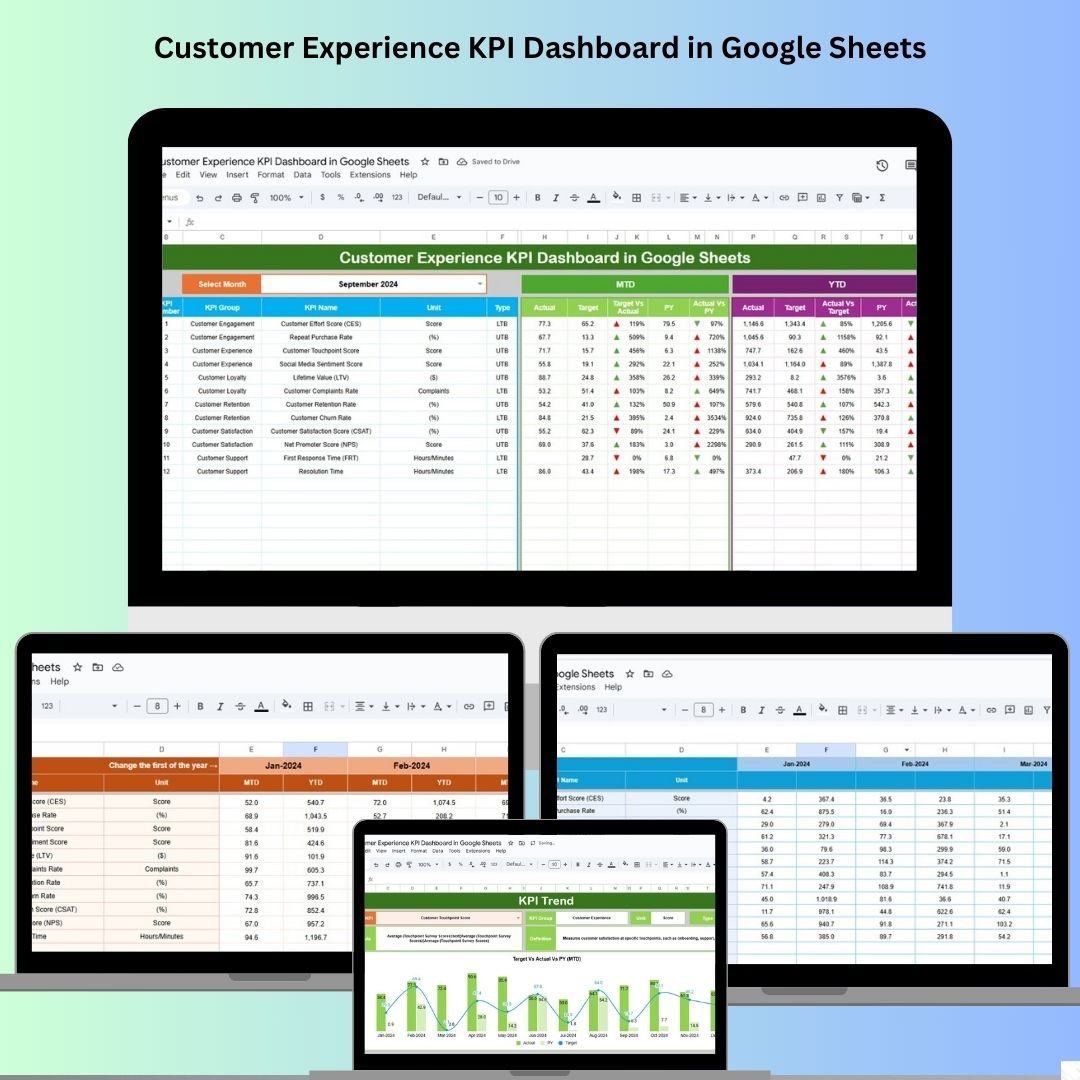
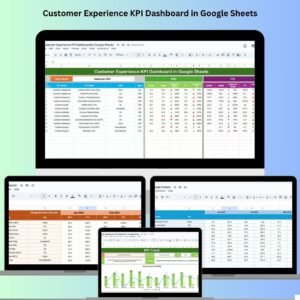
In today’s fast-paced, customer-driven world, measuring and improving the customer journey is critical. The Customer Experience KPI Dashboard in Google Sheets empowers your team to track, analyze, and improve customer satisfaction with real-time metrics.
This interactive, ready-to-use template lets you monitor essential KPIs such as Net Promoter Score (NPS), Customer Satisfaction Score (CSAT), Churn Rate, First Response Time, and more. Whether you’re leading a support team or a CX department, this dashboard provides the clarity and visibility needed to make customer-focused decisions faster and smarter.
Built in Google Sheets, it’s cloud-based, collaborative, and fully customizable.
✨ Key Features of the Customer Experience KPI Dashboard
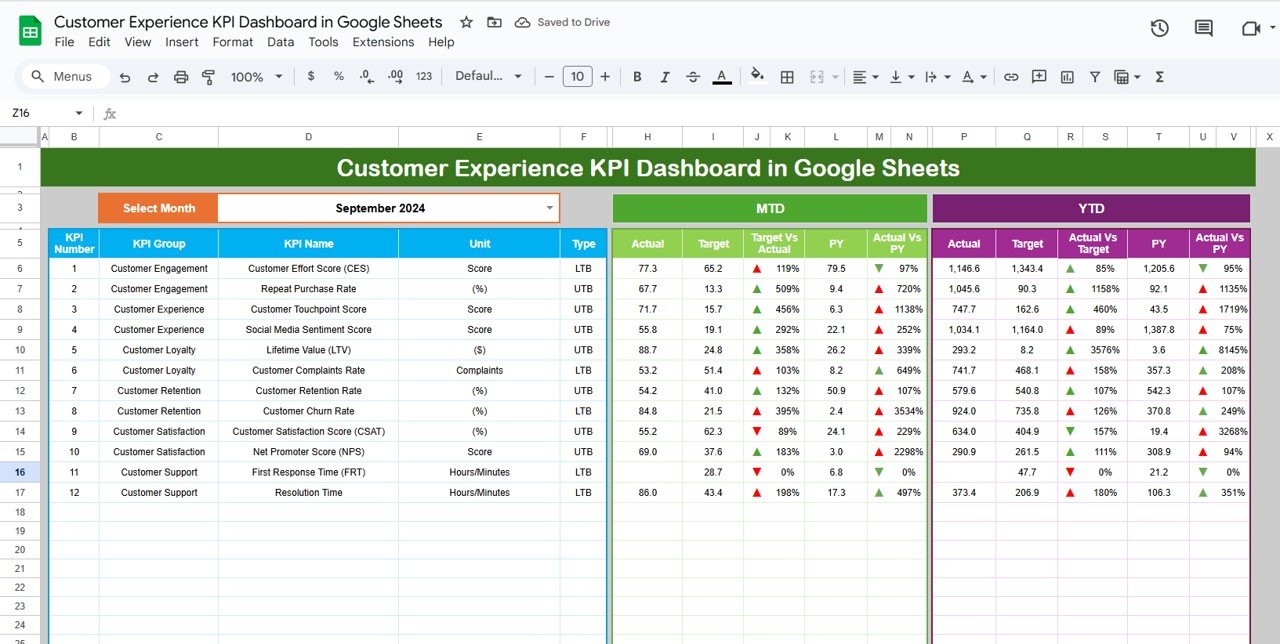
📊 Centralized Dashboard Sheet
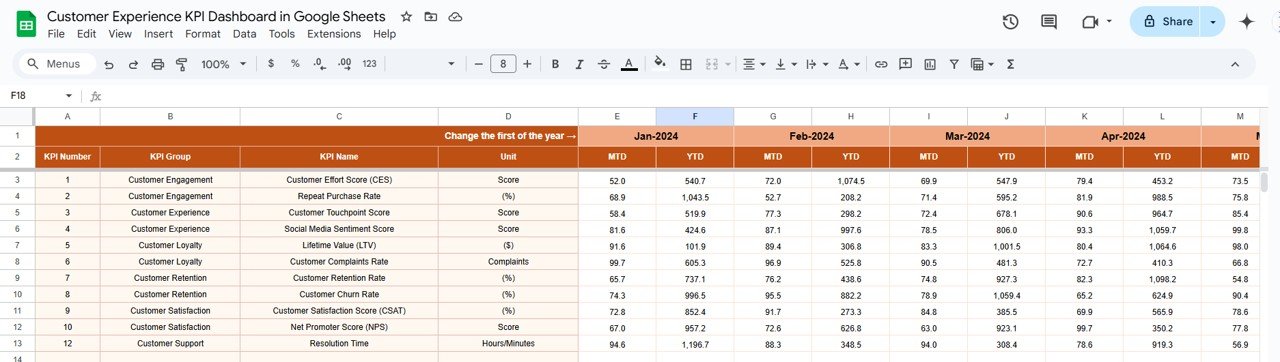
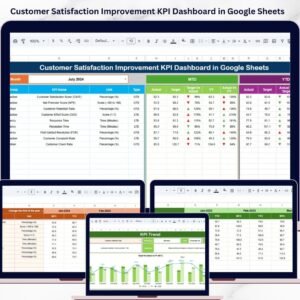
Gain quick access to MTD, YTD, and Previous Year comparisons with automated arrows that highlight target achievement and performance drops.
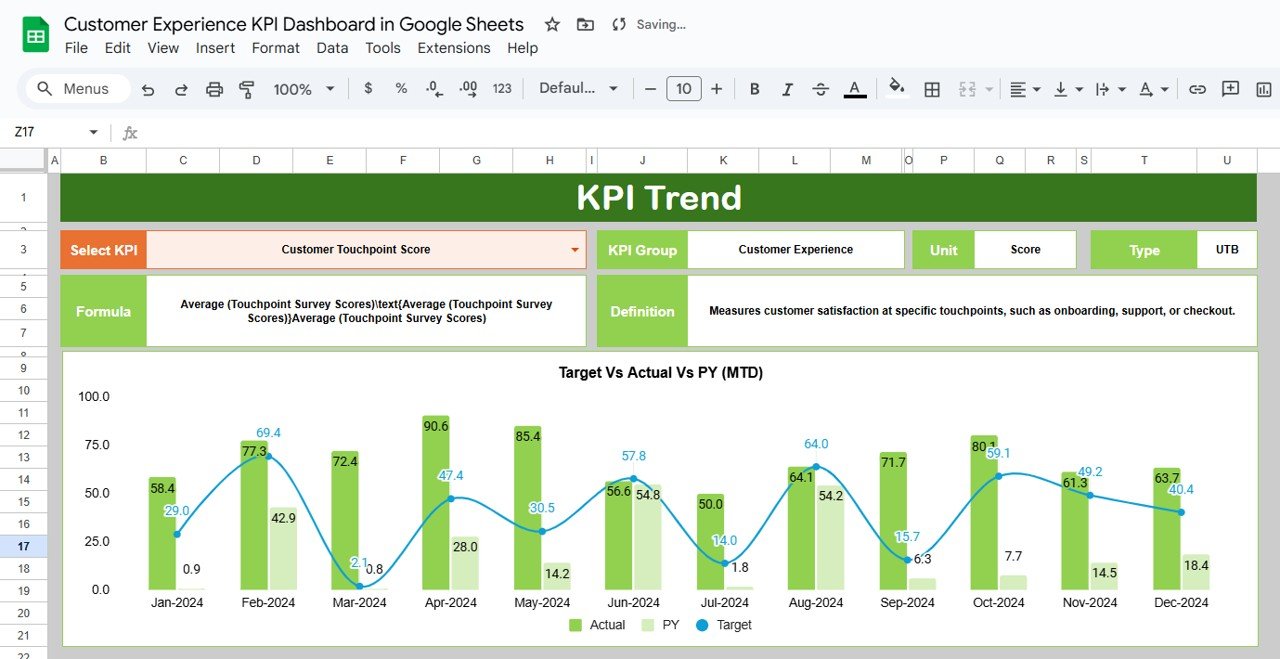
📈 KPI Trend Analysis Sheet
Use the dropdown to select any KPI and view its definition, unit, type (LTB/UTB), and automated MTD/YTD trend charts for deeper insight.
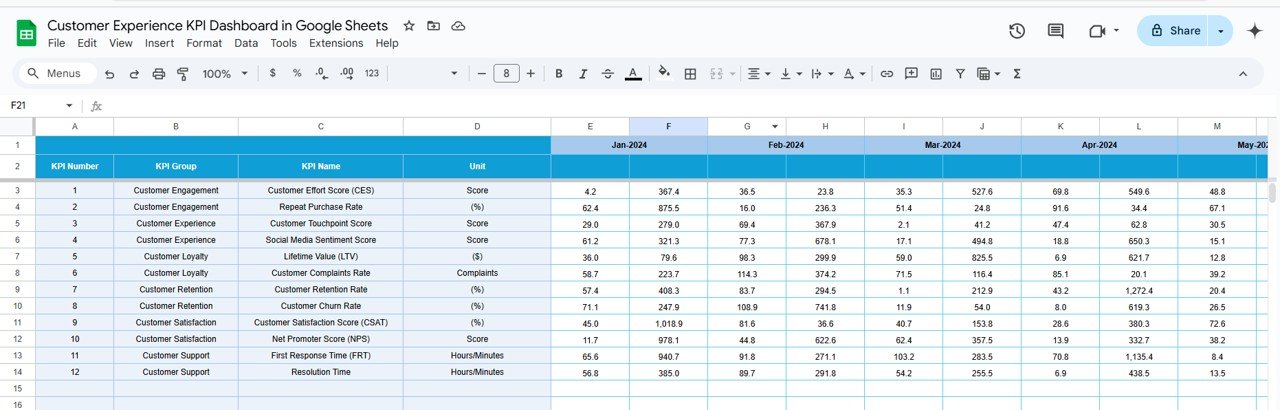
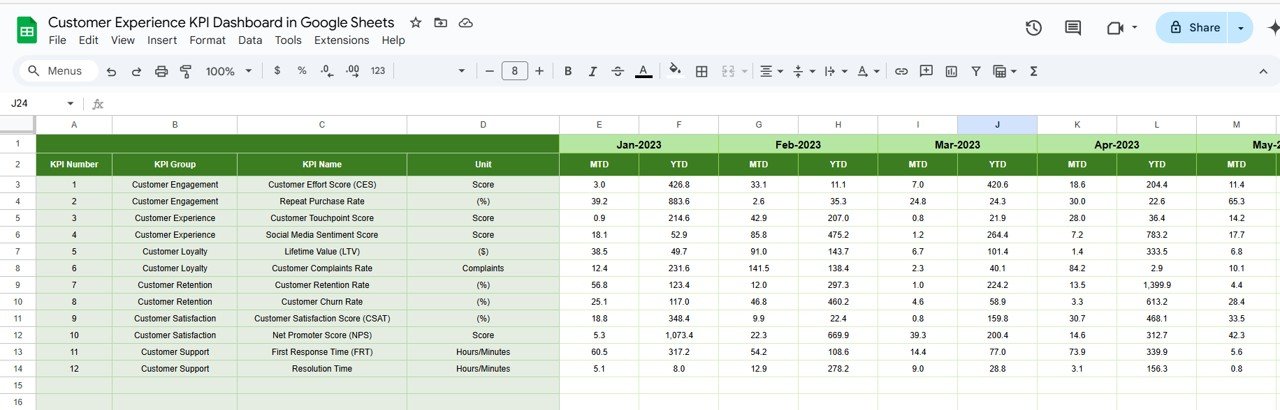
📥 Actual Numbers Input Sheet
Monthly input sheet to add performance values—everything gets reflected on the dashboard without needing formulas or coding.
🎯 Target and Previous Year Input
Set your monthly and annual targets and add past-year figures for easy year-over-year analysis.
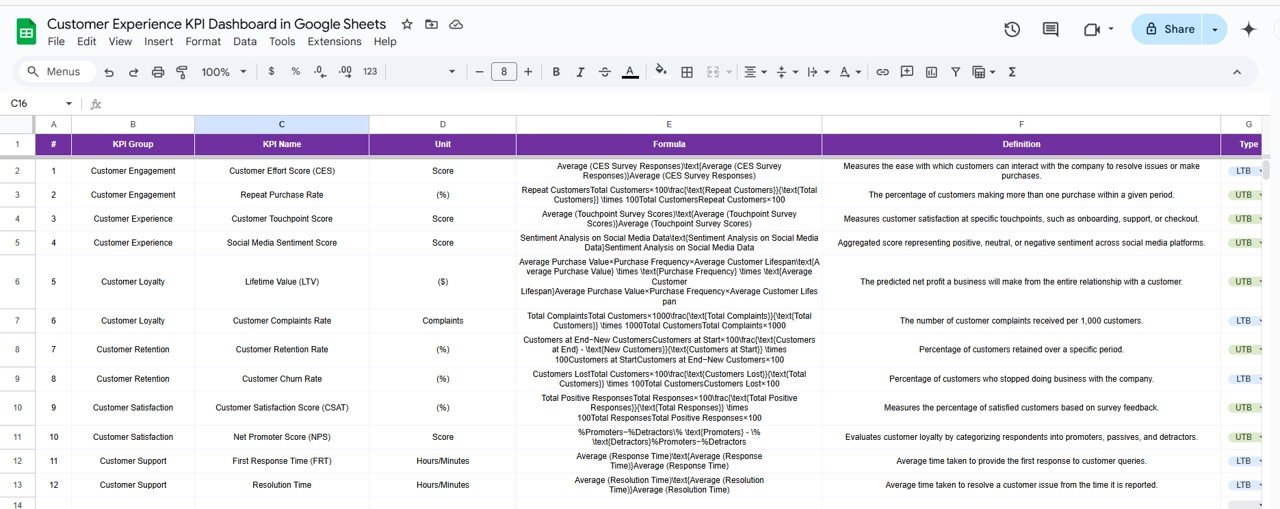
📘 KPI Definition Sheet
Includes all metric details—KPI Name, Group, Formula, Type, and Meaning—to ensure consistency across your team.
✅ Conditional Formatting
Green and red arrows instantly show whether you’re on target, above or below expectations.
📦 What’s Included in the Template?
6 Smartly Structured Worksheets:
Dashboard Sheet
KPI Trend Sheet
Actual Numbers Sheet
Target Sheet
Previous Year Data Sheet
KPI Definition Sheet
Pre-formatted with Charts, Tables, and Drop-downs
Fully Editable for Custom KPIs
No Add-ons Required—Pure Google Sheets Functionality
Collaborate Online in Real-Time
📊 Sample KPIs You Can Track
Net Promoter Score (NPS)
Customer Satisfaction Score (CSAT)
First Response Time
Average Resolution Time
Customer Retention Rate
Churn Rate
Ticket Volume
Customer Effort Score (CES)
Support Request Escalation Rate
Service Level Agreement (SLA) Compliance
Each metric can be configured as UTB (Upper the Better) or LTB (Lower the Better) depending on the target outcome.
👥 Who Can Use This Dashboard?
👨💼 CX Managers – Track satisfaction and service efficiency
📞 Support Teams – Improve ticket handling and SLA compliance
📢 Marketing Teams – Evaluate brand perception and loyalty
🏢 Business Leaders – Align team actions with customer-centric goals
📈 SaaS Companies & Startups – Monitor churn, engagement, and retention
💬 Call Centers & Helpdesks – Reduce wait times and increase satisfaction
🔥 Advantages of Using This Dashboard
✅ Real-Time Monitoring – Stay updated with dynamic visuals and charts
✅ 100% Customizable – Add KPIs, rename tabs, or change colors easily
✅ Team Collaboration in Google Sheets – Access anywhere, share with ease
✅ Visual Feedback – Arrows, charts, and color codes offer quick insights
✅ Data-Driven Improvements – Drive better decisions and CX strategies
🧠 Best Practices
✔️ Update Monthly – Maintain data freshness for accurate insights
✔️ Focus on Trends – Use the KPI Trend tab to identify long-term issues or wins
✔️ Train Teams – Align your team with KPI definitions to ensure consistency
✔️ Monitor High-Impact Metrics – Prioritize metrics like NPS, FRT, and Retention
✔️ Collaborate Across Teams – Share insights across support, sales, and marketing
🔗 Read the Full Blog Post
Customer Experience KPI Dashboard in Google Sheets – Complete Guide





Reviews
There are no reviews yet.