



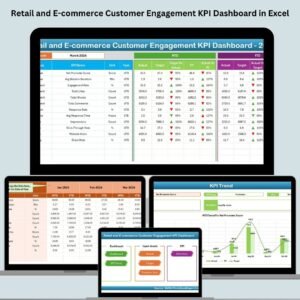
In today’s customer-centric era, business growth depends on how effectively you keep your customers engaged and loyal 💬. The Customer Engagement KPI Scorecard in Excel is a ready-to-use analytical tool designed to help organizations measure, monitor, and improve their customer engagement strategies — all from one smart, interactive dashboard.
This professionally built Excel template gives you the clarity you need to evaluate key customer metrics, spot trends, and make informed, data-driven decisions. Whether you’re managing a marketing department, customer success team, or executive office, this scorecard provides instant insight into how well your engagement efforts are performing.
💡 Key Features of the Customer Engagement KPI Scorecard in Excel
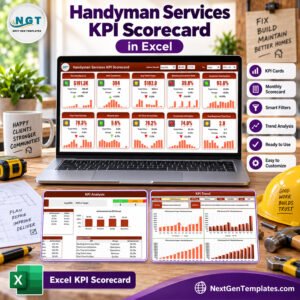
✅ Comprehensive Dashboard: Track all your customer engagement KPIs — including CSAT, NPS, churn rate, and repeat purchase rate — in one centralized sheet.
✅ Dropdown-Driven Analysis: Switch easily between Month, MTD, and YTD analysis views.
✅ Automatic KPI Calculations: Get real-time results as soon as you update your data.
✅ Color-Coded Visuals: Instantly understand performance with traffic-light indicators (Green = On Track, Yellow = Needs Attention, Red = Falling Behind).
✅ Dynamic Trends: Visualize performance patterns over time with MTD, YTD, and Previous Year comparisons.
✅ Built-in Definitions: Every KPI includes a definition, formula, and unit — ensuring clarity for all users.
✅ Offline & Secure: No software dependency or subscription required — your data stays private within Excel.
✅ Customizable Layout: Easily add, edit, or remove KPIs to match your organization’s focus areas.
This scorecard provides a perfect blend of simplicity and power — transforming Excel into a full-fledged performance tracking system that’s suitable for any business size or industry.

📊 What’s Inside the Customer Engagement KPI Scorecard in Excel
This Excel file includes four structured worksheets, each crafted for accuracy, ease of use, and automation:
Scorecard Sheet (Main Dashboard):
Interactive visual layout showing 10 KPIs in one glance.
Dropdown menus to toggle Month, MTD, and YTD.
Automated charts and conditional formatting.
KPI Trend Sheet:
Choose any KPI from a dropdown to view its trend.
Includes MTD/YTD graphs for Actual vs Target vs Previous Year.
Displays KPI Group, Unit, Formula, Definition, and Type.
Input Data Sheet:
Centralized data entry for monthly Actual, Target, and Previous Year values.
Dynamic refresh – once you update data, dashboards update instantly.
KPI Definition Sheet:
Contains details for every KPI: formula, meaning, and type.
Helps teams maintain consistency and understanding.
Each sheet is interlinked, so all performance metrics are synchronized automatically for smooth reporting and monitoring.
⚙️ How to Use the Customer Engagement KPI Scorecard in Excel
Using this scorecard is effortless — even for non-technical users 👩💻:
Open the Excel file and go to the Input Data Sheet.
Enter Actual, Target, and Previous Year data for each KPI monthly.
Move to the Scorecard Sheet to instantly view MTD and YTD analysis.
Select any KPI from the Trend Sheet dropdown to view its monthly trend chart.
Use KPI Definitions to ensure accuracy and consistency.
Customize KPIs, colors, and units as per your organization’s needs.
That’s it! No coding or setup required — everything is pre-built and fully automated.
👥 Who Can Benefit from This Scorecard
This Excel template is ideal for:
🏢 Customer Success Managers – Monitor churn, satisfaction, and engagement KPIs.
📈 Marketing Teams – Track campaign impact and loyalty performance.
💼 Business Owners – Get at-a-glance insights on customer retention and loyalty.
📊 Data Analysts – Analyze trends and identify improvement opportunities.
🤝 CRM Professionals – Correlate engagement metrics with revenue growth.
🧭 Consultants & Agencies – Use the scorecard for multiple client accounts.
It’s a one-stop analytical solution for anyone aiming to build long-term, data-backed customer relationships.
Click here to read the Detailed Blog Post
Watch the step-by-step video tutorial:
Visit our YouTube Channel to learn step-by-step video tutorials
Compatibility and Requirements
- Works in Microsoft Excel desktop (Excel 2016 or later, or Microsoft 365).
- You switch between Month, MTD and YTD views with drop-down lists. Microsoft explains these lists in Create a drop-down list.
Frequently Asked Questions
Which KPIs does the scorecard track?
The scorecard shows 10 KPIs, including CSAT, NPS, churn rate and repeat purchase rate.
How many worksheets are included?
There are four: the Scorecard sheet, KPI Trend sheet, Input Data sheet and KPI Definition sheet.
How do the color indicators work?
Green means on track, yellow means needs attention and red means falling behind.
Can I add or remove KPIs?
Yes. The layout is customizable, so you can add, edit or remove KPIs.
Related Customer Engagement Templates
- Customer Engagement KPI Dashboard in Excel: a dashboard layout for the same KPIs
- Sales and Marketing Customer Engagement KPI Dashboard in Excel: engagement KPIs for sales and marketing teams
- Customer Engagement KPI Dashboard in Power BI: the same topic built for Power BI
- Customer Engagement KPI Scorecard in Google Sheets: the same scorecard for Google Sheets
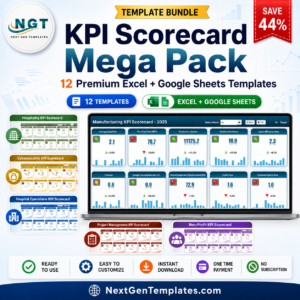
- KPI Scorecard Mega Pack: a bundle of Excel and Google Sheets scorecards
Browse all Excel KPI dashboards or the Excel sales and marketing templates.













Reviews
There are no reviews yet.