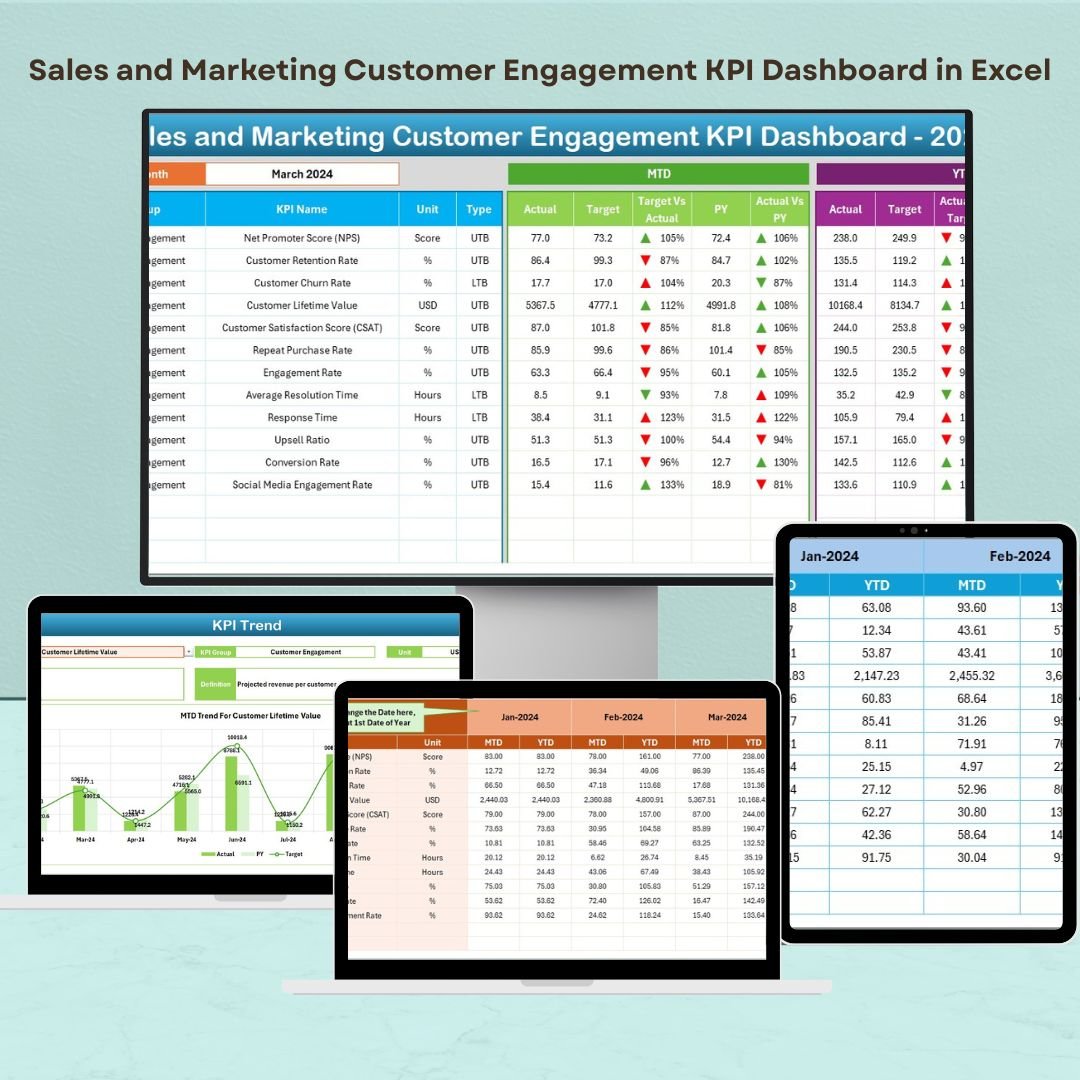


The Sales and Marketing Customer Engagement KPI Dashboard in Excel is a powerful tool designed to help businesses and marketing teams track and measure key performance indicators (KPIs) related to customer engagement across sales and marketing efforts. This Excel-based dashboard allows you to monitor essential metrics such as customer acquisition, conversion rates, engagement levels, and sales pipeline health, providing valuable insights to optimize your customer engagement strategies.
With this tool, sales and marketing teams can analyze the effectiveness of their campaigns, track customer interactions, and identify opportunities to improve customer satisfaction and retention. The intuitive layout and real-time updates make it easy to keep track of KPIs, improve collaboration, and make data-driven decisions to boost sales and marketing performance.
Key Features of the Sales and Marketing Customer Engagement KPI Dashboard in Excel
📊 Customer Acquisition & Conversion Tracking
Monitor key metrics such as customer acquisition cost (CAC), lead conversion rates, and customer acquisition sources. Analyze which channels and strategies are driving the most conversions.
📈 Engagement & Retention Metrics
Track customer engagement levels by monitoring metrics such as website visits, email open rates, click-through rates (CTR), and social media interactions. Identify opportunities to improve retention by analyzing engagement trends.
🛠 Sales Pipeline Performance
Monitor the health of your sales pipeline by tracking key stages of the sales process. Track metrics like lead volume, qualification rates, and sales closures to optimize your sales funnel.
📅 Time-Based Performance Tracking
Track performance across various time periods (daily, weekly, monthly). View trends in customer acquisition, engagement, and retention to better understand the effectiveness of your sales and marketing activities over time.
⚙️ Customizable KPIs & Metrics
Customize the dashboard to track the specific KPIs that matter most to your business. Add or remove fields based on your sales and marketing objectives.
📉 Real-Time Data Integration
Integrate data from multiple sources, such as CRM systems, social media analytics, and email marketing platforms, to provide up-to-date insights for decision-making.
Why You’ll Love the Sales and Marketing Customer Engagement KPI Dashboard in Excel

✅ Track Engagement & Sales Performance
Monitor the health of your customer relationships and sales pipeline in real-time, ensuring that no opportunities are missed and that customer engagement stays high.
✅ Optimize Conversion Rates & ROI
Analyze customer acquisition and conversion rates to optimize your sales and marketing strategies. Improve ROI by identifying which campaigns are yielding the best results.
✅ Improve Customer Retention
Measure customer engagement and identify areas where retention strategies can be improved. Monitor social media engagement, email performance, and customer satisfaction to retain valuable customers.
✅ Data-Driven Insights for Smarter Decisions
Gain actionable insights into your sales and marketing strategies with real-time data tracking. Make informed decisions about where to allocate resources and which strategies to prioritize.
✅ Customizable & Scalable
Tailor the dashboard to your unique business needs. Whether you’re a small business or a large enterprise, this tool is scalable and adaptable to suit your specific goals.
What’s Inside the Sales and Marketing Customer Engagement KPI Dashboard in Excel?
-
Customer Acquisition & Conversion Tracking: Track customer acquisition and conversion rates across channels.
-
Engagement & Retention Metrics: Monitor engagement levels and retention metrics.
-
Sales Pipeline Performance: Track lead volume, sales qualification rates, and closed deals.
-
Time-Based Analysis: Track performance over daily, weekly, or monthly periods.
-
Customizable KPIs: Tailor the dashboard to reflect your business’s unique needs.
-
Real-Time Data Integration: Integrate data from CRM, social media, and marketing platforms for accurate insights.
How to Use the Sales and Marketing Customer Engagement KPI Dashboard in Excel
1️⃣ Download the Template: Get access to the Sales and Marketing Customer Engagement KPI Dashboard in Excel instantly.
2️⃣ Input Your Data: Enter key customer engagement metrics, including conversion rates, lead volumes, and engagement levels.
3️⃣ Track KPIs & Performance: Monitor the performance of your sales and marketing activities in real-time.
4️⃣ Analyze Data & Trends: Use time-based analysis to track performance trends and identify opportunities for improvement.
5️⃣ Optimize Sales & Marketing Strategy: Use the insights gained to improve customer engagement, retention, and sales performance.
Who Can Benefit from the Sales and Marketing Customer Engagement KPI Dashboard in Excel?
🔹 Sales & Marketing Teams
🔹 Business Owners & Founders
🔹 Customer Relationship Managers
🔹 Marketing Analysts & Data Analysts
🔹 E-commerce Platforms & Online Retailers
🔹 Digital Marketers & Campaign Managers
🔹 Small & Medium Enterprises (SMBs)
🔹 Large Enterprises with Sales & Marketing Departments
Optimize your sales and marketing efforts with the Sales and Marketing Customer Engagement KPI Dashboard in Excel. Track key metrics, analyze performance trends, and make data-driven decisions to boost engagement and conversions.
Click here to read the Detailed blog post
Visit our YouTube channel to learn step-by-step video tutorials
Youtube.com/@PKAnExcelExpert


Reviews
There are no reviews yet.