

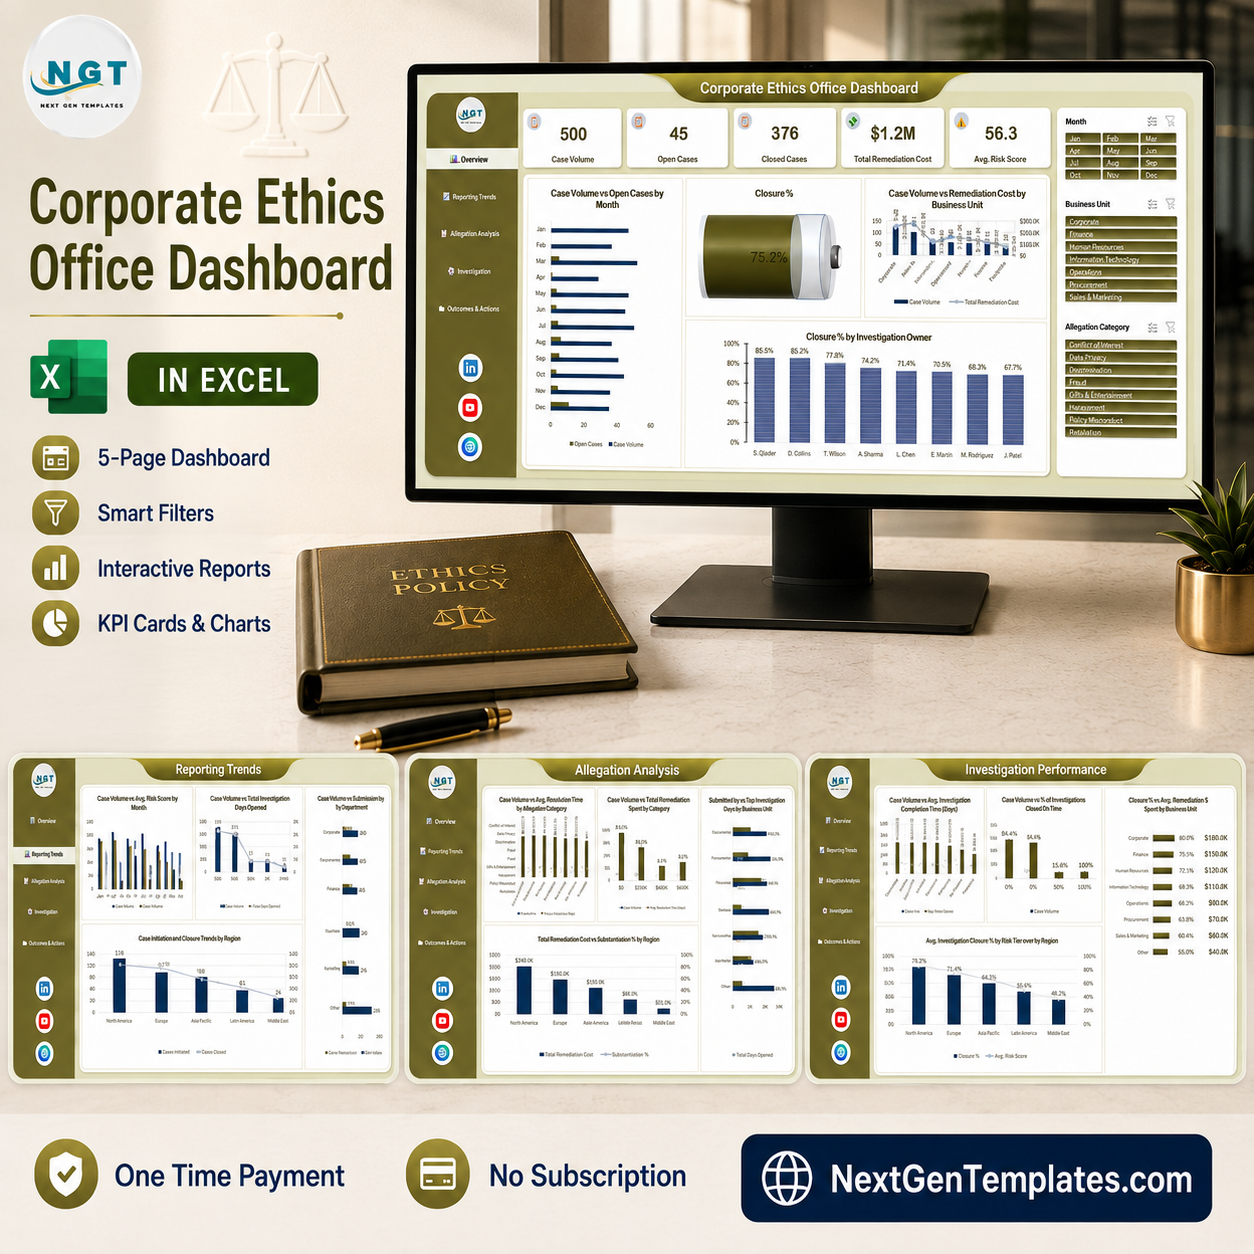
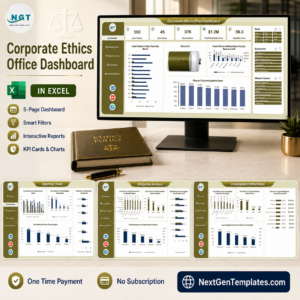
The Corporate Ethics Office Dashboard in Excel turns a full year of ethics and compliance casework into five report pages a general counsel can read in a minute. The sample build carries 500 cases, 45 still open, 376 closed, $1.2M of remediation cost and a 56.3 average risk score across seven business units, eight allegation categories, five reporting channels and five regions – and every figure recalculates the moment you paste your own case log in. It is built on plain Excel formulas, pivot tables and slicers – no macros, no Power Pivot licence, no add-ins – so it opens on any locked-down machine running Excel 2016 or later, including Excel for Mac and Microsoft 365. Instant download, unlocked file, and a refund if it does not open on your setup. Corporate Ethics Office Dashboard in Excel
A note on which template this is: this is the analytical Excel dashboard – five wide report pages driven by a shared slicer rail, built for exploring a whole caseload. It is not a monthly KPI scorecard with a month picker, target-versus-actual columns and traffic lights. If the scorecard format is what you need, browse the Excel KPI Dashboard category instead.
Key Features of the Corporate Ethics Office Dashboard in Excel
- Five report pages with a fixed navigation rail. Overview, Reporting Trends, Allegation Analysis, Investigation Performance and Outcomes & Actions, each one click away from the left-hand menu.
- Three slicers synced across every page. Month, Business Unit and Allegation Category sit in a right-hand rail. Click Harassment plus Operations and all five pages answer that question together.
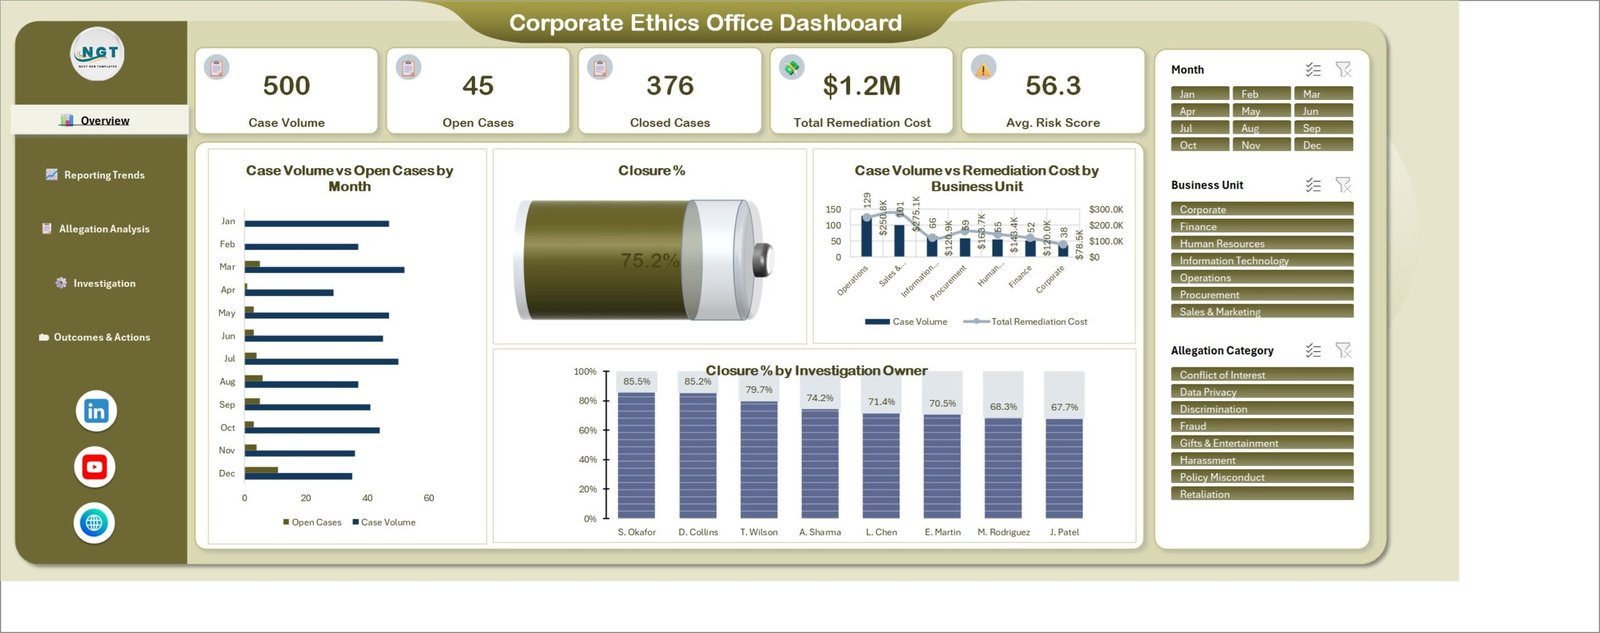
- Five headline cards. Case Volume 500, Open Cases 45, Closed Cases 376, Total Remediation Cost $1.2M and Avg. Risk Score 56.3, all above the fold and all filter-aware.
- A closure gauge. One 75.2% figure for the share of the caseload that has been closed, so a backlog building behind a policy change shows up immediately.
- Investigator league table. Closure % by Investigation Owner ranks all eight investigators from S. Okafor at 85.5% down to J. Patel at 67.7% – a seventeen-point spread that is a workload conversation, not a rounding error.
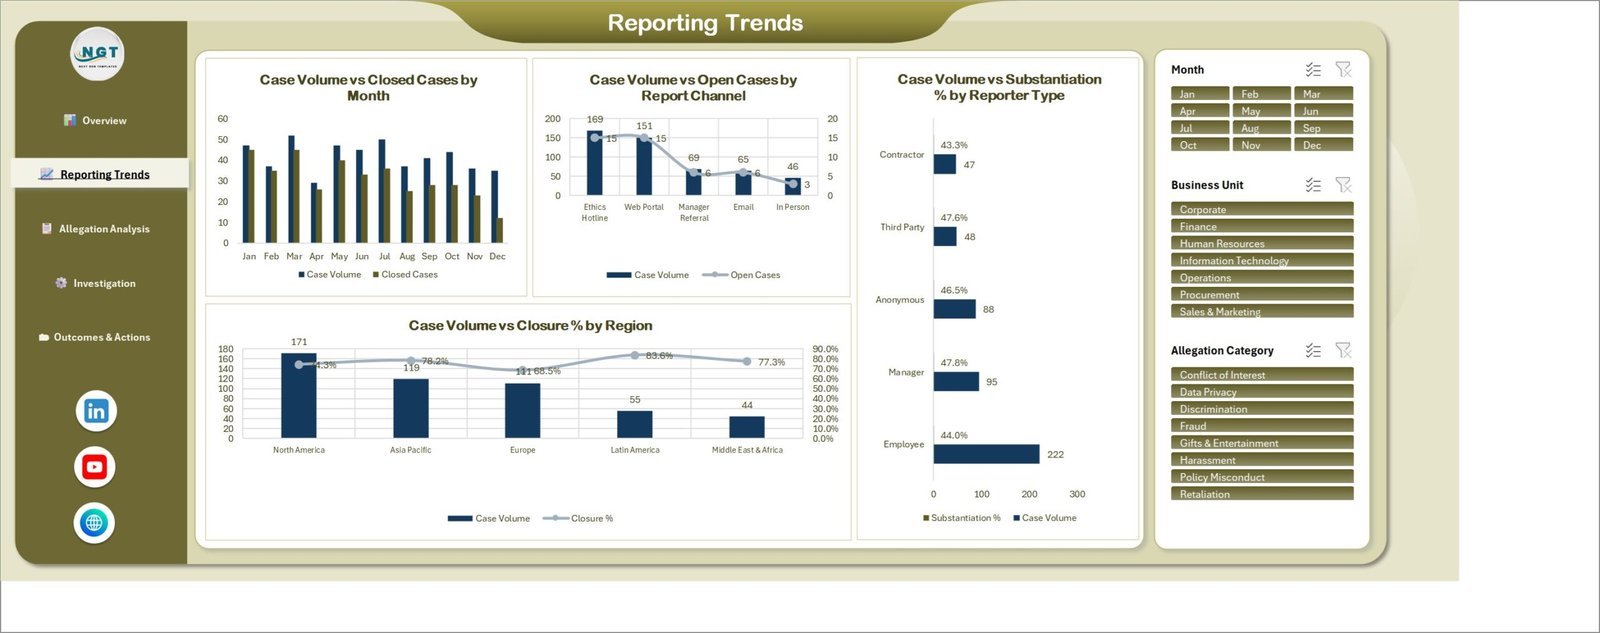
- Reporting-channel analysis. Ethics Hotline 169 cases, Web Portal 151, Manager Referral 69, Email 65 and In Person 46, each with its own open-case count.
- Reporter-type view. Employee 222, Manager 95, Anonymous 88, Third Party 48 and Contractor 47, each with its substantiation rate, so you can see whether anonymous reports actually stand up.
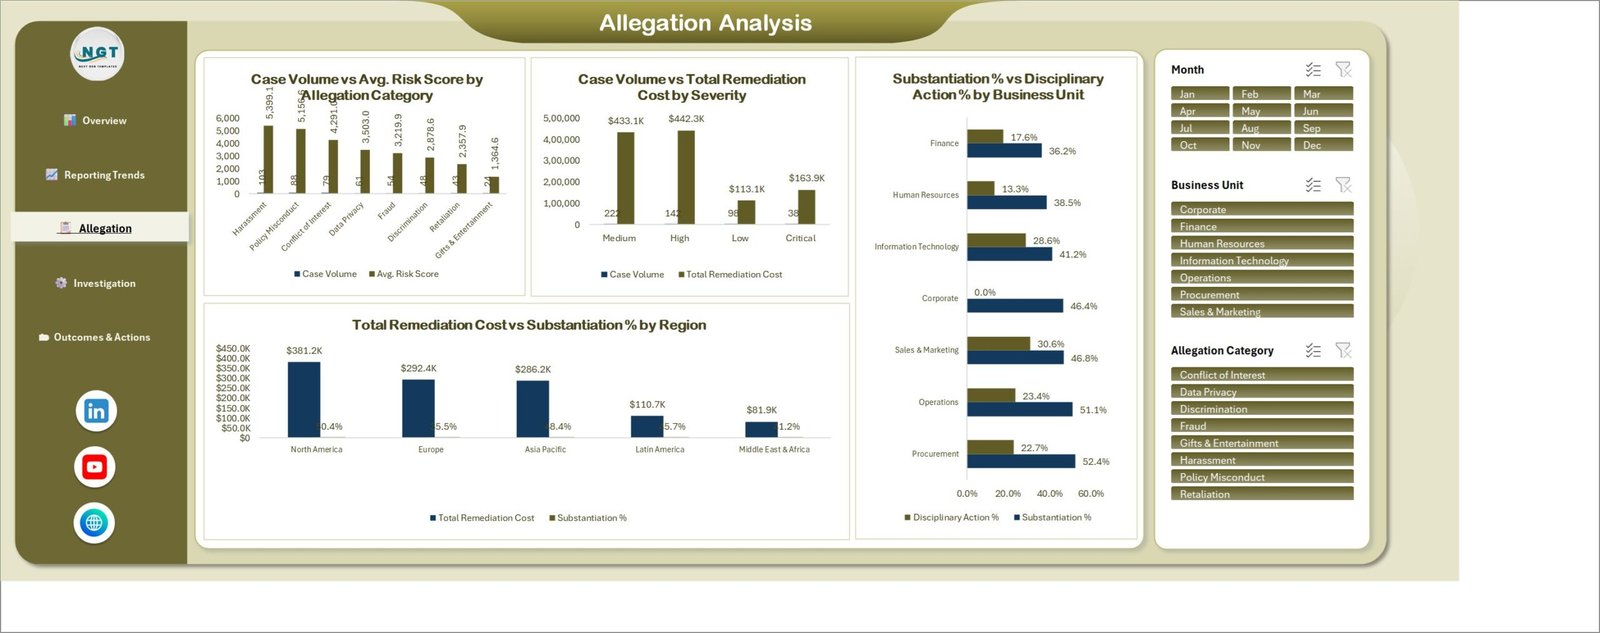
- Severity and cost together. Medium 222 cases at $433.1K, High 142 at $442.3K, Low 98 at $113.1K and Critical 38 at $163.9K – the page where a small number of critical files quietly consumes the budget.
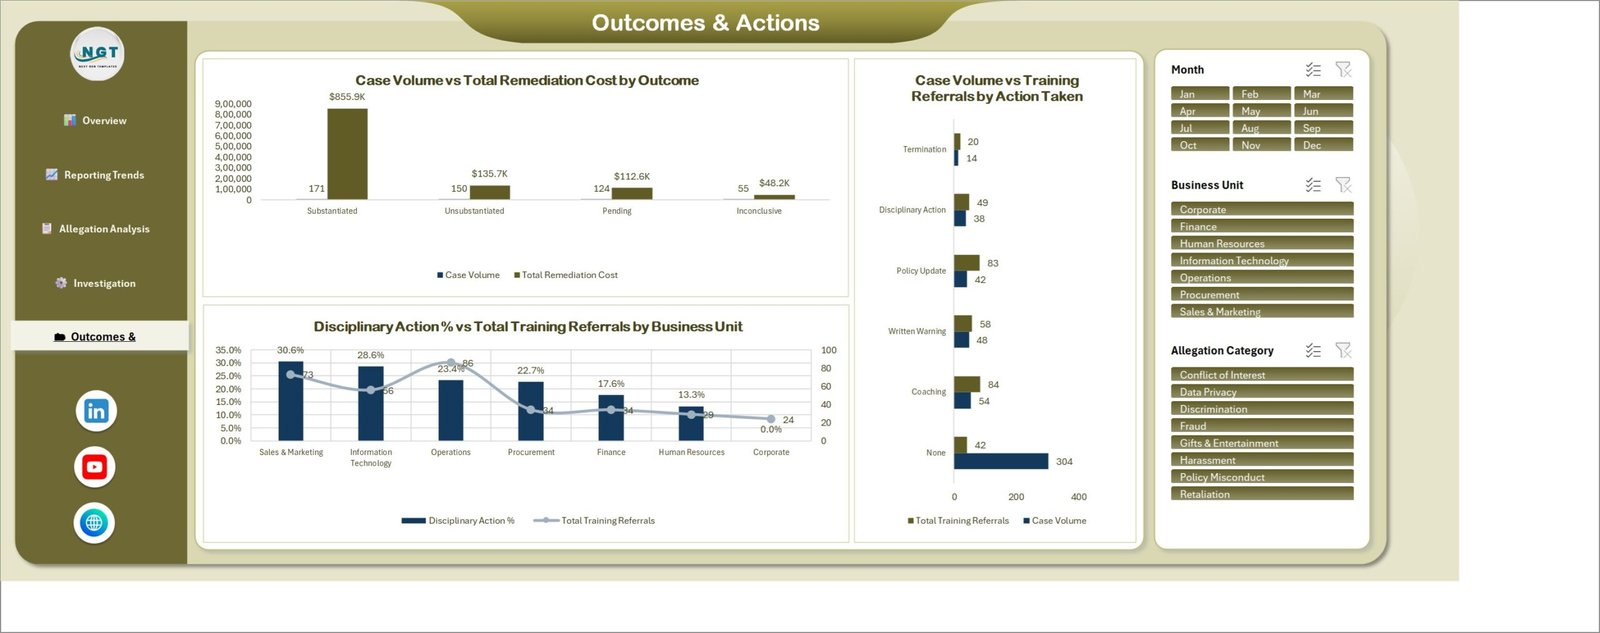
- Outcome and action tracking. Substantiated 171, Unsubstantiated 150, Pending 124 and Inconclusive 55, plus 336 training referrals split across Coaching, Policy Update, Written Warning, Disciplinary Action and Termination.
- Paste your own data. Replace the sample rows, press refresh, and every card, chart and slicer button rebuilds from your values. Corporate Ethics Office Dashboard in Excel
What’s Inside the Corporate Ethics Office Dashboard in Excel
Page 1 – Overview. The five KPI cards, then Case Volume vs Open Cases by Month, the Closure % gauge at 75.2%, Case Volume vs Remediation Cost by Business Unit (Operations 129 cases against $250.8K, Sales & Marketing 101 against $275.1K, Information Technology 66 against $120.9K, Procurement 59 against $163.7K, Human Resources 55 against $143.4K, Finance 52 against $120.0K and Corporate 38 against $78.5K) and Closure % by Investigation Owner.
Page 2 – Reporting Trends. Case Volume vs Closed Cases by Month, Case Volume vs Open Cases by Report Channel, Case Volume vs Substantiation % by Reporter Type and Case Volume vs Closure % by Region, where Latin America closes 83.6% of its 55 cases and Europe only 68.5% of its 111.
Page 3 – Allegation Analysis. Case Volume vs Avg. Risk Score by Allegation Category ranks Harassment 103, Policy Misconduct 88, Conflict of Interest 79, Data Privacy 61, Fraud 54, Discrimination 48, Retaliation 43 and Gifts & Entertainment 24. Beside it, Case Volume vs Total Remediation Cost by Severity and Substantiation % vs Disciplinary Action % by Business Unit, which shows Procurement substantiating 52.4% of its cases while Finance substantiates 36.2%. Total Remediation Cost vs Substantiation % by Region closes the page with North America at $381.2K, Europe $292.4K, Asia Pacific $286.2K, Latin America $110.7K and Middle East & Africa $81.9K.
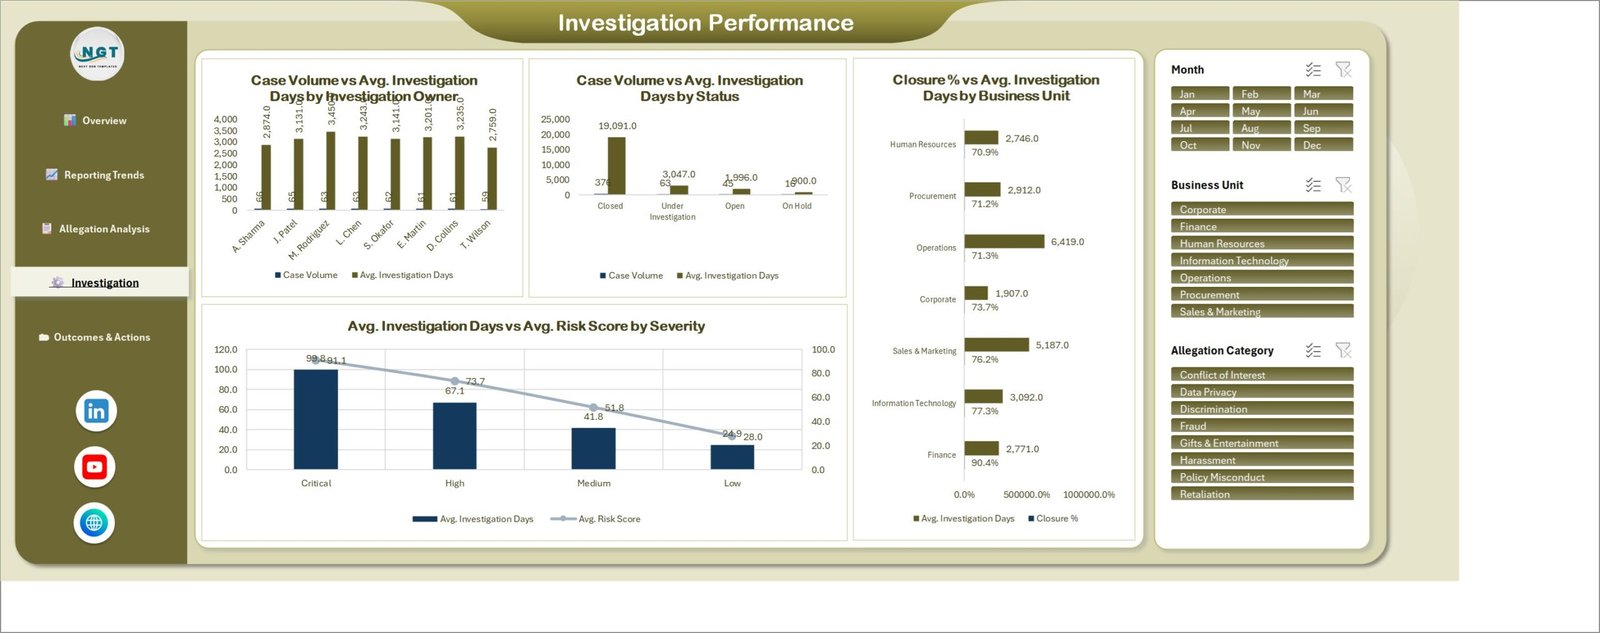
Page 4 – Investigation Performance. Case Volume vs Avg. Investigation Days by Investigation Owner, Case Volume vs Avg. Investigation Days by Status (Closed 376, Under Investigation 63, Open 45, On Hold 16) and Closure % vs Avg. Investigation Days by Business Unit, where Finance closes 90.4% against Human Resources’ 70.9%.
Page 5 – Outcomes & Actions. Case Volume vs Total Remediation Cost by Outcome, where Substantiated cases account for 171 files and $855.9K of the $1.2M spend. Then Disciplinary Action % vs Total Training Referrals by Business Unit and Case Volume vs Training Referrals by Action Taken, which shows 304 cases closing with no action against 54 that end in coaching, 48 in a written warning, 42 in a policy update, 38 in disciplinary action and 14 in termination.
Behind the five pages sit the data sheet you paste into and the pivot layer that feeds every chart. Nothing is hard-coded to the sample rows. Corporate Ethics Office Dashboard in Excel
Corporate Ethics Office Dashboard in Excel vs. Google Sheets vs. Paid GRC Case Software – Where This Fits
| What matters | This Excel dashboard | Google Sheets build | NAVEX / Convercent / EthicsPoint |
|---|---|---|---|
| Cost | $17.99 once | Free tool, days of build time | $8,000-$60,000 per year |
| Platform | Excel 2016+, Mac, 365 | Browser only | Vendor cloud |
| Setup time | Under 20 minutes | 2-5 days to build | 8-16 weeks with vendor onboarding |
| Intake hotline and web portal | No – it reports on intake, it does not receive it | No | Yes, that is the core product |
| Board-ready five-page report pack | Built in | Build it yourself | Yes, often a paid analytics module |
| Remediation cost against case volume | Built in by unit, severity, region and outcome | Build it yourself | Rarely included |
| Investigator closure league table | Built in for 8 owners | Build it yourself | Usually included |
| Real-time team collaboration | Via OneDrive or SharePoint | Native | Native |
| Customisable fields | Add columns and the pivots follow | Yes, you build them | Change requests to the vendor |
| Year-1 cost at 5 users | $17.99 | $0 plus build time | $25,000+ |
Who This Template Is For – and Who It’s Not For
It fits ethics and compliance officers who have to take a quarterly pack to an audit committee, general counsel tracking substantiation and remediation cost by business unit, internal investigation leads balancing eight caseloads, HR business partners looking at harassment and discrimination volumes by unit, and risk teams that already collect case data somewhere and simply cannot report on it.
It does not fit anyone who needs an intake system. This reads a case log – it does not host a whistleblower hotline, receive anonymous reports or manage privileged investigation files. It is not a case-management system of record, it does not provide legal advice, and it should not hold reporter or subject identities. Keep names in your controlled case system and paste anonymised or coded rows into the workbook. If you handle fewer than about thirty cases a year, a single list will serve you better than five report pages. Corporate Ethics Office Dashboard in Excel
How to Use the Corporate Ethics Office Dashboard in Excel
- Download the ZIP, extract it and open the workbook in Excel. Enable editing when prompted.
- Open the data sheet and replace the sample rows with your own cases – date, business unit, region, allegation category, severity, report channel, reporter type, investigation owner, status, outcome, action taken, investigation days, risk score, remediation cost and training referrals. Keep the column headers exactly as shipped.
- Strip identifying details before you paste. Use case references and coded owner initials rather than names.
- Press Ctrl + Alt + F5 to refresh all pivots. Every card, chart and slicer picks up the new rows.
- Use the right-hand slicer rail to filter by Month, Business Unit or Allegation Category. The three slicers are connected across all five pages, so one click re-scopes the whole report.
- Clear every slicer before exporting, then print or export any page to PDF for the audit-committee pack.
Real-World Use Cases
A compliance officer preparing the quarterly audit-committee pack. She filters to the quarter, exports the Overview and Outcomes & Actions pages, and leads with the fact that 171 of 500 cases were substantiated and absorbed $855.9K of the $1.2M remediation spend. The committee stops asking how many reports arrived and starts asking what the substantiated ones cost.
An investigations manager rebalancing caseloads. The Investigation Performance page shows all eight owners carrying 59 to 66 cases each – even on paper – while the closure league table on the Overview page spreads from 85.5% to 67.7%. The problem is not intake volume, it is throughput, and that is a coaching conversation rather than a hiring request.
An HR director defending the hotline budget. Ethics Hotline and Web Portal together account for 320 of the 500 cases, and anonymous reporters substantiate at 46.5% – close to the 44.0% rate for named employees. That single comparison is the argument for keeping anonymous intake open.
Frequently Asked Questions
Does this need macros or any add-in?
No. It is a plain .xlsx workbook built on formulas, pivot tables and slicers. Nothing to enable, nothing to install, and it passes corporate macro blocks – which matters on the locked-down machines compliance teams usually work on.
Which Excel versions does it work in?
Excel 2016, 2019, 2021 and Microsoft 365 on Windows and Mac. Slicers need a desktop version; Excel Online will render the charts but slicer clicks are limited.
Is this a whistleblower hotline or a case management system?
No. It is a reporting layer only. It does not receive reports, does not store investigation files and is not a system of record. Keep intake and case files in your controlled system and paste summary rows into this workbook.
Can I put real reporter and subject names in it?
Please do not. Ethics case data is among the most sensitive an employer holds. Use case references and coded initials, and keep identities in the access-controlled system where they belong. The workbook has no user-level permissions, so anyone with the file sees every row.
Can I change the allegation categories and business units?
Yes. Type your own into the data sheet and refresh. The slicer buttons and every chart axis rebuild from your values, so you are not stuck with the eight sample categories or seven sample units.
Is this the same as your KPI scorecard templates?
No. This is the analytical dashboard – five wide pages driven by slicers, built for exploring a caseload. The KPI dashboard and KPI scorecard lines are a different format with a month picker, target-versus-actual traffic lights and a dedicated trend page.
How many rows can I paste in?
The sample carries 500 cases. Pivot tables handle far more; tens of thousands of rows refresh in a couple of seconds on ordinary hardware.
Can I rebrand it for my organisation?
Yes. The workbook is unlocked. Swap the logo, change the colour palette and edit the page titles. Corporate Ethics Office Dashboard in Excel
Do I get updates?
Yes. Re-download from your account whenever the file is revised. There is no subscription.
About the Author
Built by PK – Microsoft Certified Professional with 15+ years of Excel, Google Sheets, and Power BI experience. Founder of NextGenTemplates, reaching 300K+ subscribers across YouTube channels. Every template is hand-built and tested before release.
Explore Related Templates
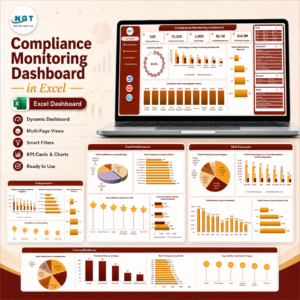
- Compliance Monitoring Dashboard in Excel – the same five-page layout aimed at control testing and policy compliance.
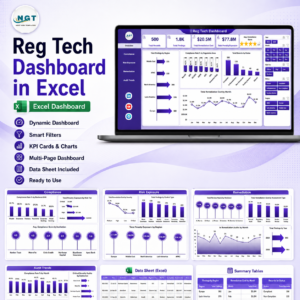
- Reg Tech Dashboard in Excel – regulatory obligations, filings and remediation tracking.
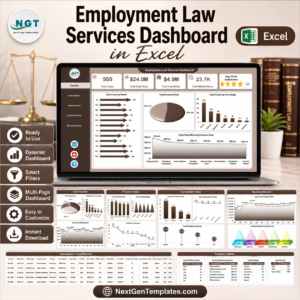
- Employment Law Services Dashboard in Excel – matters, advice volumes and employment tribunal exposure.
- Civil Rights Organizations Dashboard in Excel – complaint intake and casework for advocacy teams.
- Employee Grievance Tracker in Excel – a lightweight single-sheet log if you are not ready for five report pages.
- Browse the full Excel Dashboard category or every MS Excel template.
Get the Corporate Ethics Office Dashboard in Excel for $17.99 instead of $29.99. Instant download, unlocked file, lifetime updates, and a refund if it does not open on your setup. Read the full walkthrough on PK-AnExcelExpert.com.
Last updated: 23 August 2026.































Reviews
There are no reviews yet.