As organizations grow, business travel expenses quickly become complex to manage ✈️💼. Multiple departments, frequent trips, diverse expense categories, and approval delays often result in budget overruns and limited visibility. When finance and HR teams rely on manual spreadsheets or static reports, controlling travel spend becomes reactive and inefficient. That is exactly where the Business Travel Expense Control Dashboard in Google Sheets delivers real value.
The Business Travel Expense Control Dashboard in Google Sheets is a ready-to-use, interactive analytics solution designed to help organizations track, control, and analyze employee travel expenses in a structured and visual way. Instead of reviewing long expense sheets or chasing approvals manually, teams gain a single, centralized dashboard that highlights key travel metrics, cost drivers, and approval efficiency 📊.
Because this dashboard is built in Google Sheets, it combines automation, flexibility, and real-time collaboration, making it ideal for finance teams, HR, and management. As a result, organizations move from reactive expense reviews to proactive travel cost control.
✅ Key Features of Business Travel Expense Control Dashboard in Google Sheets
The Business Travel Expense Control Dashboard in Google Sheets is designed to provide instant visibility into corporate travel spending 🔍.
It displays high-impact KPIs at the top, followed by interactive charts and filters that allow users to drill down into expenses by city, department, employee, and expense type.
Key highlights include:
-
Total Trips and Total Travel Spend tracking
-
Average Trip Duration and Average Approval Time analysis
-
Expense breakdown by city, department, payment mode, and category
-
Identification of high-cost travel patterns
-
Interactive slicers for quick filtering
Because calculations and visuals update automatically, teams reduce manual effort and gain faster insights.
📦 What’s Inside the Business Travel Expense Control Dashboard in Google Sheets
This product includes multiple well-structured analysis pages, each focused on a specific travel expense insight:
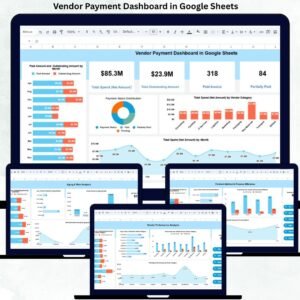
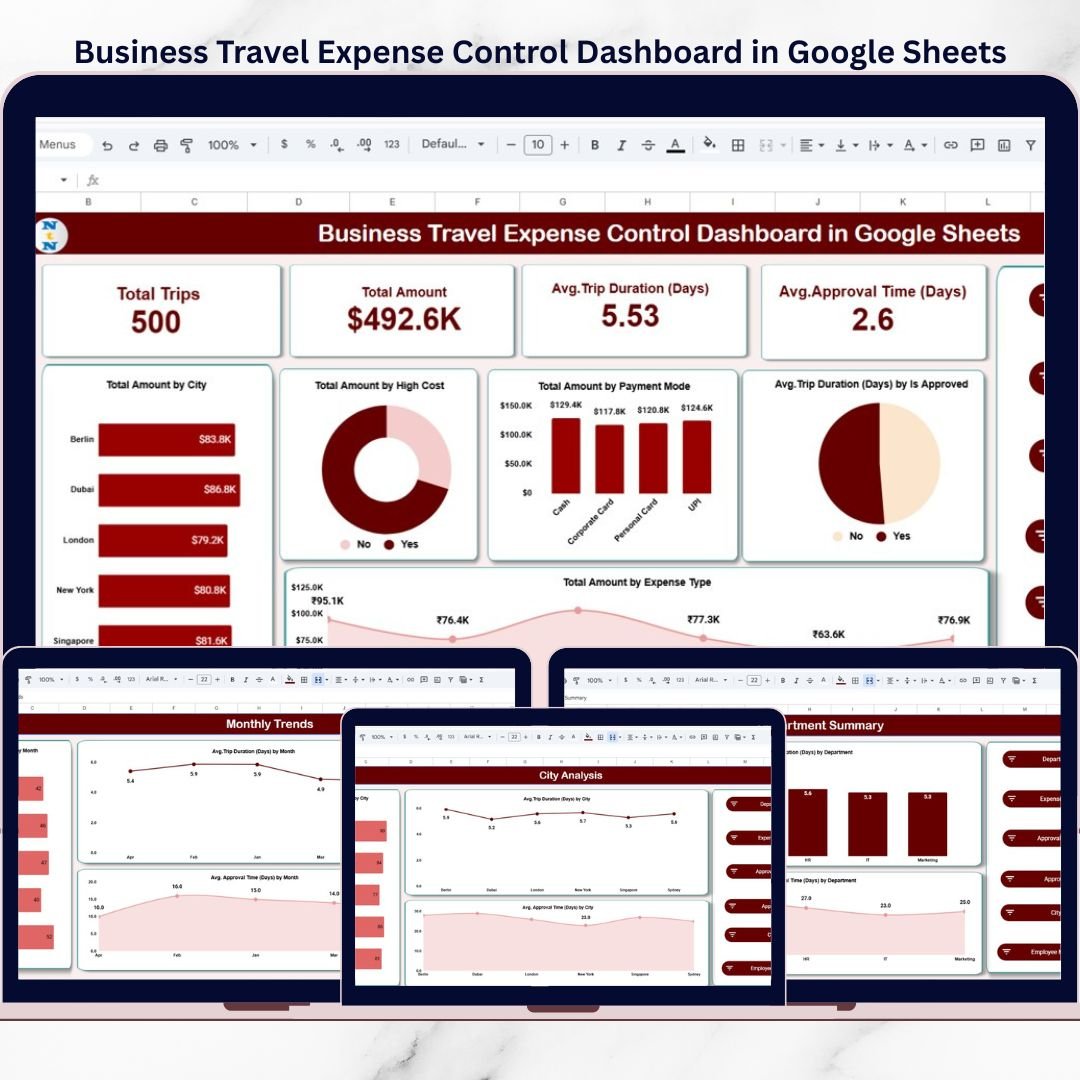
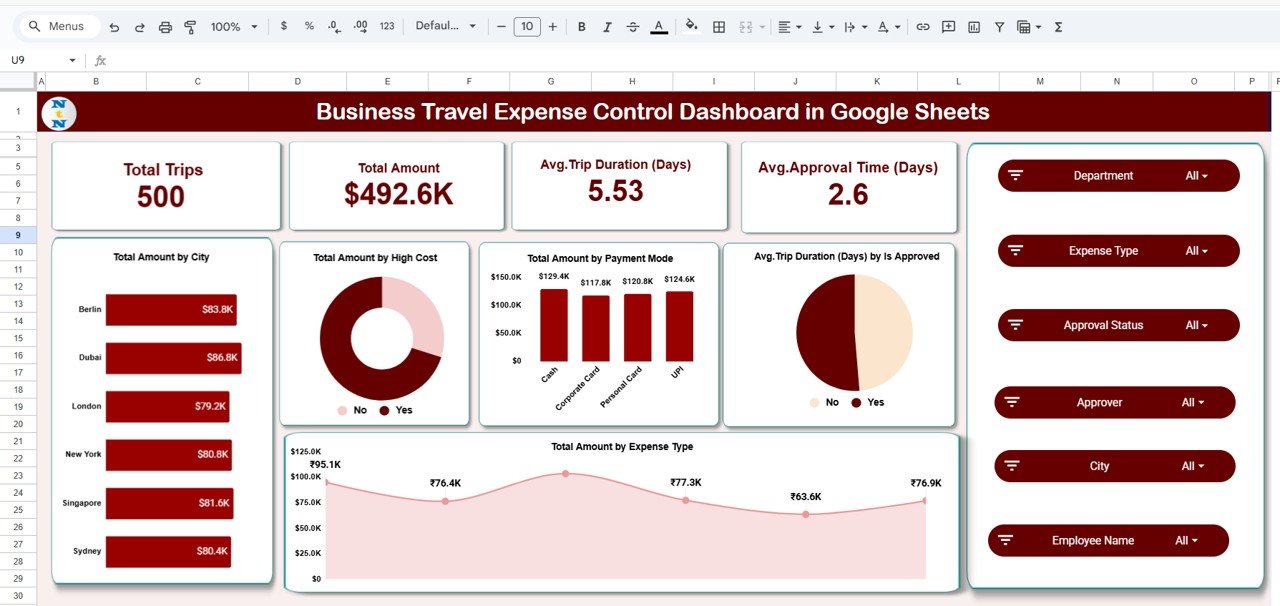
1️⃣ Main Dashboard Page
The Main Dashboard provides a consolidated overview 🧭.
Top-level KPIs displayed:
-
Total Trips
-
Total Amount
-
Average Trip Duration (Days)
-
Average Approval Time (Days)
Key visuals include:
-
Total Amount by City
-
Total Amount by High-Cost Flag
-
Total Amount by Payment Mode
-
Average Trip Duration by Approval Status
-
Total Amount by Expense Type
Interactive slicers allow filtering by:
Department, City, Employee Name, Expense Type, Approval Status, and Approver.
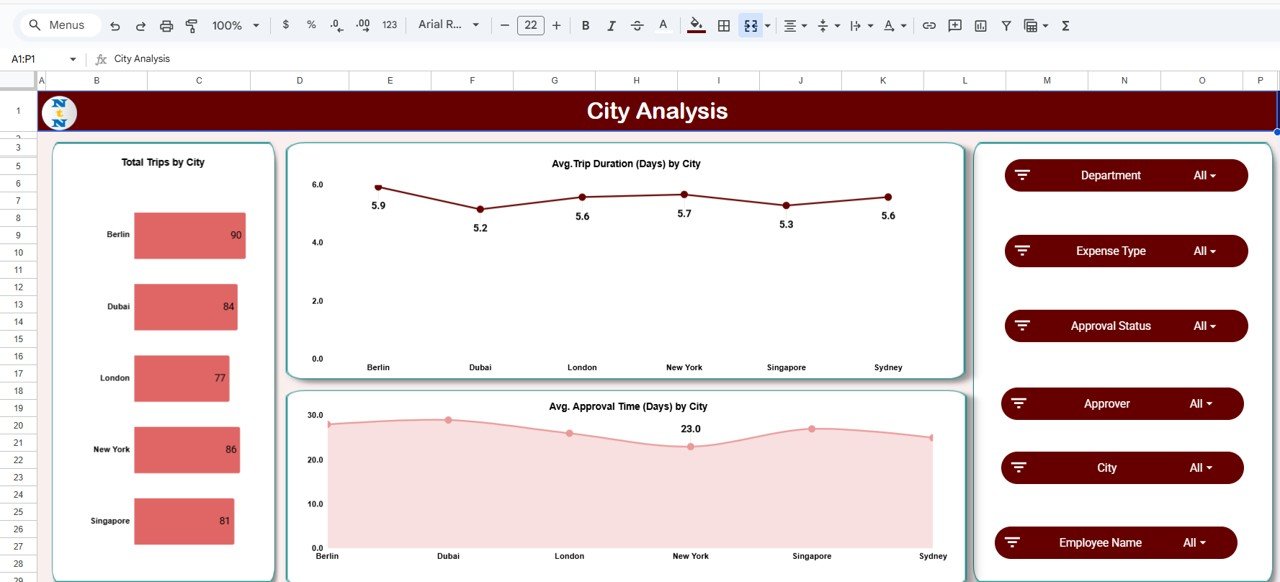
2️⃣ City Analysis Page
The City Analysis Page focuses on location-based cost insights 🌍.
It shows:
-
Total Trips by City
-
Average Trip Duration by City
-
Average Approval Time by City
This helps identify cities with higher travel frequency, longer stays, or slower approvals—supporting better travel planning.
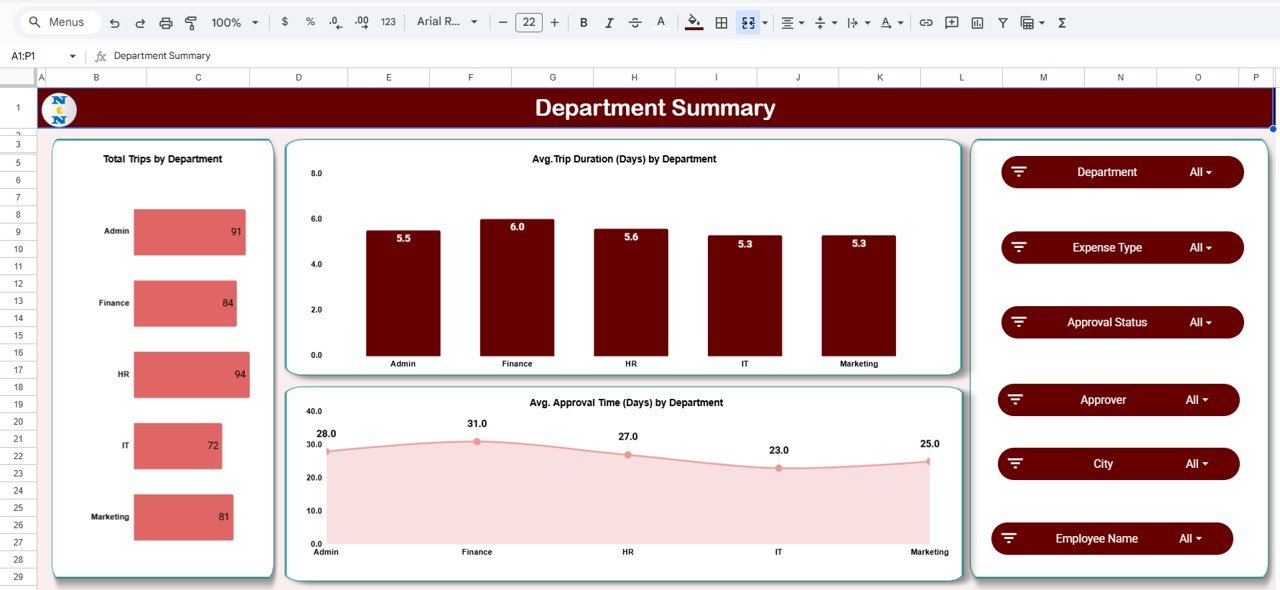
3️⃣ Department Summary Page
The Department Summary Page highlights department-wise travel behavior.
Key metrics include:
-
Total Trips by Department
-
Average Trip Duration by Department
-
Average Approval Time by Department
This page helps management detect departments with excessive travel or approval bottlenecks.
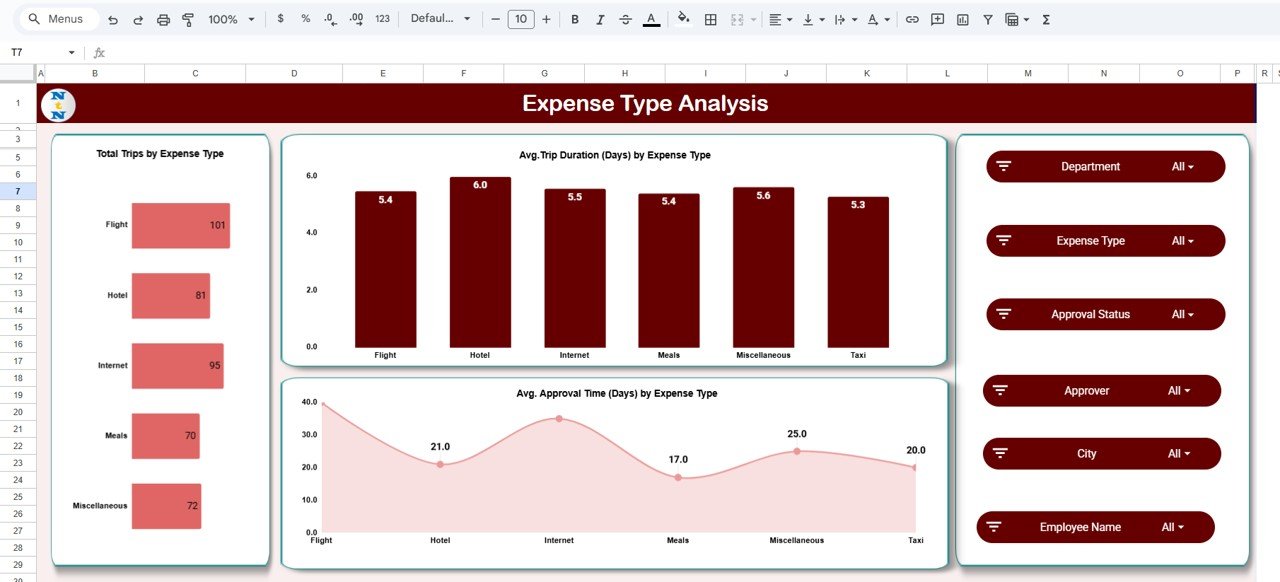
4️⃣ Expense Type Analysis Page
This page breaks down spending by category 💳.
Expense types covered:
Flight, Hotel, Meals, Taxi, Internet, Miscellaneous
Insights include:
-
Total Trips by Expense Type
-
Average Trip Duration by Expense Type
-
Average Approval Time by Expense Type
Finance teams quickly identify categories that require tighter controls.
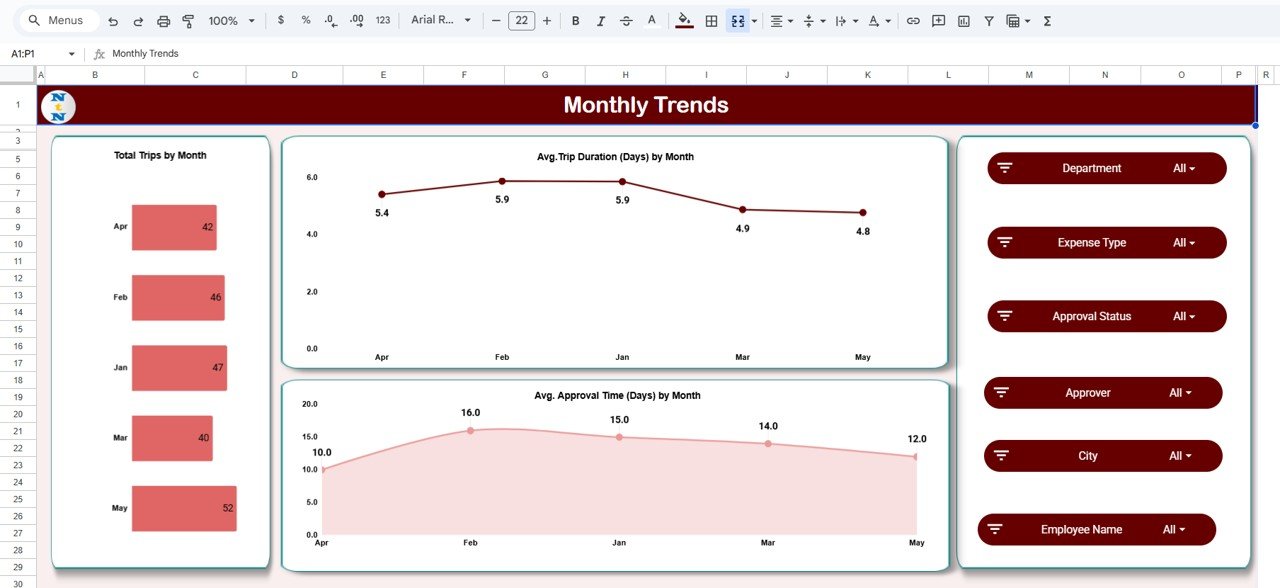
5️⃣ Monthly Trends Page
The Monthly Trends Page focuses on time-based analysis 📆.
It displays:
-
Total Trips by Month
-
Average Trip Duration by Month
-
Average Approval Time by Month
This helps organizations understand seasonal travel patterns and monitor process improvements over time.
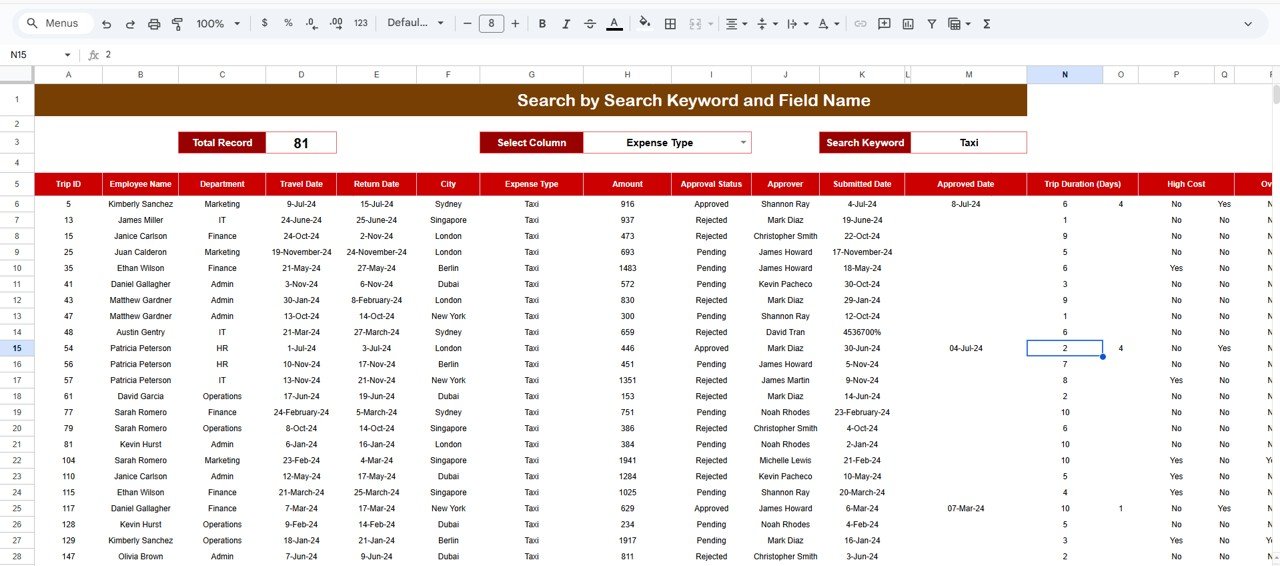
6️⃣ Search & Detailed Records Page
This page supports deep-dive and audit reviews 🔎.
Features include:
-
Search by keyword (e.g., Taxi, City, Employee)
-
Column-based filtering
-
Detailed trip-level records
-
Approval status and duration tracking
Auditors and finance teams can validate individual transactions quickly.
🛠️ How to Use the Business Travel Expense Control Dashboard in Google Sheets
Using the dashboard is simple and intuitive 👍.
First, enter travel and expense data into the structured dataset.
Next, review KPIs and charts on the Main Dashboard.
Then, use slicers to filter by department, city, or expense type.
Finally, analyze trends and detailed records for cost control decisions.
Because everything updates automatically, insights remain current without manual recalculation.
👥 Who Can Benefit from This Business Travel Expense Control Dashboard
This dashboard is ideal for:
-
Finance Teams
-
HR & Administration
-
Travel and Procurement Teams
-
Department Heads
-
Senior Management
It works perfectly for organizations aiming to control travel costs while improving approval efficiency.
🔗 Click here to read the Detailed blog post
Watch the step-by-step video tutorial: