

📈 Construction and Real Estate Market Expansion KPI Dashboard in Excel
In a constantly evolving construction and real estate landscape, market expansion is one of the most critical areas of strategic growth. Whether you’re entering new regions, launching new development projects, or growing your footprint across multiple markets, you need a clear and structured dashboard to track performance and stay aligned with business goals.
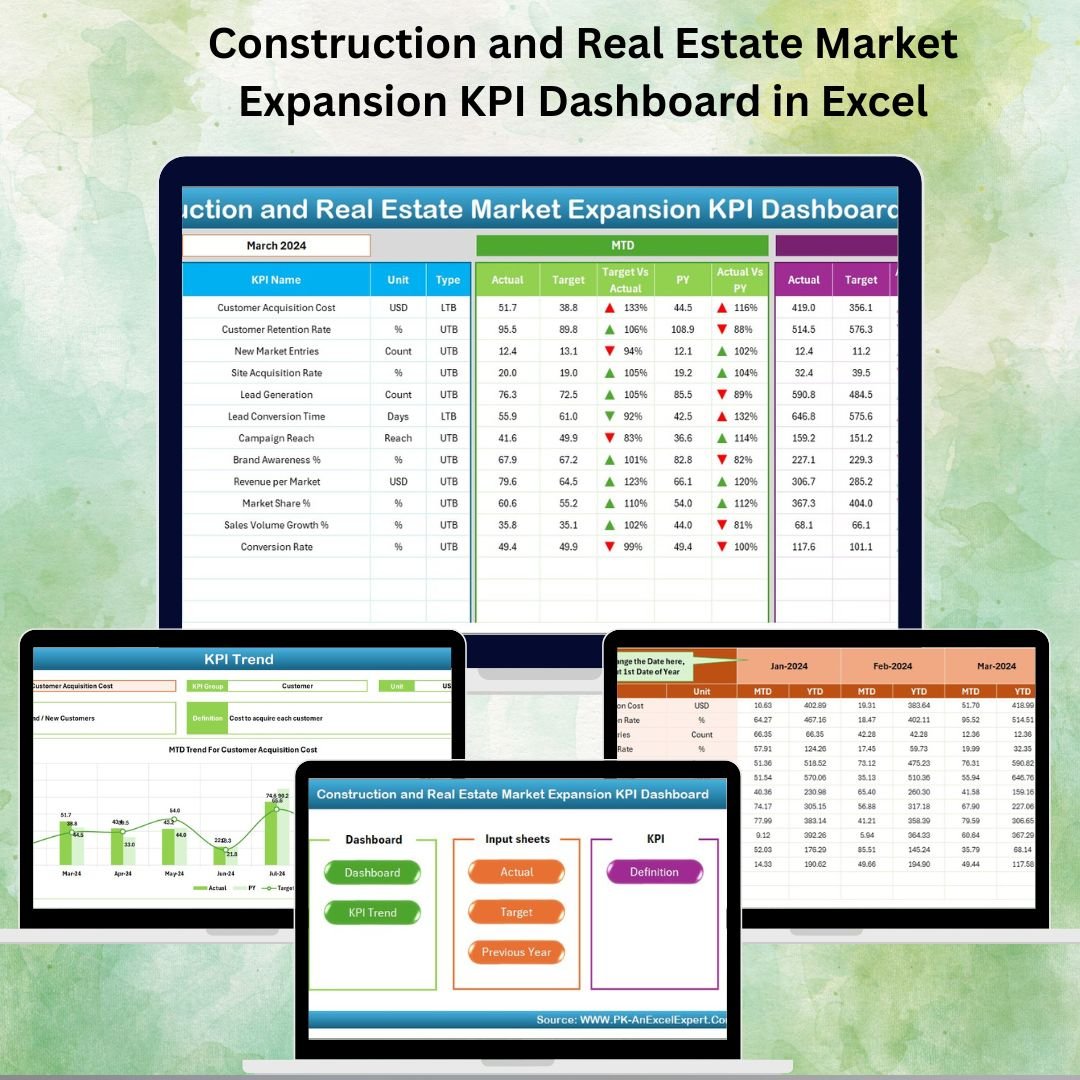
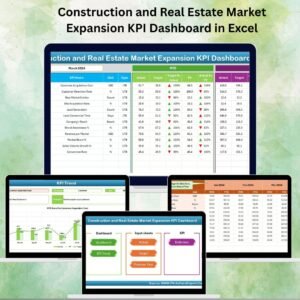
The Construction and Real Estate Market Expansion KPI Dashboard in Excel is a ready-to-use, fully interactive template that helps managers monitor their expansion efforts with real-time insights, target comparisons, and trend analysis. This easy-to-use file consolidates all MTD (Month-to-Date) and YTD (Year-to-Date) performance metrics into one central location — making it simple to identify progress, take corrective action, and support data-driven decision making.
✨ Key Features of the Market Expansion KPI Dashboard
✅ Home Sheet – Quick Navigation Hub
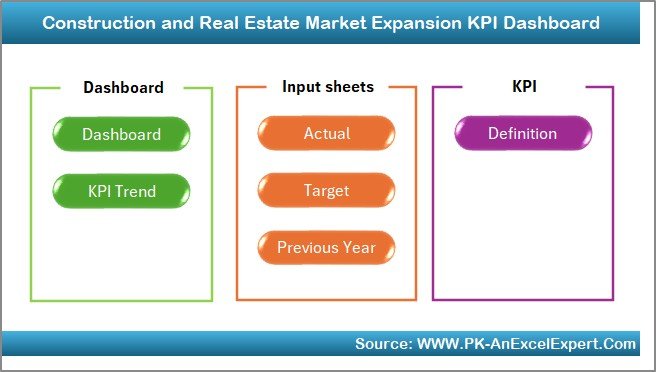
Jump to any worksheet with a single click using 6 clear navigation buttons. No scrolling or searching required.
✅ Dashboard Sheet – Performance Snapshot
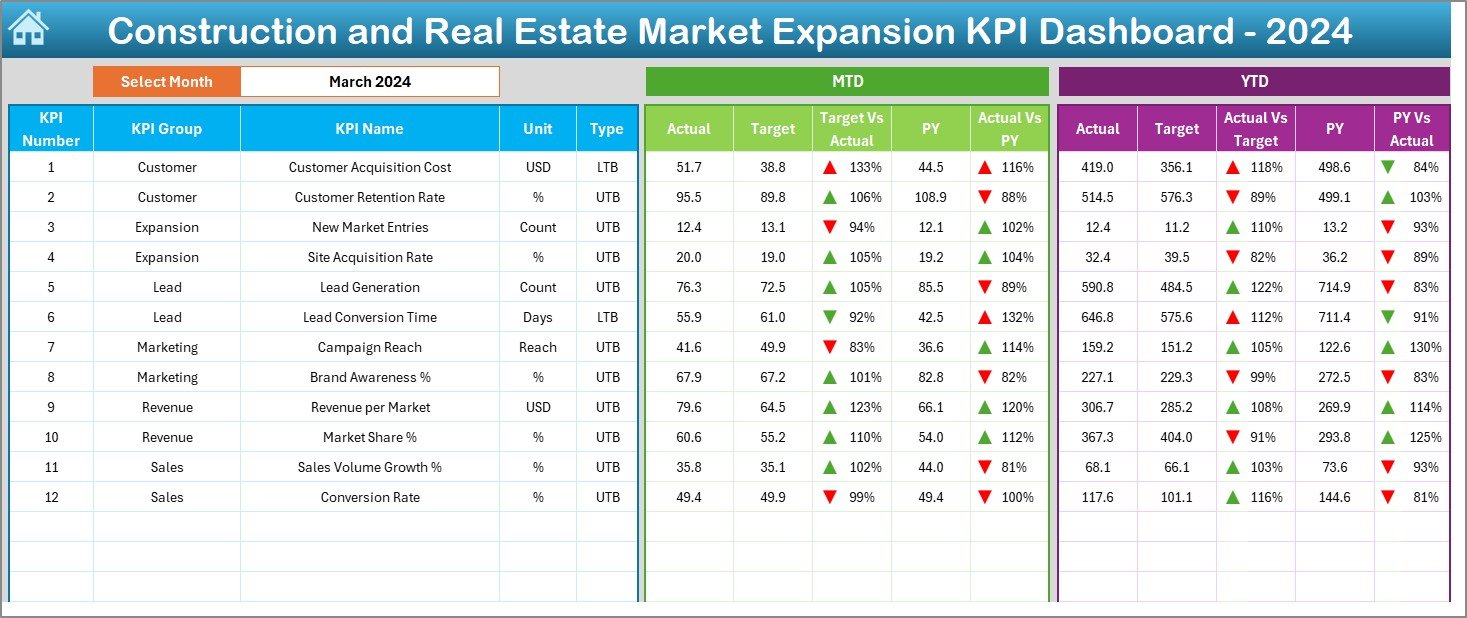
Month drop-down (cell D3) updates all visuals instantly
KPI cards display MTD Actual, Target, and Previous Year values
Arrow-based conditional formatting instantly highlights positive or negative trends
Detailed table includes KPI Number, KPI Group, Name, Unit, Type, Actual, Target, and Previous Year
YTD comparisons for each KPI
✅ KPI Trend Sheet – Deep Dive Analysis
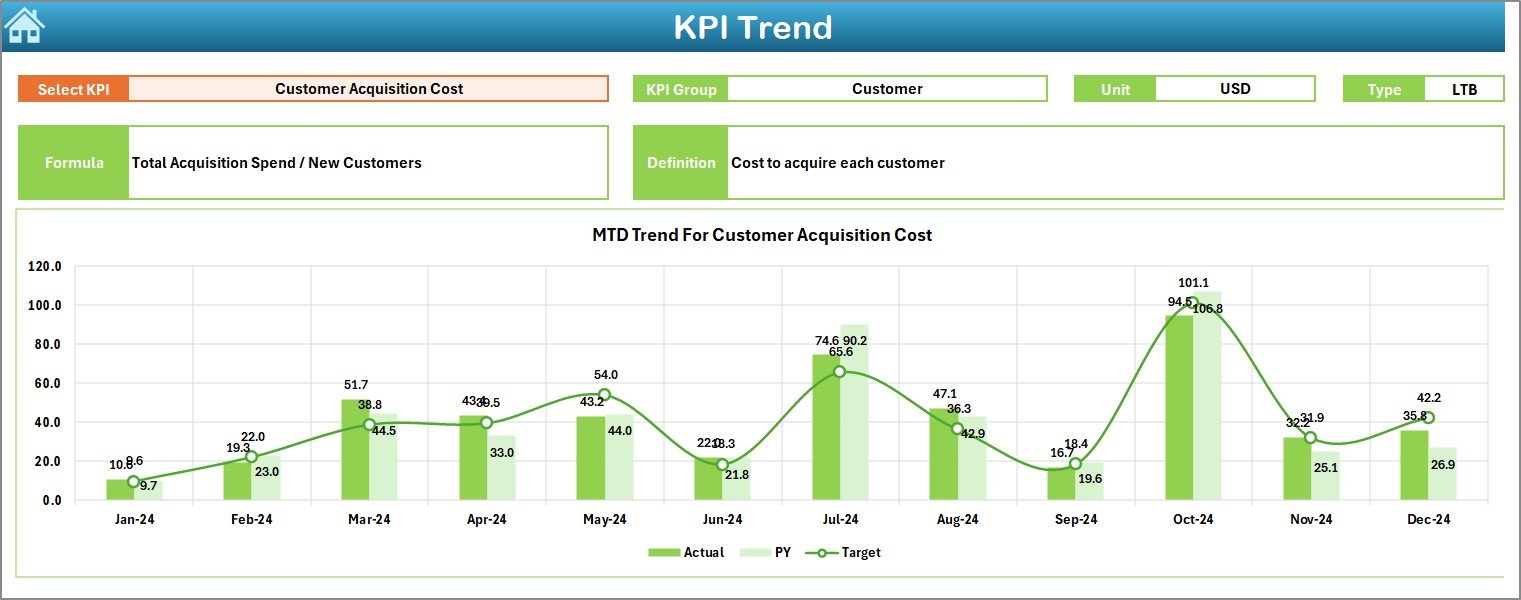
Select any KPI via a drop-down (cell C3)
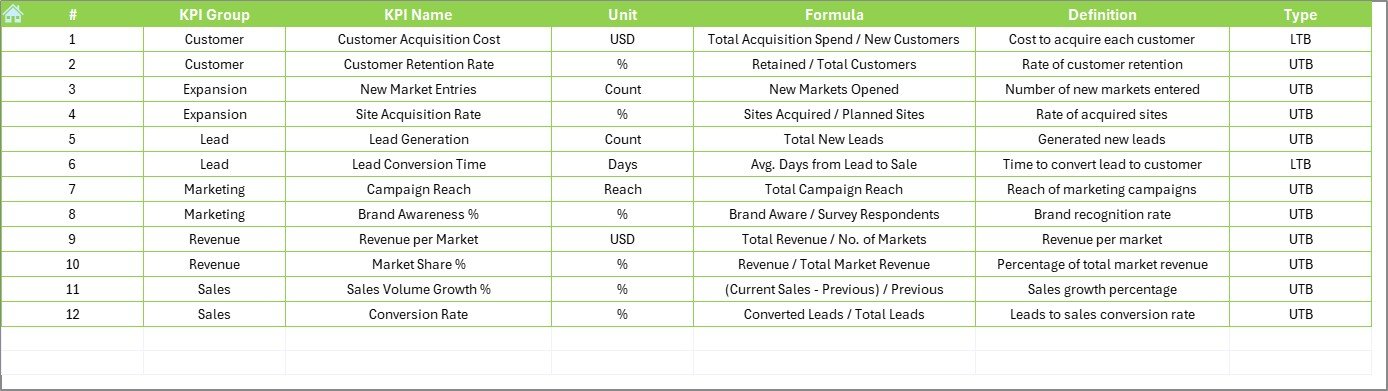
View KPI Group, Unit, Formula, Definition, and Type (LTB or UTB)
Analyze MTD and YTD trend charts for Actual vs Target vs Previous Year
Detect deviations early and take proactive action
✅ Actual Numbers Input Sheet
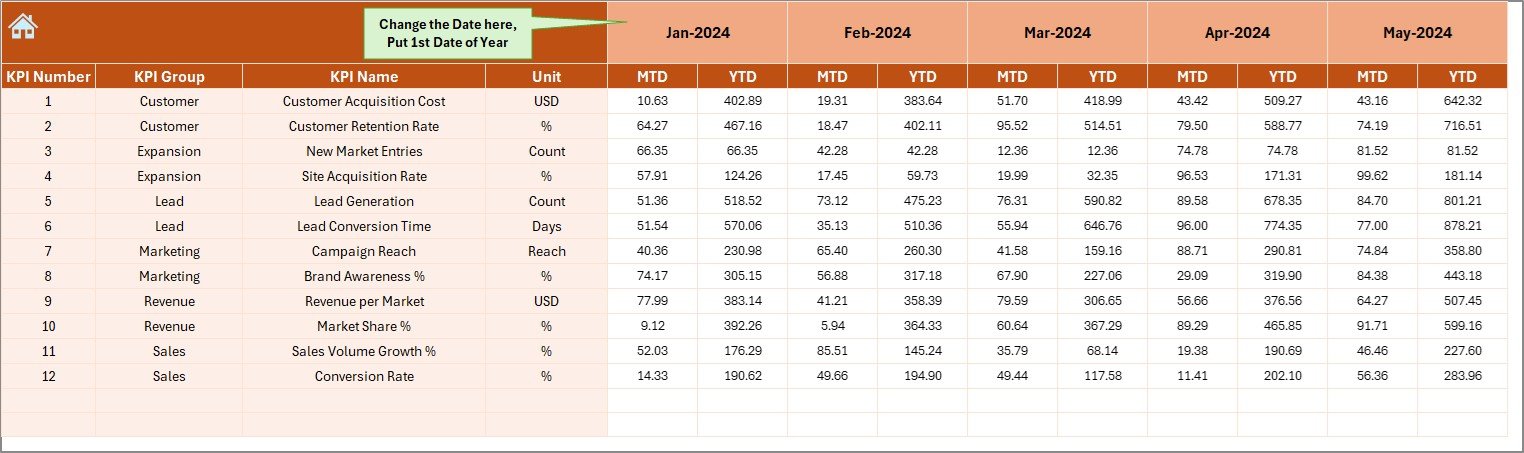
Enter MTD and YTD values for each KPI
Set starting month (cell E1) to adjust month labels automatically
✅ Target Sheet
Store monthly MTD and YTD targets
Automatically compared against actuals on Dashboard and Trend sheets
✅ Previous Year Sheet
Input previous year metrics to enable YoY performance tracking
✅ KPI Definition Sheet
Define KPI Names, Groups, Units, Formulas, Descriptions, and Type (LTB/UTB)
The dashboard pulls all definitions from here to keep everything consistent
🛠 How to Use the Dashboard
Enter KPI Definitions in the KPI Definition sheet
Set Targets in the Target sheet (MTD & YTD per month)
Input Actual Results in the Actual Numbers sheet
Add Previous Year Data for comparison and trend analysis
Select Month on the Dashboard sheet and review performance
Go to the KPI Trend sheet for deeper analysis and pattern detection
Monitor performance regularly and take action based on insights
🎯 Who Can Benefit from This Dashboard
🏗 Construction Companies – Measure expansion performance across regions
🏢 Real Estate Developers – Track progress of new market entries and compare with previous year
📊 Growth & Strategy Teams – Analyze trends and support data-driven expansion plans
📈 Executives & Stakeholders – Review KPI performance in one clean, visual dashboard
🚀 Why Use This Dashboard
📂 Centralized KPI Management
⚙️ No VBA or complex tools required – 100% Excel based
🕒 Real-Time Insights for faster decision making
🎯 Target vs Actual vs Previous Year comparison
📈 Trend Charts for deeper performance evaluation
🔧 Scalable and fully customizable (add/remove KPIs easily)
















Reviews
There are no reviews yet.