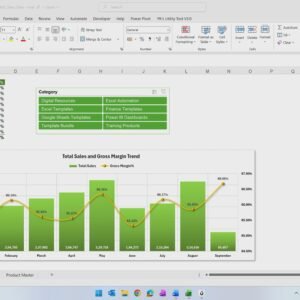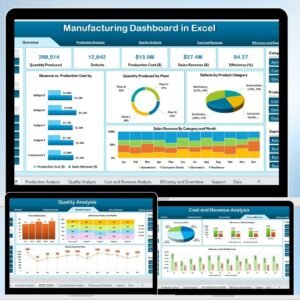
The Merge Queries in Power Query Excel Practice File is a free workbook with a 350-row Sales Data table and a 25-product Product Master across 8 categories. Use it to practise merging two tables on Product code, add Total Cost, Total Sales and Gross Margin columns, and build a PivotTable report that shows 2,005,126 in total sales at a 65.87% gross margin. A completed solution workbook is included so you can check every step.
🌍 Join 8,400+ teams in 40+ countries using NextGenTemplates to replace paid SaaS tools with one-time-purchase Excel, Google Sheets, Power BI and HTML templates.
✅ Free download · No subscription · No macros · Lifetime access
🔑 Key Features of the Merge Queries in Power Query Excel Practice File
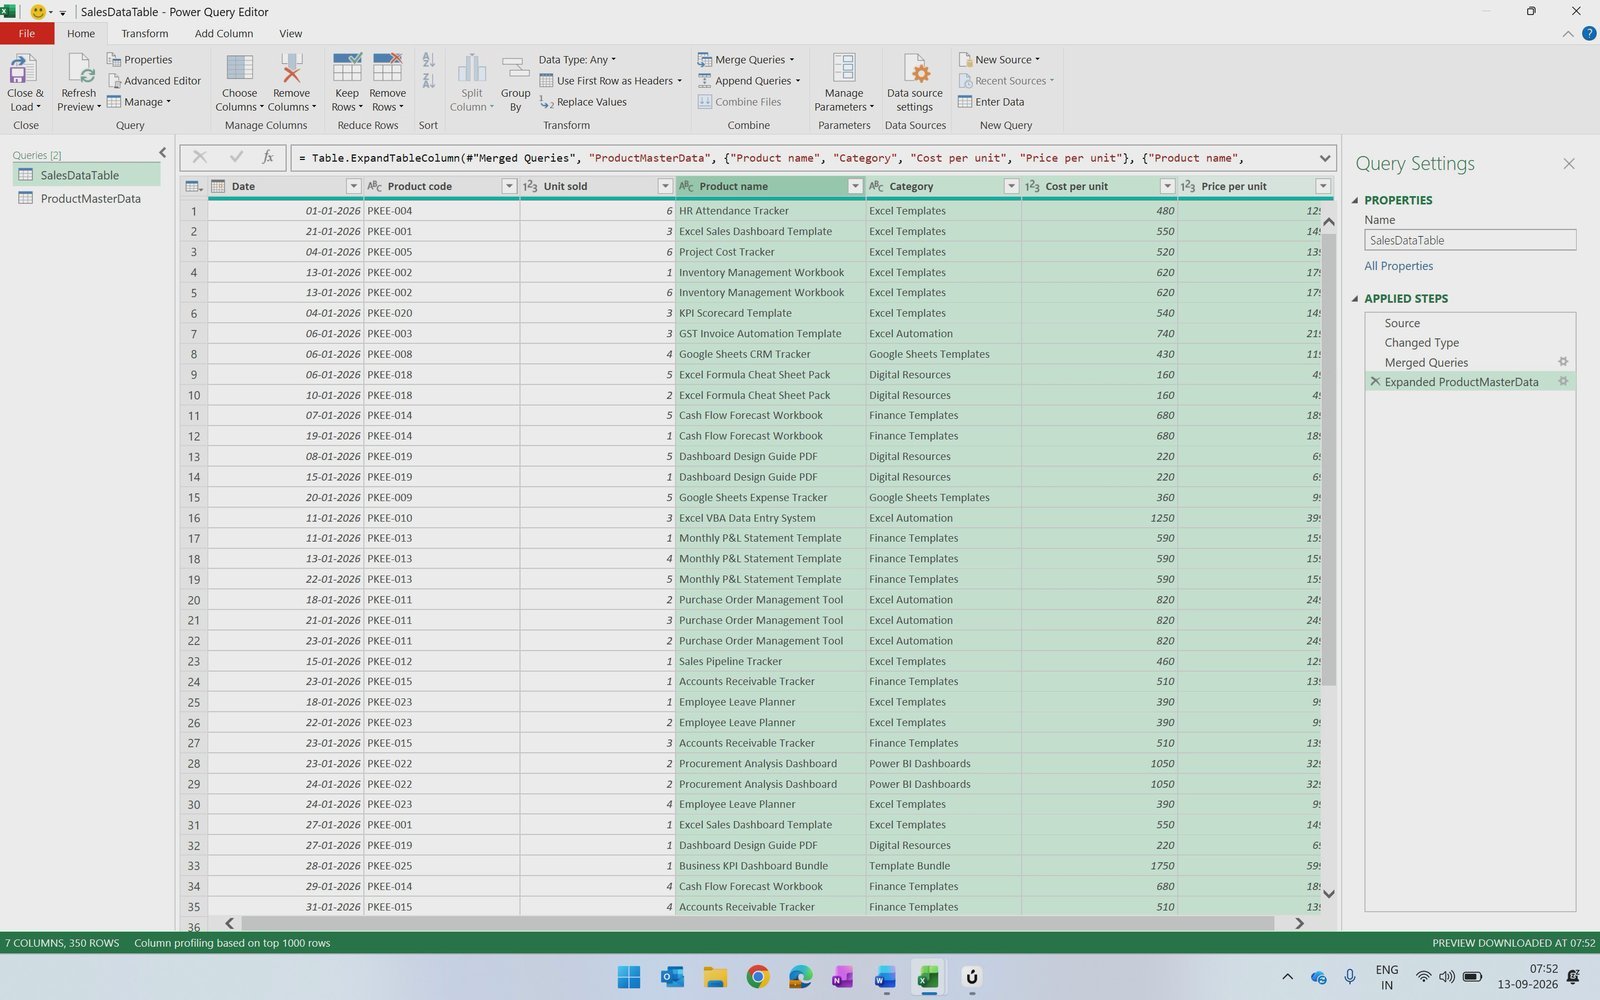
📊 Real merge scenario. The Sales Data table records Date, Product code and Unit sold for 350 transactions from January to September 2026. The Product Master holds Product name, Category, Cost per unit and Price per unit for 25 products, so the merge brings four columns across in one step.
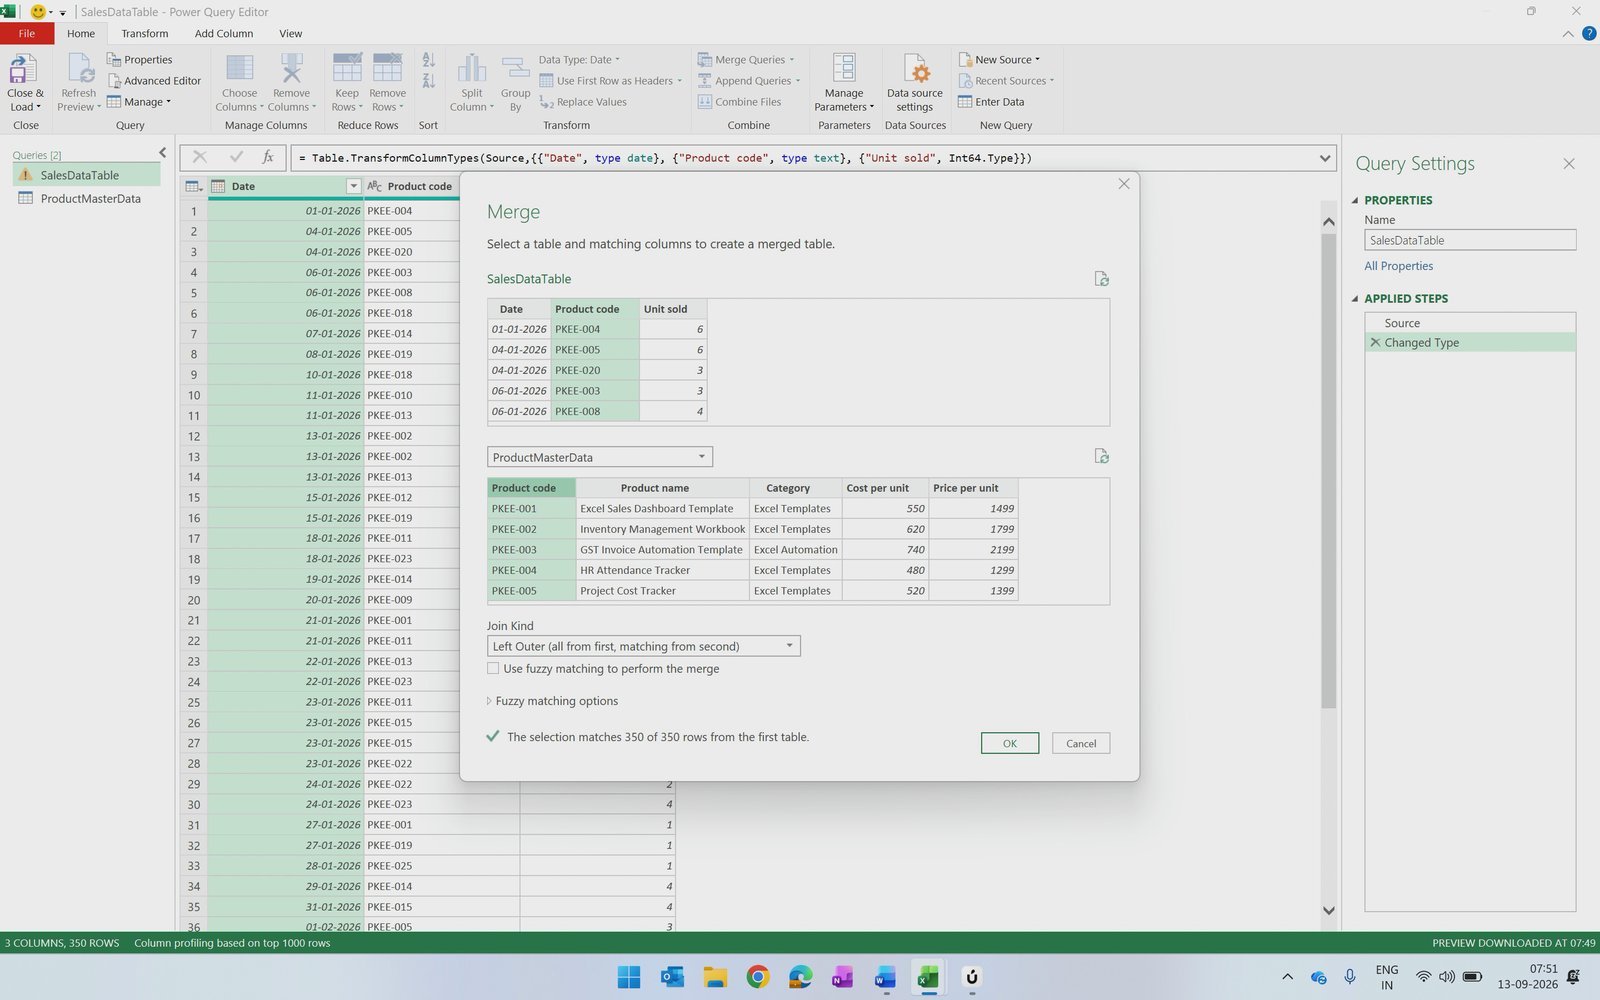
🔗 Merge Queries instead of VLOOKUP. You join both tables on Product code with a Left Outer join. Power Query confirms that 350 of 350 rows match, and the merged table refreshes automatically when you add new sales rows.
🧮 Calculated columns in Power Query. Practise Add Column › Standard › Multiply and Subtract to create Total Cost (Unit sold × Cost per unit), Total Sales (Price per unit × Unit sold) and Gross Margin (Total Sales − Total Cost).
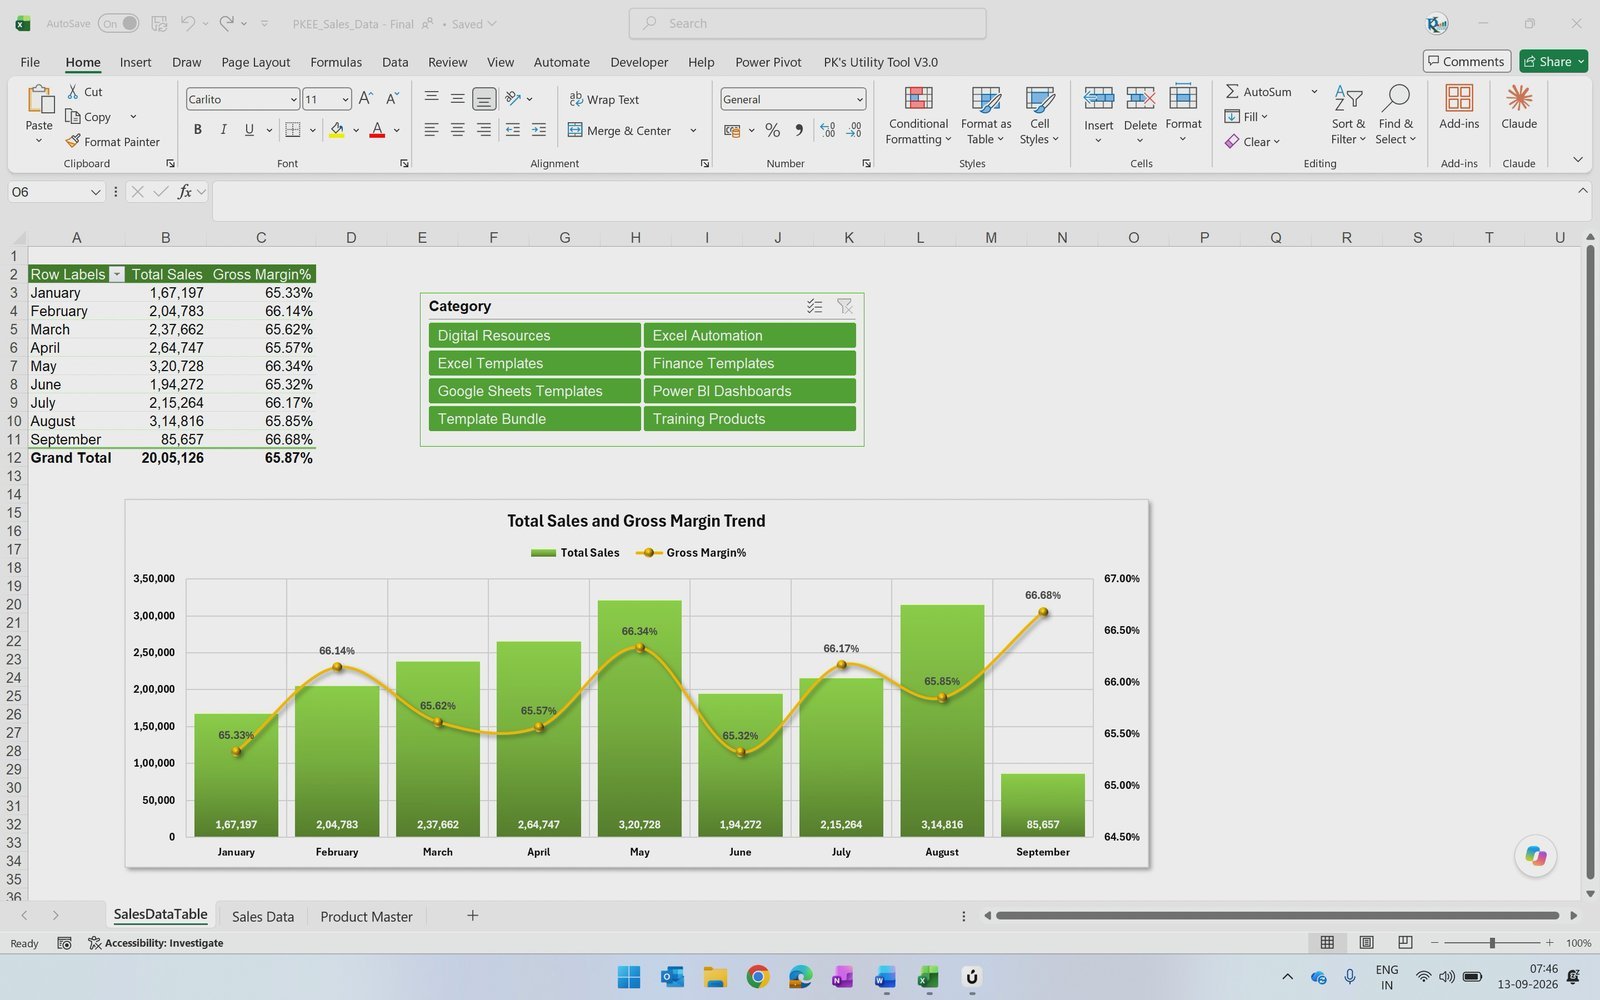
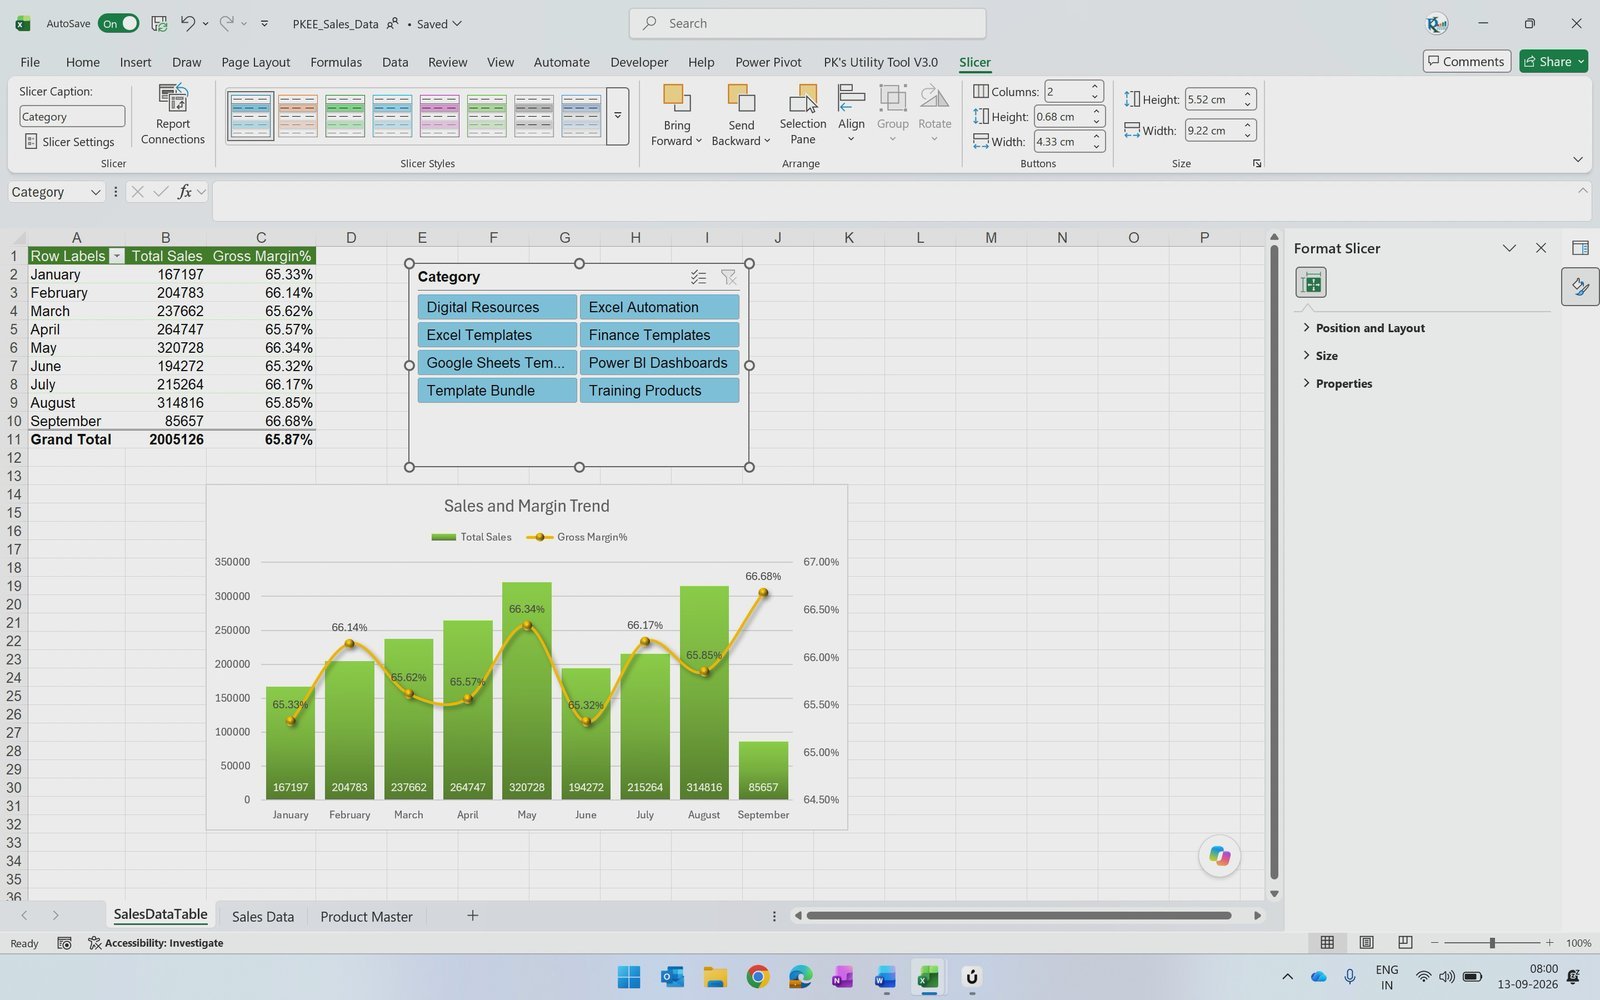
📈 Report-ready output. Load the query to a PivotTable, add a Gross Margin % calculated field, and build a Total Sales and Gross Margin trend combo chart filtered by a Category slicer.
📘 Built-in guidance. A Read Me sheet lists the 9 practice steps in order, and the Solution workbook contains the finished queries, PivotTable, chart and slicer.
🎥 Watch the Video Tutorial
https://www.youtube.com/watch?v=0VNj1PRIV8o
Video Overview
In this 14-minute tutorial, PK starts with two normal ranges and converts them to tables named SalesDataTable and ProductMasterData. He loads the sales table to Power Query, changes the Date column to Date only, and adds the Product Master query by editing the Source step to Excel.CurrentWorkbook(). He then uses Home › Merge Queries to join both tables on Product code, expands Product name, Category, Cost per unit and Price per unit without the column prefix, and adds Total Cost, Total Sales and Gross Margin columns with the Standard Multiply and Subtract commands. After adding Year and Month name columns, he loads the result to a PivotTable, creates a Gross Margin % calculated field, builds a combo chart with the margin line on a secondary axis, and finishes with a Category slicer that filters the whole report.
📦 What’s Inside the Merge Queries in Power Query Excel Practice File
Practice File: Sales Data and Product Master
The start workbook contains the Sales Data sheet (Date, Product code, Unit sold) and the Product Master sheet (Product code, Product name, Category, Cost per unit, Price per unit) as normal ranges, exactly as they appear at the start of the video, plus a Read Me sheet with the practice steps.
The Merge Step
The Merge dialog matches Product code in both tables with a Left Outer join. The status line confirms that the selection matches 350 of 350 rows from the first table.
The Merged Table
After expanding the merged column, every sales row shows Product name, Category, Cost per unit and Price per unit, ready for the Total Cost, Total Sales and Gross Margin calculations.
Solution Workbook: Sales and Margin Report
The solution file includes the finished PivotTable with Total Sales and Gross Margin% by month, a Sales and Margin Trend combo chart and a two-column Category slicer.
📊 Power Query Merge vs. VLOOKUP / XLOOKUP vs. Paid BI Tools — Where This Fits
| Feature | Merge Queries in Power Query (this practice file) | VLOOKUP / XLOOKUP formulas | Paid BI tools (Tableau / Qlik) |
|---|---|---|---|
| Cost | ✅ Free with Excel 2016+ / Microsoft 365 | ✅ Free with Excel | $15–70 per user per month |
| Platform | ✅ Excel desktop | Excel | Separate application |
| Setup time | ✅ About 15 minutes with this file | Minutes per column | Hours to days |
| Columns brought across in one step | ✅ All selected columns | One formula per column | ✅ Yes |
| Refresh when data grows | ✅ Refresh All | Copy formulas down | ✅ Yes |
| Join types | ✅ Six join kinds | Left match only | ✅ Yes |
| Formulas stored in the sheet | ✅ None | Thousands on large data | Not applicable |
| Load to PivotTable | ✅ Direct | Manual | Own visuals |
| Year-1 cost at 5 users | ✅ $0 extra | $0 extra | $900–4,200 |
For analysts who want refreshable joins without paying for a separate BI tool, merging queries in Power Query sits in the sweet spot, and this free practice file is the fastest way to learn it.
👥 Who This Template Is For — and Who It’s Not For
✅ This practice file is built for:
- Excel users who still combine tables with VLOOKUP and want a refreshable alternative
- Sales and finance analysts who report monthly sales and gross margin by product category
- Students and trainees learning Power Query, PivotTables and combo charts
❌ This practice file is NOT for:
- Excel 2010/2013 users without the Power Query add-in installed
- Teams looking for a finished, fully designed multi-page dashboard rather than a learning file
⚙️ How to Use the Merge Queries in Power Query Excel Practice File
- Download and unzip the file, then open Merge-Queries-Power-Query-Practice-File.xlsx.
- Convert both ranges to tables with Ctrl + T and name them SalesDataTable and ProductMasterData.
- Load SalesDataTable with Data › From Table/Range and set the Date column to Date.
- Duplicate the query, change Source to Excel.CurrentWorkbook() and select ProductMasterData.
- Use Home › Merge Queries on Product code with a Left Outer join and expand the product columns.
- Add Total Cost, Total Sales and Gross Margin with Add Column › Standard.
- Add Year and Name of Month, then Close & Load To a PivotTable Report.
- Create the Gross Margin % calculated field, the combo chart and the Category slicer, then compare with the Solution file.
💼 Real-World Use Cases
Anita is a sales analyst at a 40-person distributor. Every month she used to paste the new order export and drag six VLOOKUPs down thousands of rows. After practising with this file she merges the order table with her product list in Power Query, so her margin report updates with one click on Refresh All.
Rahul runs finance for an online template store. He keeps product cost and price in a master list and wants gross margin by category. Using the same merge, calculated columns and Gross Margin % field shown here, he builds a monthly margin trend with a category slicer for his partners.
Maria teaches an Excel data analysis course. She hands this free practice file to her students because the Read Me steps, realistic data and solution workbook let them learn Power Query merges without setting up data from scratch.
❓ Frequently Asked Questions
Is the Merge Queries in Power Query Excel Practice File really free?
Yes. The Merge Queries in Power Query Excel Practice File is a free download on NextGenTemplates. The ZIP contains the practice workbook with Sales Data and Product Master, a Read Me sheet with nine steps, and a completed solution workbook with the queries, PivotTable, chart and slicer.
Which Excel version do I need for this practice file?
The Merge Queries in Power Query Excel Practice File works in Excel 2016, 2019, 2021 and Microsoft 365 for Windows, where Power Query is built in under Data › Get & Transform Data. Excel 2010 and 2013 need Microsoft’s free Power Query add-in. No macros are used.
How long does it take to complete the practice?
Most users finish the Merge Queries in Power Query Excel Practice File in 15 to 30 minutes by following the Read Me steps or the 14-minute video tutorial. Converting the tables and merging the queries takes about five minutes; the rest is the PivotTable, chart and slicer.
How does merging queries compare with VLOOKUP?
Merging queries in Power Query brings several columns across in one refreshable step and stores no formulas in the sheet, while VLOOKUP needs a separate formula for each column. This practice file shows the merge on 350 rows with 350 of 350 matches, then builds the report from the merged table.
What does the solution workbook include?
The solution workbook in the Merge Queries in Power Query Excel Practice File contains the SalesDataTable and ProductMasterData queries, the merged and expanded table, Total Cost, Total Sales and Gross Margin columns, a PivotTable with a Gross Margin % calculated field, a Sales and Margin Trend combo chart and a Category slicer.
Can I use my own data with this file?
Yes. Replace the Sales Data and Product Master rows with your own transactions and product list, keeping the same column names, then click Data › Refresh All. The merge, calculated columns, PivotTable and chart in the Merge Queries in Power Query Excel Practice File update automatically.
👤 About the Author
Built by PK — Microsoft Certified Professional with 15+ years of Excel, Google Sheets, and Power BI experience. Founder of NextGenTemplates, reaching 300K+ subscribers across YouTube channels (@PKAnExcelExpert, @NextGenTemplates, @NeoTechNavigators). Every template is hand-built and tested before release.
🔗 Explore Related Templates
📊 Ready for a finished sales report? The DIY Craft Stores Dashboard in Excel and Channel Development Teams Dashboard in Excel are multi-page workbooks with slicers and pivot charts.
🧾 Recording sales by hand? The Garment Shop Sales Data Entry System in Excel gives you a form-based sales register.
🗂️ Browse all Excel Dashboard Templates.
📖 Click here to read the Detailed Blog Post
🎥 Visit our YouTube channel for step-by-step video tutorials
👉 YouTube.com/@PK-AnExcelExpert
📅 Last updated: September 2026