

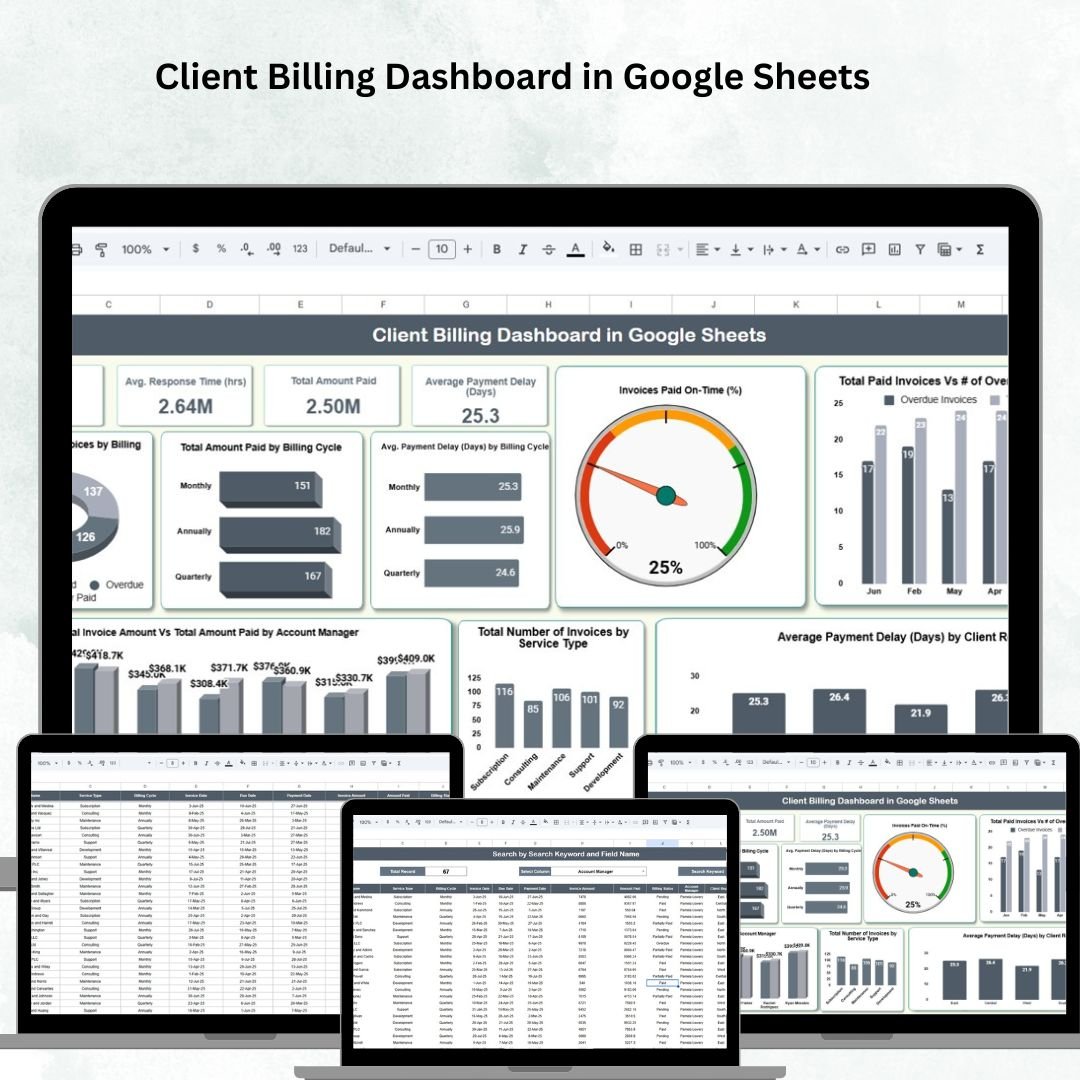

Managing client billing and payments is one of the most critical responsibilities for finance teams. Missed invoices, delayed payments, and lack of visibility can lead to cash flow issues and inefficient financial planning. To solve this, we created the Client Billing Dashboard in Google Sheets — a ready-to-use, collaborative solution that helps you track invoices, monitor payments, and analyze billing performance all in one place. 📊💰
With real-time updates and visual charts, this dashboard provides actionable insights into billing efficiency, overdue payments, and client performance, empowering finance teams to stay proactive and ensure timely revenue collection. ✅
🔑 Key Features of the Client Billing Dashboard
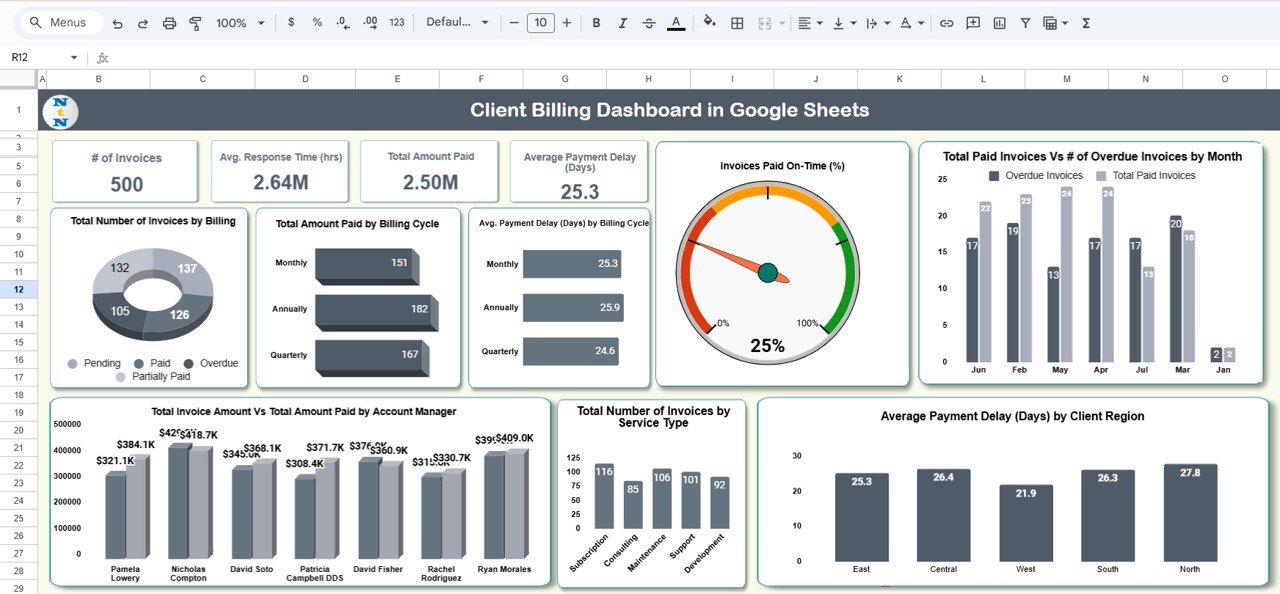
📋 Dashboard Sheet Tab
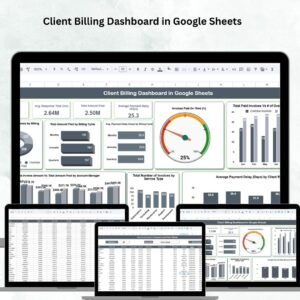
Cards for quick billing KPIs:
of Invoices
Total Invoice Amount
Total Amount Paid
Average Payment Delay (Days)
Charts for in-depth analysis:
Total Invoices by Billing Status (Paid, Pending, Overdue)
Total Amount Paid by Billing Cycle (monthly/quarterly)
Average Payment Delay by Billing Cycle
On-Time Payment %
Paid vs Overdue Invoices by Month
Payment Delay by Client Region
Invoice Amount vs Amount Collected by Account Manager
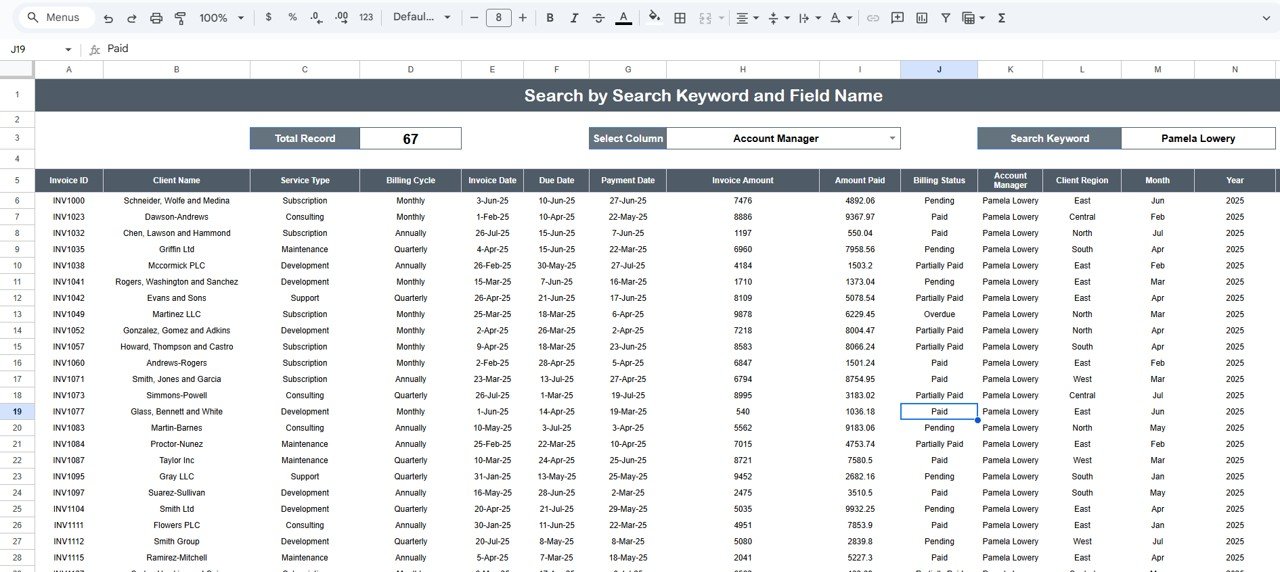
🔍 Search Sheet Tab
Search by Keyword or Field Name
Filter invoices by client, account manager, billing cycle, or payment status
Instantly locate specific records without scrolling through large datasets
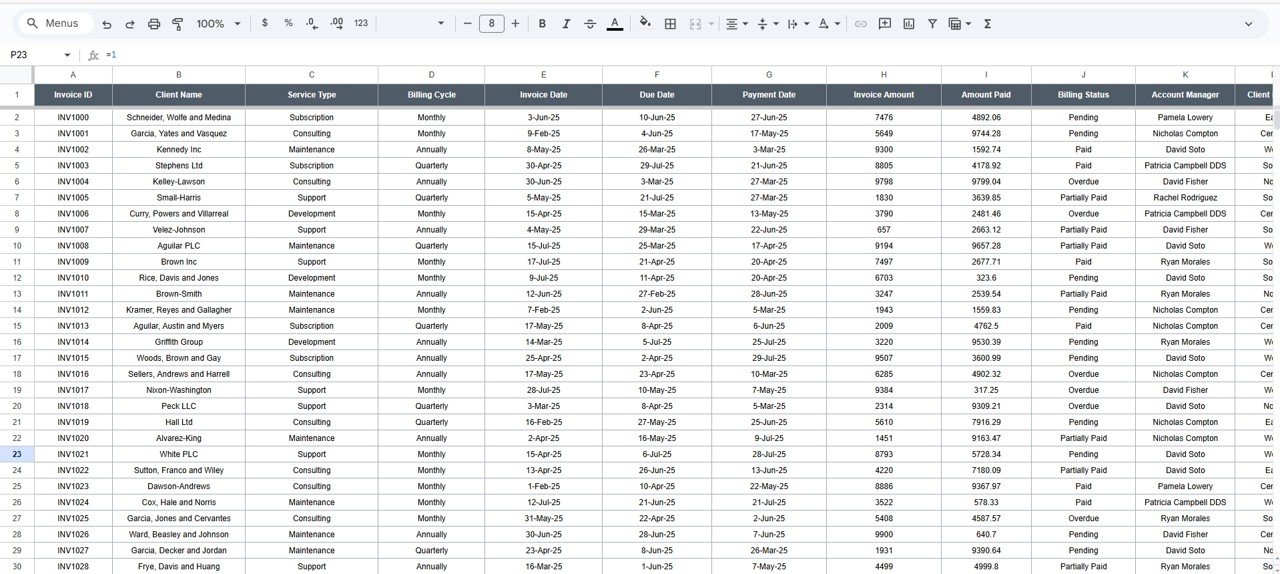
📑 Data Sheet Tab
Structured data entry for:
Invoice Number, Client Details, Amount, Cycle, Status
Payment Date, Amount Paid, Delay Days
Account Manager, Client Region
Updates here reflect automatically in all charts and reports
📦 What’s Inside the Dashboard?
When you download this template, you’ll get:
✅ Interactive Dashboard – Cards and charts for billing insights
✅ Search Sheet – Keyword-based quick filters for invoice records
✅ Data Sheet – Structured entry for invoices and payments
✅ Pre-Filled Sample Data – To help you get started instantly
✅ Auto-Refreshing Reports – Charts and KPIs update automatically
✅ Customizable Fields – Adapt categories, billing cycles, and statuses
🧑💼 Who Can Benefit from This Dashboard?
🎯 Finance Teams – Monitor invoices, payments, and overdue accounts
🎯 Account Managers – Track client billing performance directly
🎯 Executives – Gain visibility into collection efficiency and cash flow
🎯 Large Enterprises – Handle thousands of invoices with scalable reporting
🎯 SMEs & Startups – Affordable and easy billing management solution
🧪 How to Use the Client Billing Dashboard
Enter Invoice Data – Record invoices and payments in the Data Sheet
View Dashboard – Instantly track overdue payments, on-time invoices, and delays
Search & Filter – Use the Search Sheet to find specific client or invoice details
Monitor Trends – Review monthly and cycle-based performance patterns
Take Action – Identify overdue invoices and follow up with clients
No coding or advanced tools are required — just plug in your data and get insights instantly. 🚀
🌟 Why Choose This Dashboard?
Centralized Billing Management – All invoices in one sheet
Real-Time Insights – Dashboards update automatically
On-Time Payment Tracking – Spot trends by client or region
Improved Accountability – Compare account manager performance
Cash Flow Optimization – Reduce payment delays with timely insights
Scalable & Customizable – Suitable for all business sizes
With the Client Billing Dashboard in Google Sheets, you’ll save time, improve financial visibility, and boost revenue collection efficiency. 🌟
🔗 Click here to read the Detailed blog post
Watch the step-by-step video Demo:
🔗 Visit our YouTube channel to learn step-by-step video tutorials
Compatibility and Requirements
- Works in Google Sheets with a free Google account and a web browser. Nothing to install.
- The Dashboard sheet charts update from the Data sheet. Google’s guide to adding and editing a chart helps if you want to change one.
Frequently Asked Questions
Which sheets are in the Client Billing Dashboard?
Three: a Dashboard sheet with KPI cards and charts, a Search sheet and a Data sheet. Sample data is filled in so you can see how it works.
Which KPI cards are on the Dashboard sheet?
Number of invoices, total invoice amount, total amount paid and average payment delay in days.
What do I enter for each invoice?
Invoice number, client details, amount, billing cycle, status, payment date, amount paid, delay days, account manager and client region. The charts and cards update from these rows.
How do I find one client’s invoices?
Use the Search sheet. You can search by keyword or field name and filter invoices by client, account manager, billing cycle or payment status.
Can I compare account managers?
Yes. One chart shows invoice amount vs amount collected by account manager, and another shows payment delay by client region.
Related Client Billing Templates
- Client Billing Dashboard in Excel: the same dashboard in Excel.
- Client Billing Dashboard in Power BI: the same topic in Power BI.
- Client Billing and Payment Tracker in Google Sheets: log billing and payments row by row.
- Client Billing & Invoice Management Dashboard in Google Sheets: another billing view in Google Sheets.
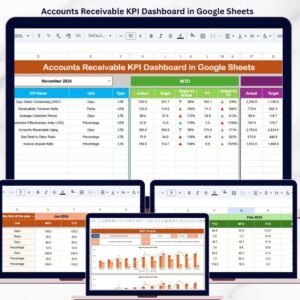
- Accounts Receivable KPI Dashboard in Google Sheets: track receivables against targets.
Browse all Google Sheets dashboards or the Google Sheets financial tools.








Reviews
There are no reviews yet.