

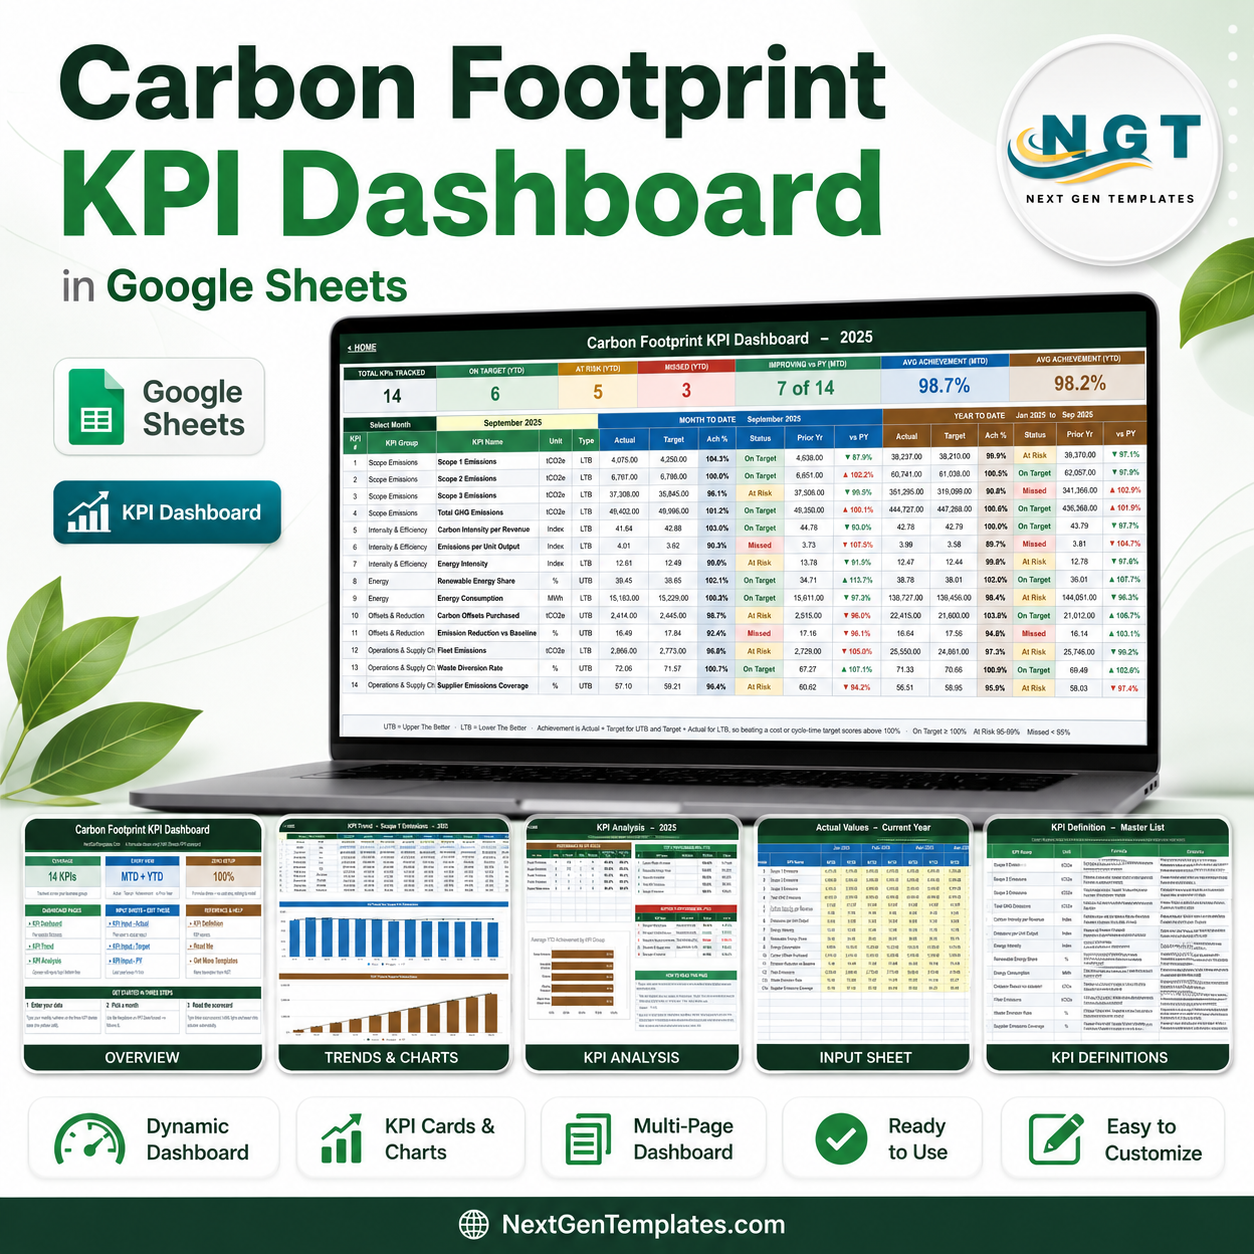
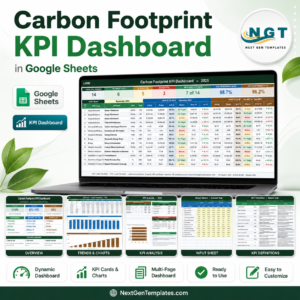
A carbon footprint KPI dashboard in Google Sheets that reports 14 emissions KPIs across 12 months on 6 pages, with month-to-date and year-to-date results, traffic lights and prior-year comparison on every single row. This is the month-picker KPI scorecard build: you type your numbers on three input sheets, choose a month from one dropdown, and the whole workbook re-reads itself. Built and shipped by NextGenTemplates, where more than 300,000 subscribers already follow our template channels. Every page you see below is a screenshot of the actual file, not a mock-up – and if it does not open and calculate exactly as shown, tell us and we will make it right.
Key Features of the Carbon Footprint KPI Dashboard in Google Sheets
- 14 KPIs in five groups – Scope Emissions (4), Intensity & Efficiency (3), Energy (2), Offsets & Reduction (2) and Operations & Supply Chain (3).
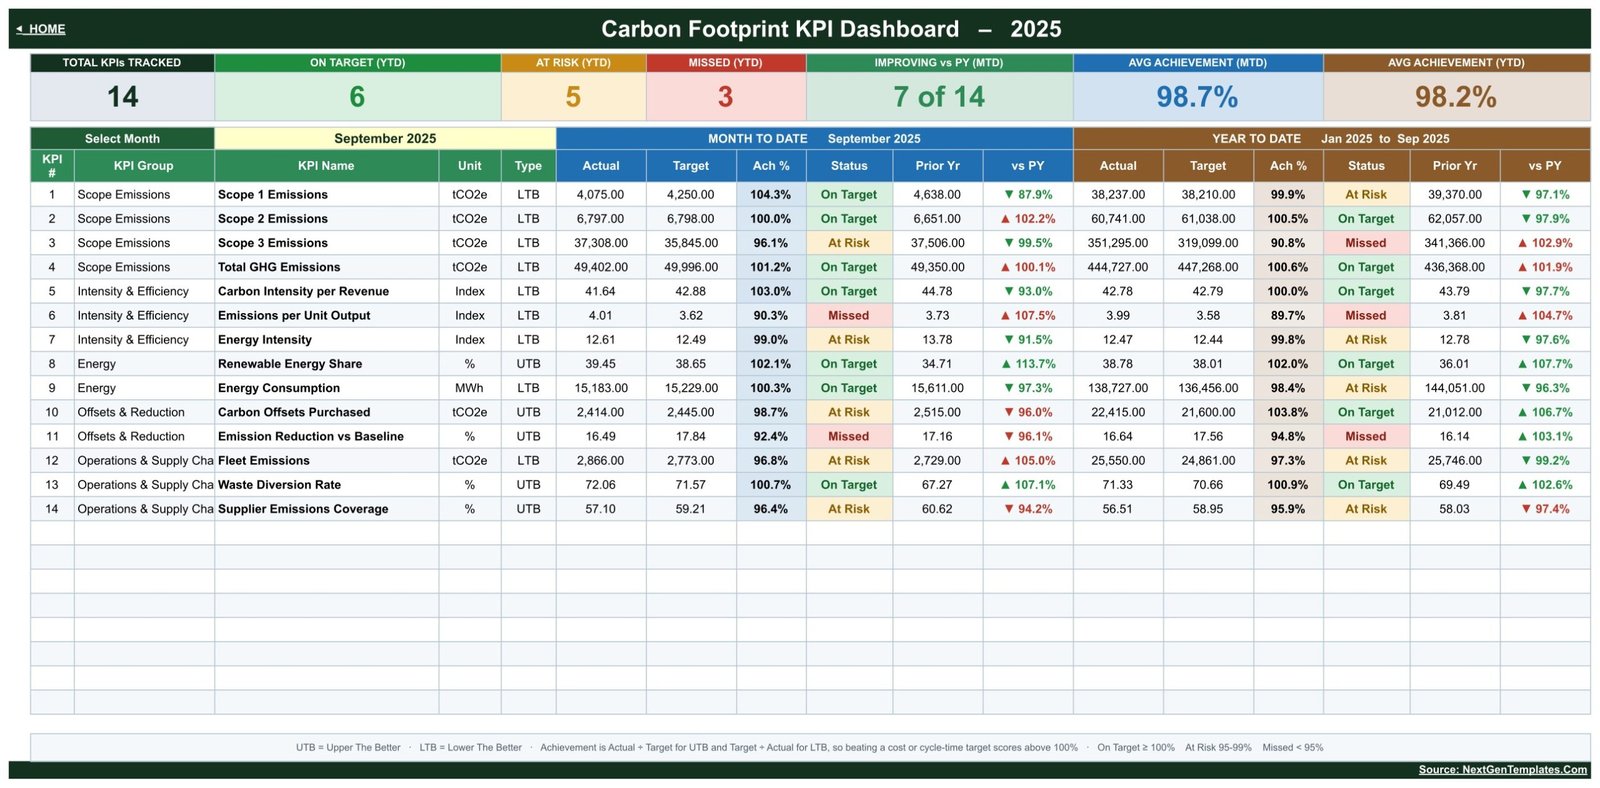
- Seven summary tiles – Total KPIs Tracked, On Target (YTD), At Risk (YTD), Missed (YTD), Improving vs PY (MTD), Avg Achievement (MTD) and Avg Achievement (YTD).
- Eleven columns per KPI – MTD Actual, Target, Ach %, Status, Prior Yr and vs PY, then the same six again for YTD.
- LTB and UTB handling – Achievement is Actual / Target for upper-the-better KPIs and Target / Actual for lower-the-better ones, so beating an emissions target scores above 100%.
- Editable thresholds – On Target from 100%, At Risk 95% to 99%, Missed under 95%; change the numbers in the Status formulas and every page follows.
- KPI-level ownership – each KPI carries a Unit, Type, Owner, Priority and Frequency, so Scope 3 sits with the Supply Chain Director and Renewable Energy Share with the Energy Manager.
- Formula-driven only – plain Google Sheets functions, no add-ons to install, no Apps Script to authorise and no macros to enable.
What’s Inside the Carbon Footprint KPI Dashboard in Google Sheets
Six pages, each doing one job:
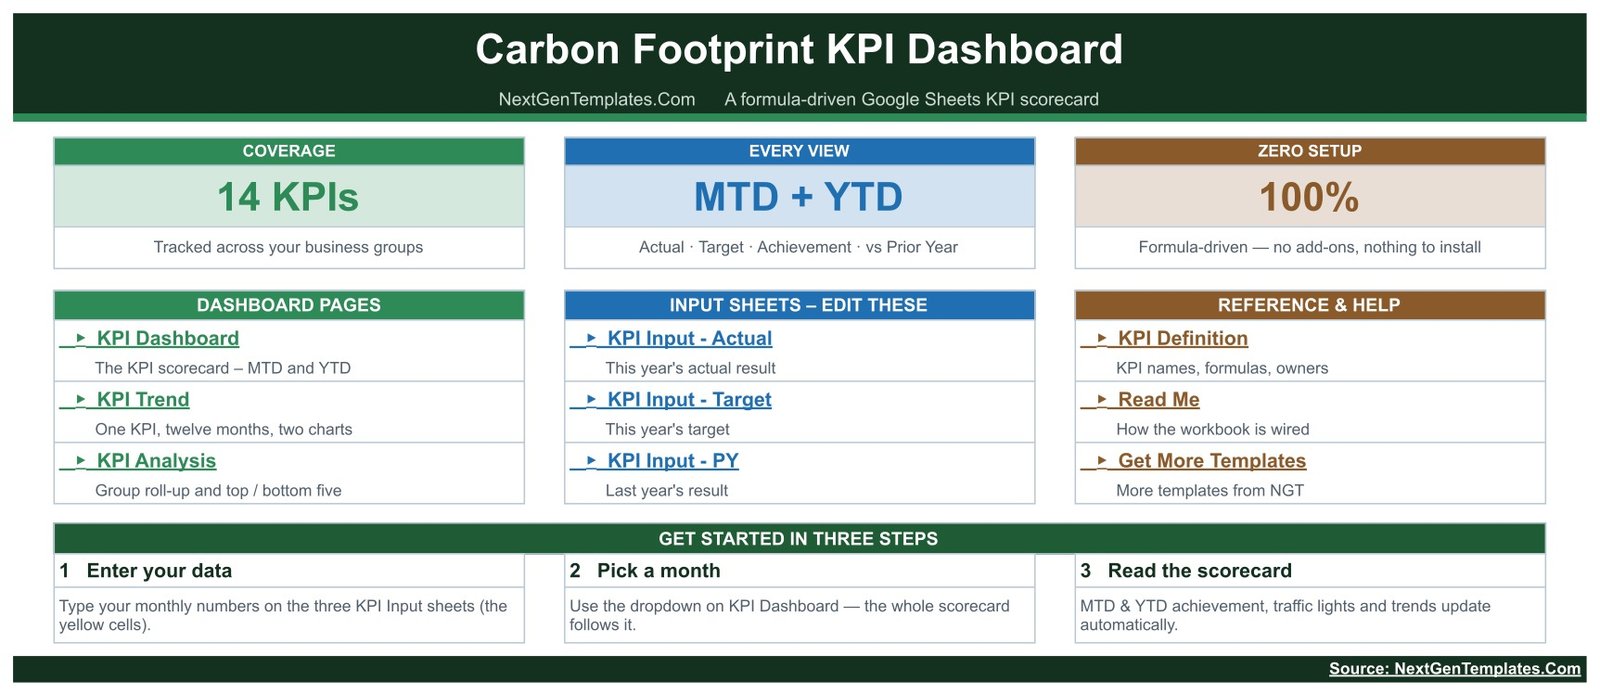
- Home – a navigation page with links to every sheet, a three-step start guide and the coverage summary (14 KPIs, MTD + YTD, zero setup).
- KPI Dashboard – the scorecard itself. The Select Month dropdown sits above the table; the seven tiles and all 14 rows recalculate from it. In the shipped sample, September 2025 shows 6 On Target, 5 At Risk and 3 Missed on a YTD basis, with average YTD achievement of 98.2%.
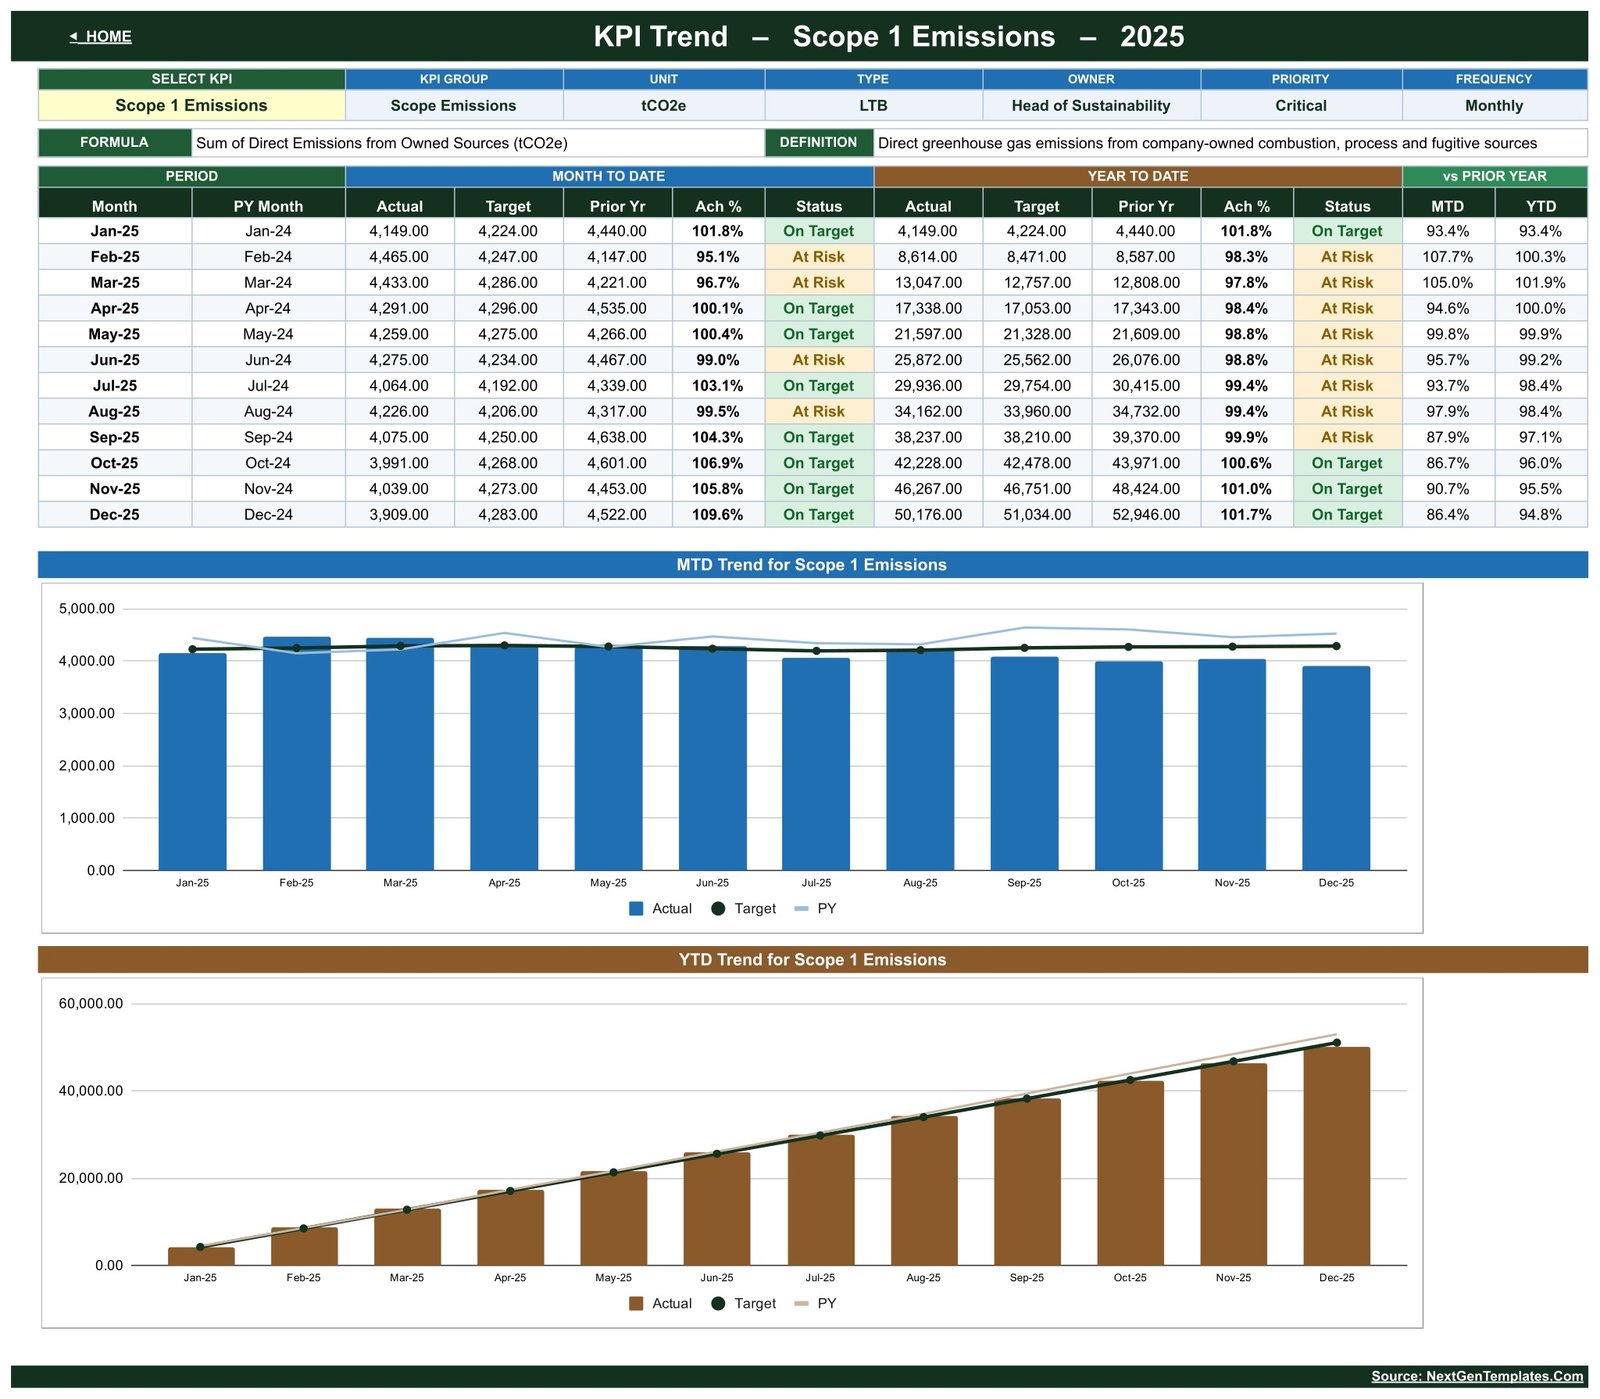
- KPI Trend – pick one KPI and read twelve months of it. The header shows Group, Unit, Type, Owner, Priority, Frequency, the formula and the definition; below that a month table and two charts, MTD Trend for Scope 1 Emissions and YTD Trend for Scope 1 Emissions, each plotting Actual, Target and Prior Year.
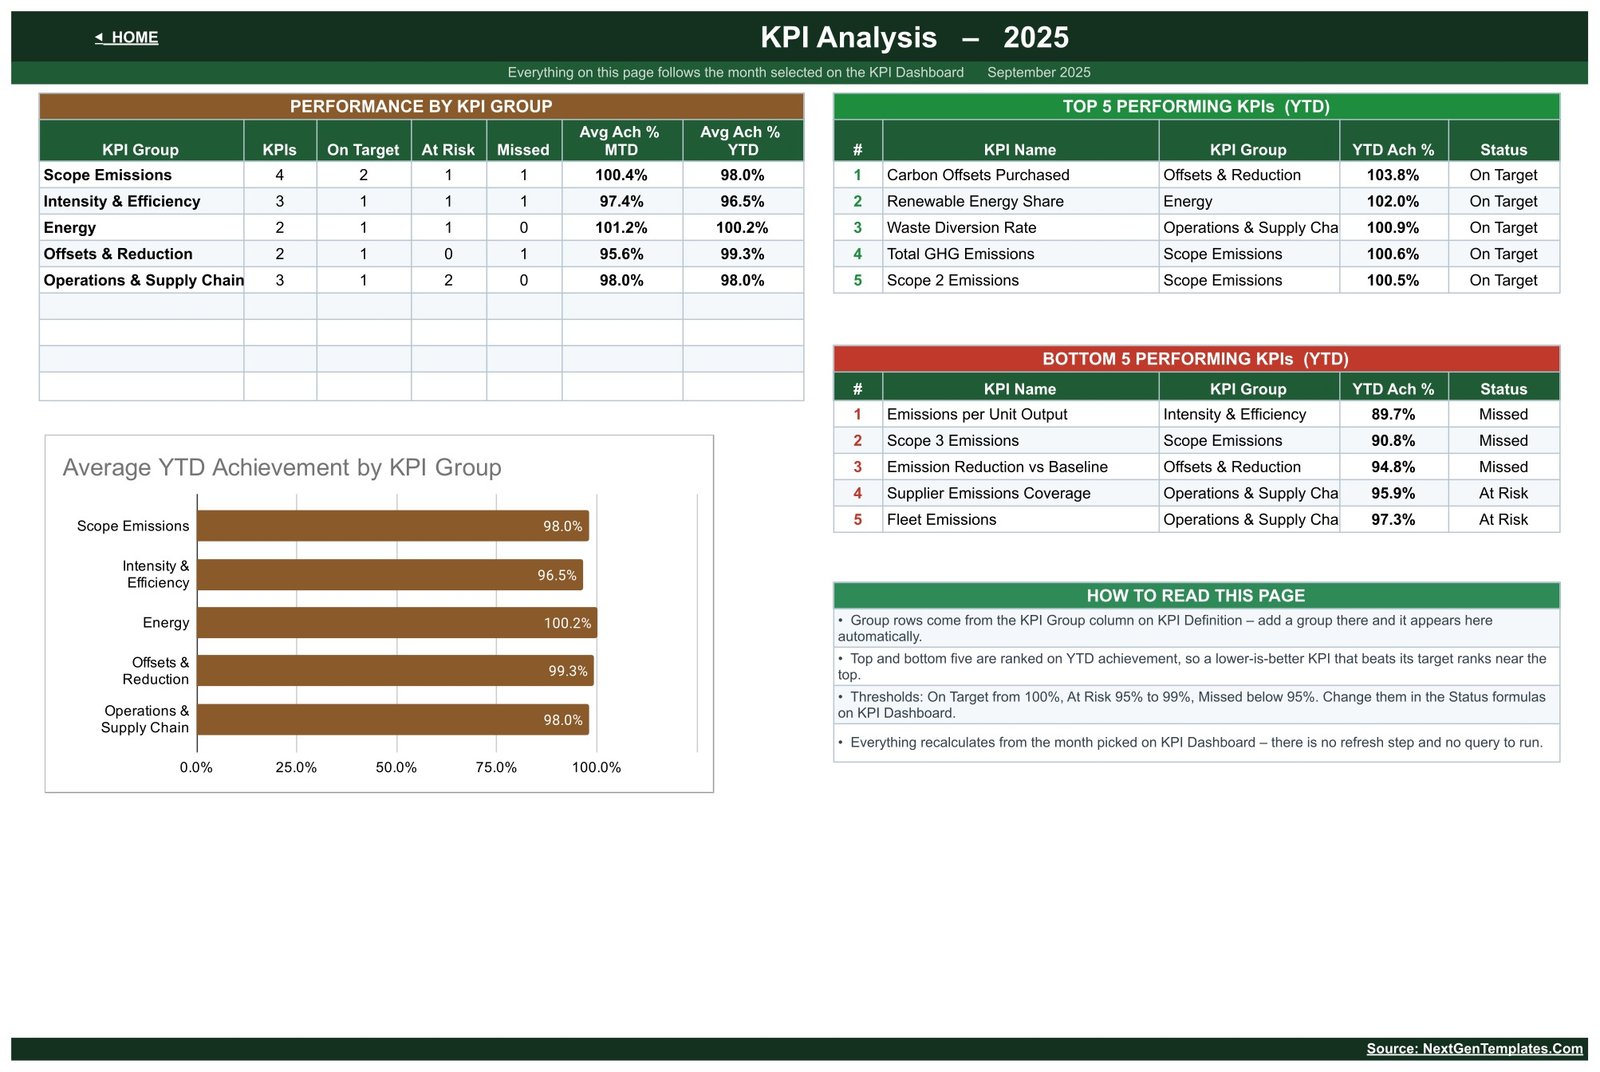
- KPI Analysis – Performance by KPI Group (KPI count, On Target, At Risk, Missed, average MTD and YTD achievement), an Average YTD Achievement by KPI Group bar chart, and ranked Top 5 and Bottom 5 KPIs.
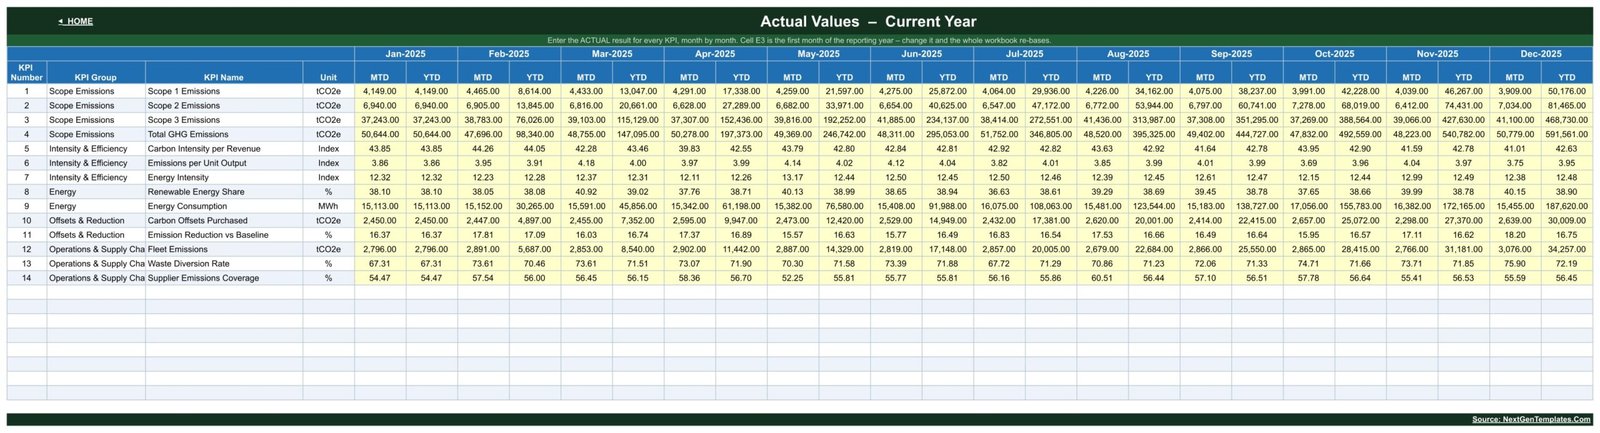
- KPI Input – Actual / Target / PY – three matching sheets holding the yellow entry cells, twelve months wide, with MTD and YTD columns per month.
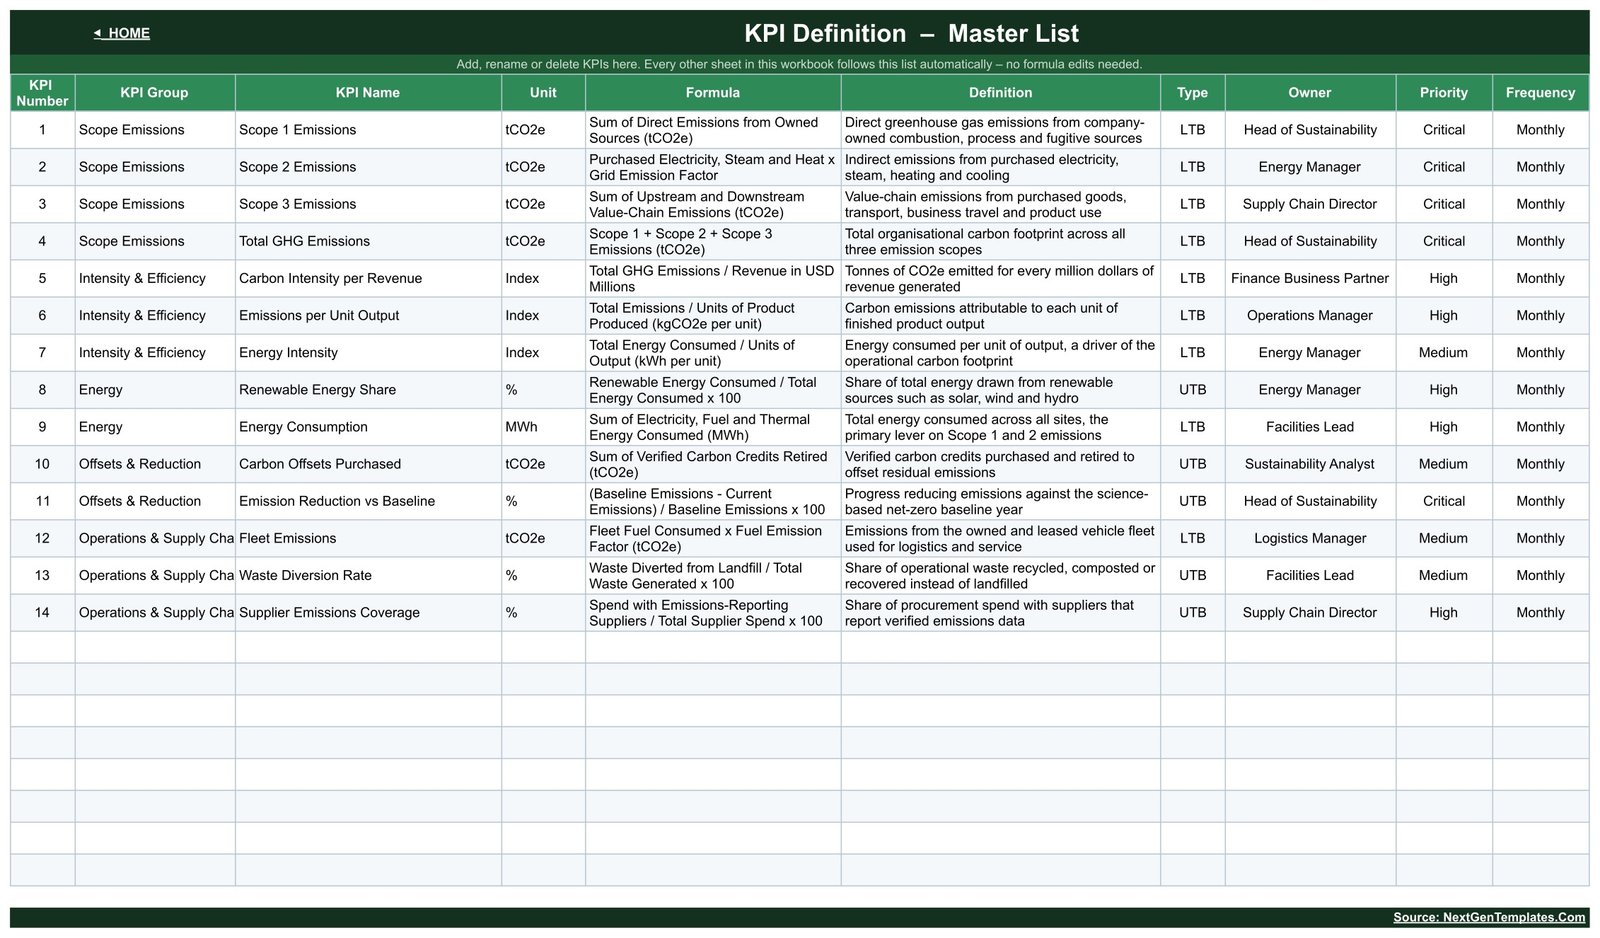
- KPI Definition – the master list. Add, rename or delete a KPI here and every other sheet picks it up; no formula edits anywhere else.
Carbon Footprint KPI Dashboard in Google Sheets vs. Excel vs. Paid Carbon Accounting SaaS – Where This Fits
| This template (Google Sheets) | Excel KPI scorecard | Paid carbon accounting SaaS | |
|---|---|---|---|
| Cost | One payment of $8.99 | One payment, similar | Typically $200+ per month |
| Platform | Google Sheets, any browser | Desktop Excel | Vendor web app |
| Setup time | Minutes – type your numbers in | Minutes | Weeks of onboarding |
| Real-time team collaboration | Yes, native | Only via OneDrive co-authoring | Yes |
| Mobile access | Yes, Sheets app | Limited | Yes |
| Customisable KPIs | Yes – edit the KPI Definition sheet | Yes | Usually fixed to the vendor’s model |
| Share with a link | Yes | File send or cloud link | Seat-based |
| Year-1 cost at 5 users | $8.99 once | One licence cost | $2,400+ |
| Emission factor library | No – you supply the tCO2e figures | No | Yes |
| Third-party assurance | No | No | Sometimes offered |
Who This Template Is For – and Who It’s Not For
It is for sustainability leads and EHS managers who already calculate their emissions somewhere and need a monthly management view; finance business partners who report carbon intensity per revenue alongside the numbers; operations and facilities teams tracking energy, fleet and waste diversion; and small consultancies that report client carbon KPIs and want a file they can duplicate per client.
It is not for anyone who needs the emissions calculated for them. This template does not ship emission factors, does not convert fuel litres or kWh into tCO2e, and does not audit anything. It makes no claim of alignment with the GHG Protocol, ISO 14064, CSRD, SECR or any reporting standard, and it is not assurance-ready evidence. Bring figures you already trust from your carbon accounting process, and use this to steer them month by month. If you want an analytical, chart-led carbon dashboard rather than a scorecard, that is a different build – see the related templates below.
How to Use the Carbon Footprint KPI Dashboard in Google Sheets
- Make your own copy. The PDF you download after purchase carries the Make a Copy link; one click puts the file in your own Google Drive.
- Set your reporting year. Cell E3 on KPI Input – Actual is the first month of the year; change it and the whole workbook re-bases.
- Edit the KPI list. On KPI Definition, keep the 14 shipped KPIs, rename them, or add your own with a Group, Unit, Type (LTB or UTB), Owner and Priority.
- Type your numbers. Fill the yellow cells on the three input sheets – this year’s Actual, this year’s Target, last year’s result.
- Pick a month. Use the Select Month dropdown on KPI Dashboard. Tiles, statuses, MTD and YTD all follow it.
- Work the exceptions. Read Bottom 5 on KPI Analysis, open that KPI on KPI Trend, and take the twelve-month picture to your monthly review.
Real-World Use Cases
Priya, Head of Sustainability at a mid-size manufacturer. Her board pack was a slide rebuilt by hand every month. She now types three columns of numbers, picks the month and screenshots the scorecard – Scope 3 sitting at 90.8% YTD achievement is the one line that gets discussed.
Daniel, Facilities Lead across nine sites. He owns Energy Consumption and Waste Diversion Rate. The Owner column means his two KPIs are unambiguous, and the KPI Trend page shows him whether a bad month was weather or a real drift.
Amara, an independent ESG consultant. She copies the file per client, swaps the KPI Definition list to match their material topics, and delivers a monthly scorecard without buying seats in a platform her clients would never log into.
Frequently Asked Questions
Does this calculate my emissions for me?
No. You enter tCO2e, MWh, percentages and index values that you have already calculated. There are no emission factors and no conversions inside the file.
Is this the same as the analytical carbon dashboard?
No. This is the KPI scorecard line – a month picker, an Actual / Target / Achievement / Status table and trend pages. Analytical dashboards are chart-led and slice a transaction table instead. Different products, and many customers own both.
Can I add or remove KPIs?
Yes. The KPI Definition sheet is the master list; every other page reads from it, so adding a row there adds it everywhere with no formula edits.
How do lower-is-better KPIs score?
KPIs marked LTB use Target / Actual, so emitting less than target scores above 100%. UTB KPIs such as Renewable Energy Share use Actual / Target.
Do I need any add-on, script or macro?
No. It is built from ordinary Google Sheets formulas. Nothing to install, nothing to authorise.
Can my team work in it at the same time?
Yes – it is a normal Google Sheet, so link sharing and simultaneous editing work as usual.
Does buying this make my organisation compliant with a reporting standard?
No. It is a management reporting template. It carries no certification, no assurance and no claim of conformity with the GHG Protocol, ISO 14064, CSRD or SECR.
About the Author
Built by PK – Microsoft Certified Professional with 15+ years of Excel, Google Sheets, and Power BI experience. Founder of NextGenTemplates, reaching 300K+ subscribers across YouTube channels. Every template is hand-built and tested before release.
Explore Related Templates
- Carbon Footprint KPI Dashboard in Excel – the same subject built as an Excel workbook.
- Green Building KPI Dashboard in Google Sheets – energy and building performance KPIs.
- Sustainable Tourism KPI Dashboard in Google Sheets – a sister scorecard for travel operators.
- Water Usage Efficiency KPI Dashboard in Excel – pairs with carbon for a fuller environmental pack.
- Corporate Governance KPI Dashboard in Google Sheets – the G to this template’s E.
- ESG Environmental Dashboard in Power BI – the analytical, chart-led alternative.
Browse the full Google Sheets dashboard collection.
Buy once, own it forever. Instant download, unlimited re-downloads, and a Make a Copy link that puts the file straight into your own Google Drive. Questions before you buy? Ask – we answer.
Watch the step-by-step video Demo:
Last updated: 19 August 2026.


























Reviews
There are no reviews yet.