

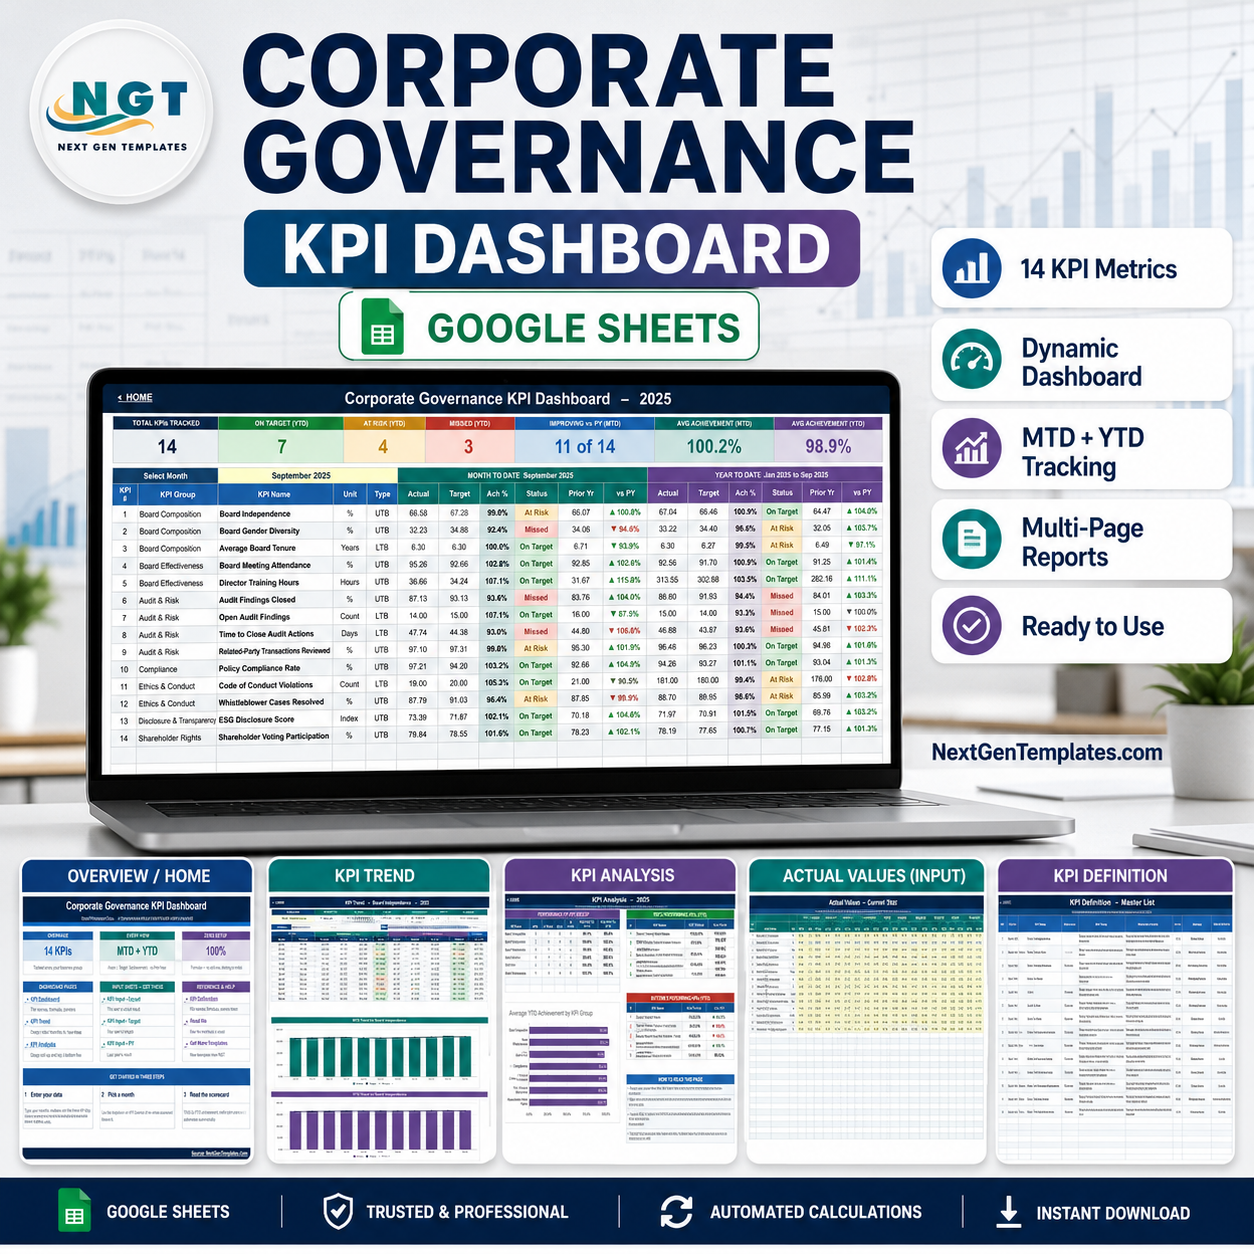
Corporate Governance KPI Dashboard in Google Sheets
Governance reporting usually lives in a pile of committee papers – one deck for board composition, another for internal audit, a compliance summary somewhere else, and a spreadsheet that somebody rebuilds by hand every quarter. This template collapses that into a single Google Sheets workbook: type your monthly numbers on three input sheets, pick a month from a dropdown, and a 14-KPI governance scorecard recalculates itself on the spot.
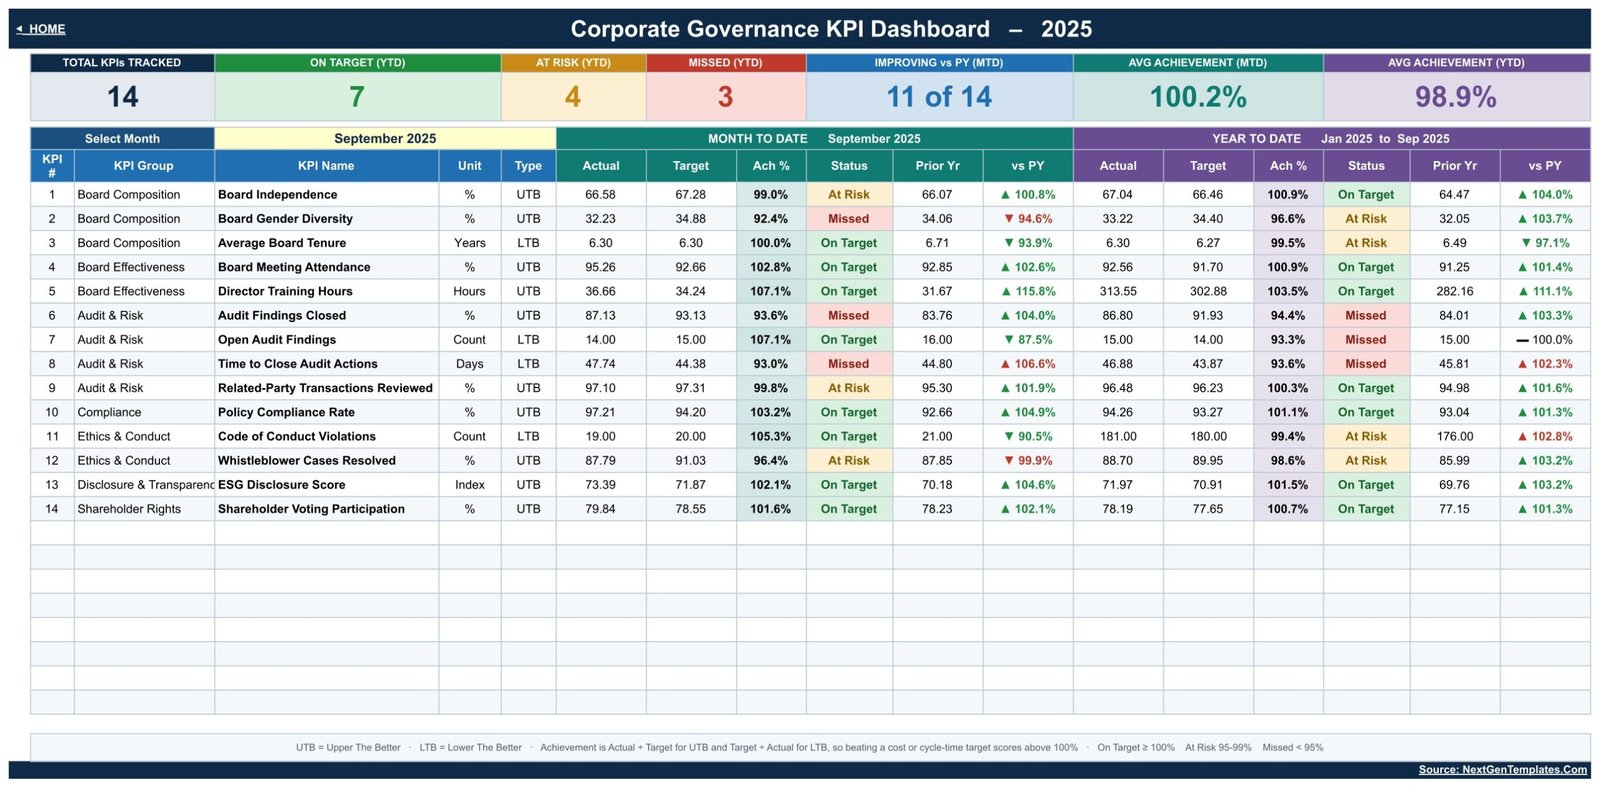
It is a KPI scorecard, not an analytics dashboard. Every KPI shows the same five things for both the selected month (MTD) and the year so far (YTD): Actual, Target, Achievement %, a colour-coded Status, and the Prior-Year comparison. That is the shape a board or governance committee actually reads.
Important: this is a tracking and presentation template. It does not audit anything, does not verify your figures, and makes no claim to satisfy any listing rule, corporate-governance code, board-reporting standard or audit requirement. It is not legal, financial, audit or governance advice.
Key Features
- 14 governance KPIs across 7 groups – Board Composition, Board Effectiveness, Audit & Risk, Compliance, Ethics & Conduct, Disclosure & Transparency and Shareholder Rights.
- One month picker drives everything. Change the month on the KPI Dashboard and the scorecard, the KPI Analysis page and every summary card follow it. There is no refresh, no query and no script to authorise.
- MTD and YTD side by side – each with Actual, Target, Achievement %, Status and Prior Yr with a vs PY arrow, so a good month inside a weak year is impossible to miss.
- UTB / LTB logic built in. KPIs are tagged Upper-The-Better or Lower-The-Better, so Open Audit Findings and Time to Close Audit Actions score correctly when they fall, instead of looking like failures.
- Traffic-light status – On Target from 100%, At Risk 95-99%, Missed below 95%. The thresholds are plain formulas on the KPI Dashboard sheet, so you can move them to your own tolerance.
- Seven summary cards at the top of the scorecard: Total KPIs Tracked, On Target (YTD), At Risk (YTD), Missed (YTD), Improving vs PY (MTD), Avg Achievement (MTD) and Avg Achievement (YTD).
- A per-KPI Trend page – choose any KPI and see twelve months of MTD and YTD figures against Target and Prior Year, plus two charts: MTD Trend for the selected KPI and YTD Trend for the selected KPI.
- A KPI Analysis page with a Performance by KPI Group roll-up, Top 5 and Bottom 5 Performing KPIs (YTD), an Average YTD Achievement by KPI Group bar chart and a plain-English How to Read This Page panel.
- A KPI Definition master list holding the formula, definition, unit, type, owner, priority and reporting frequency for every KPI. Add, rename or delete a KPI there and the rest of the workbook follows automatically.
- Formula-driven, 100% native. No add-ons, no Apps Script, no external connections, nothing to install. It opens and works in a browser.
- Yellow input cells – only the cells you are meant to type in are highlighted, so nobody overwrites a formula by accident.
- Re-basable year. One cell on the Actual sheet sets the first month of the reporting year, and the whole workbook re-bases to it.
What Is Inside – Page by Page
1. Home
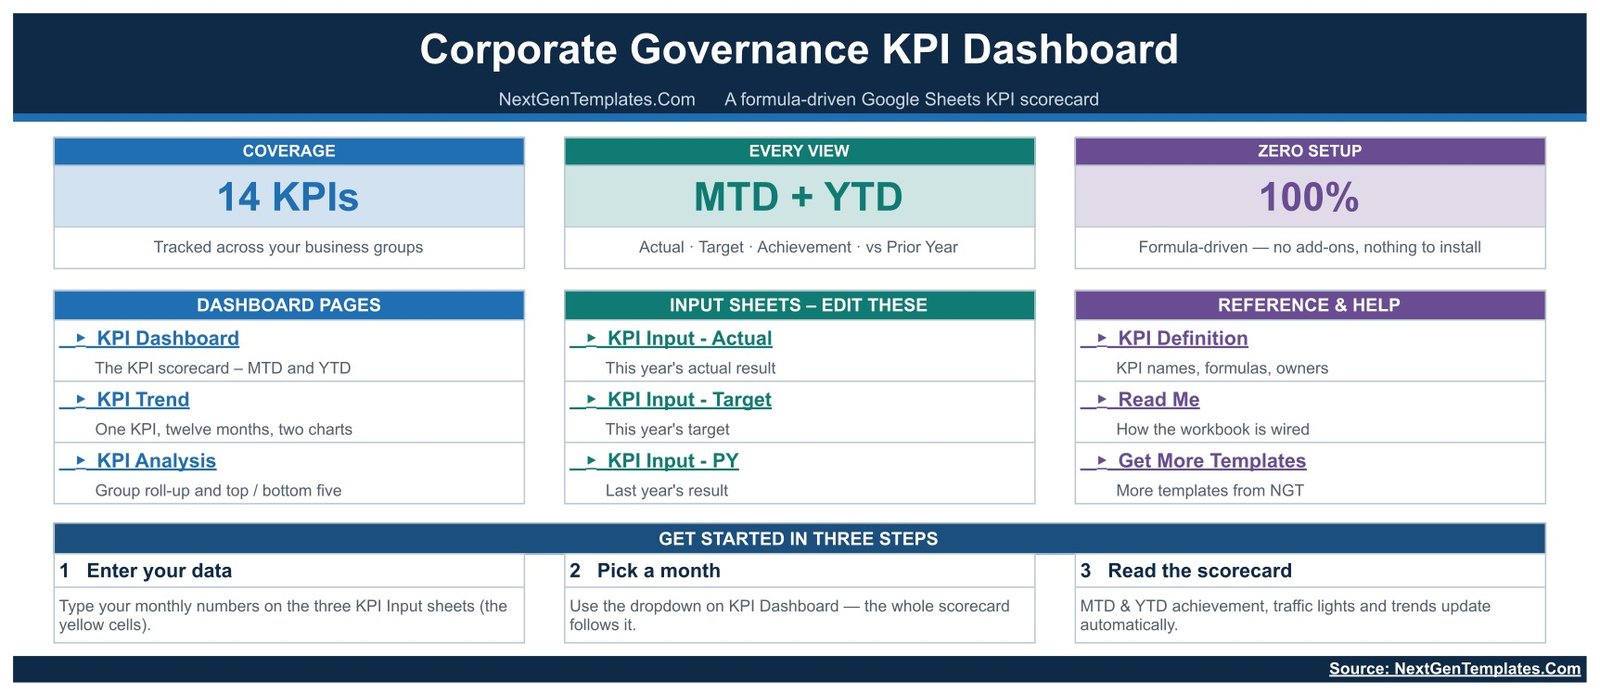
A launch page with linked buttons to every sheet, grouped as Dashboard Pages, Input Sheets and Reference & Help, plus a three-step Get Started panel. It also states the headline facts: 14 KPIs, MTD + YTD on every view, and 100% formula-driven.
2. KPI Dashboard – the scorecard
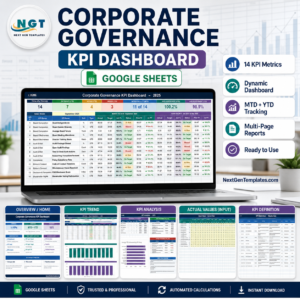
The main page. Seven summary cards sit above a 14-row table split into a Month To Date block and a Year To Date block. Each row carries the KPI number, group, name, unit and type, then Actual, Target, Ach %, Status, Prior Yr and vs PY for both periods. In the sample data shown, September 2025 gives 7 On Target, 4 At Risk and 3 Missed on a YTD basis, 11 of 14 KPIs improving against prior year, and average achievement of 100.2% MTD against 98.9% YTD.
3. KPI Trend – one KPI, twelve months
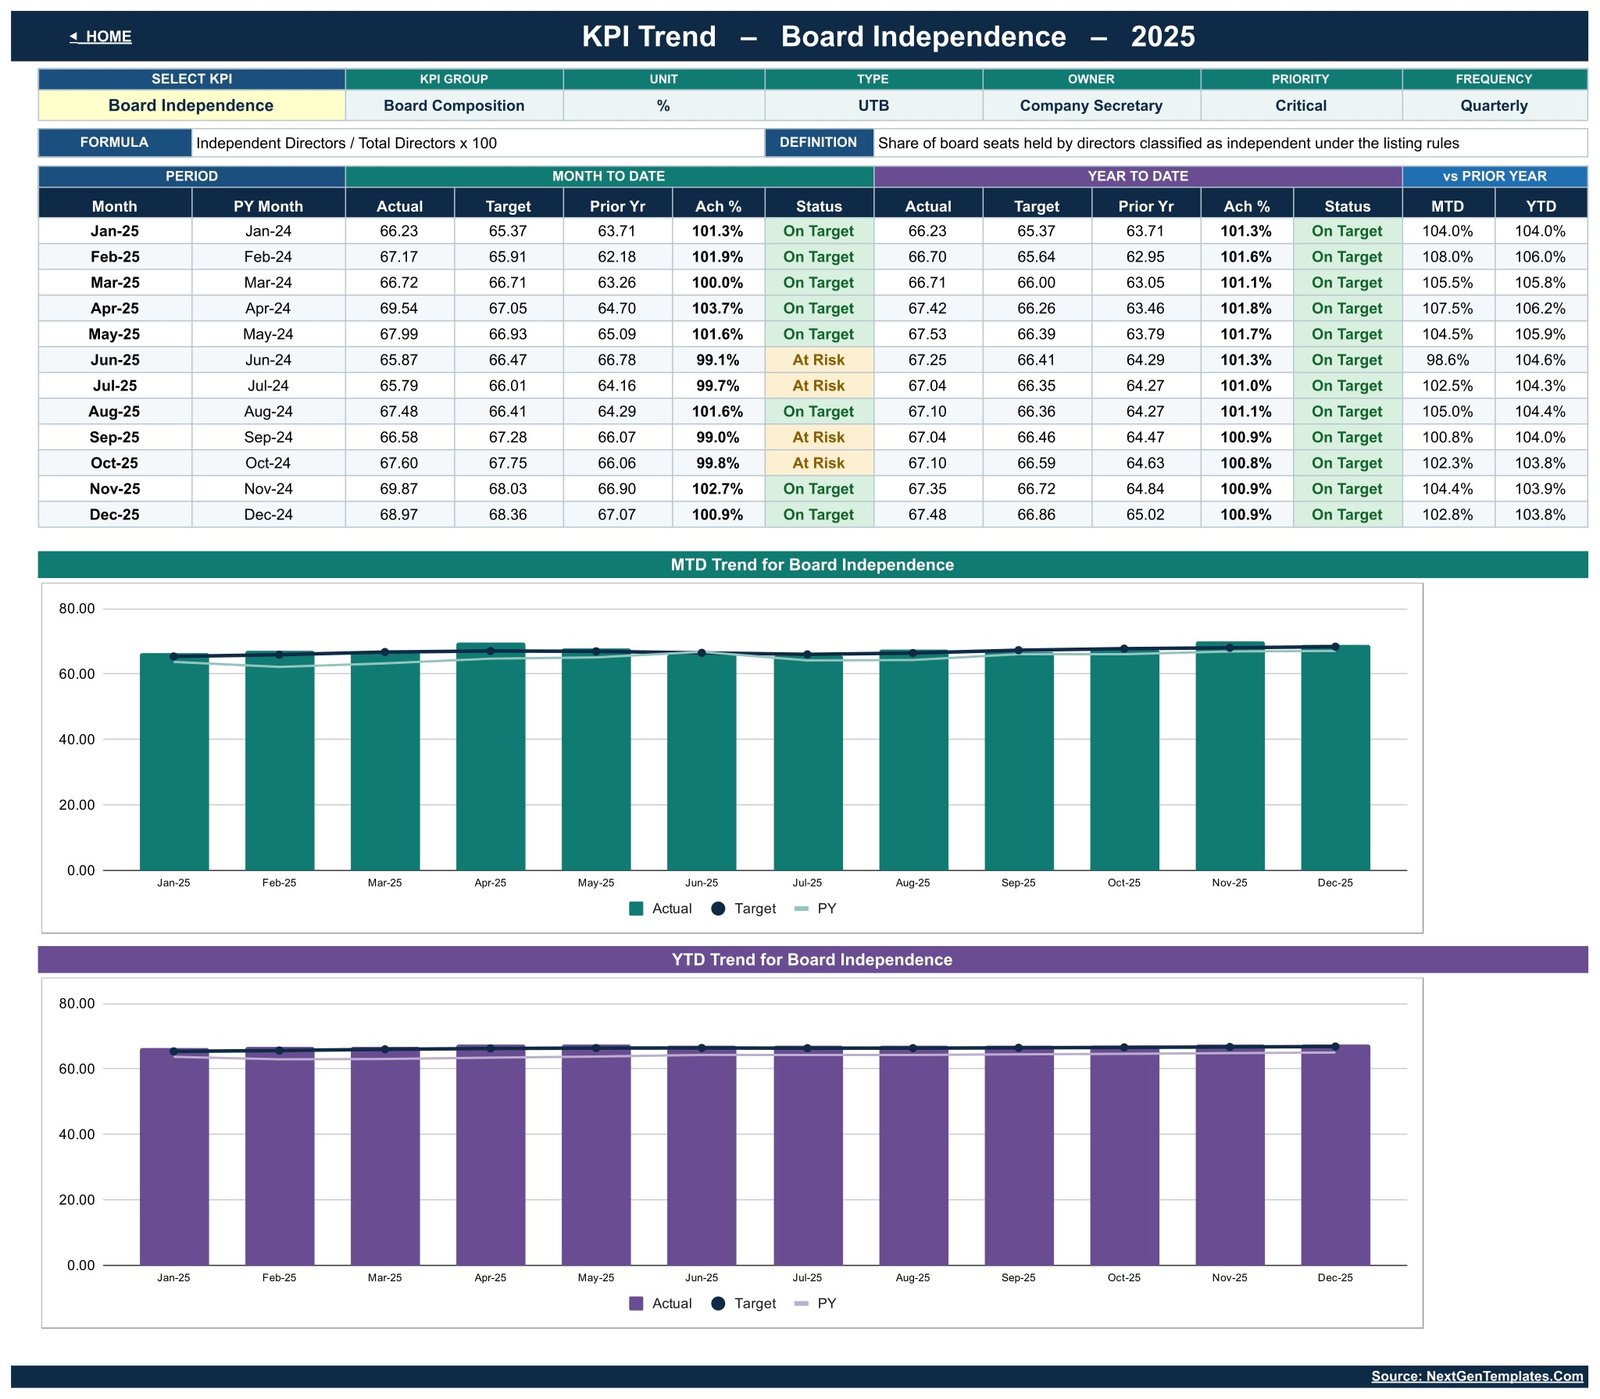
Pick a KPI from the dropdown and the page rebuilds around it. A header strip repeats its group, unit, type, owner, priority, frequency, formula and definition; a twelve-row table gives Actual, Target, Prior Yr, Ach % and Status for MTD and YTD plus the vs Prior Year columns; and two charts below plot it – MTD Trend for Board Independence and YTD Trend for Board Independence in the screenshot – with Actual bars against Target and PY lines.
4. KPI Analysis – groups, winners and laggards
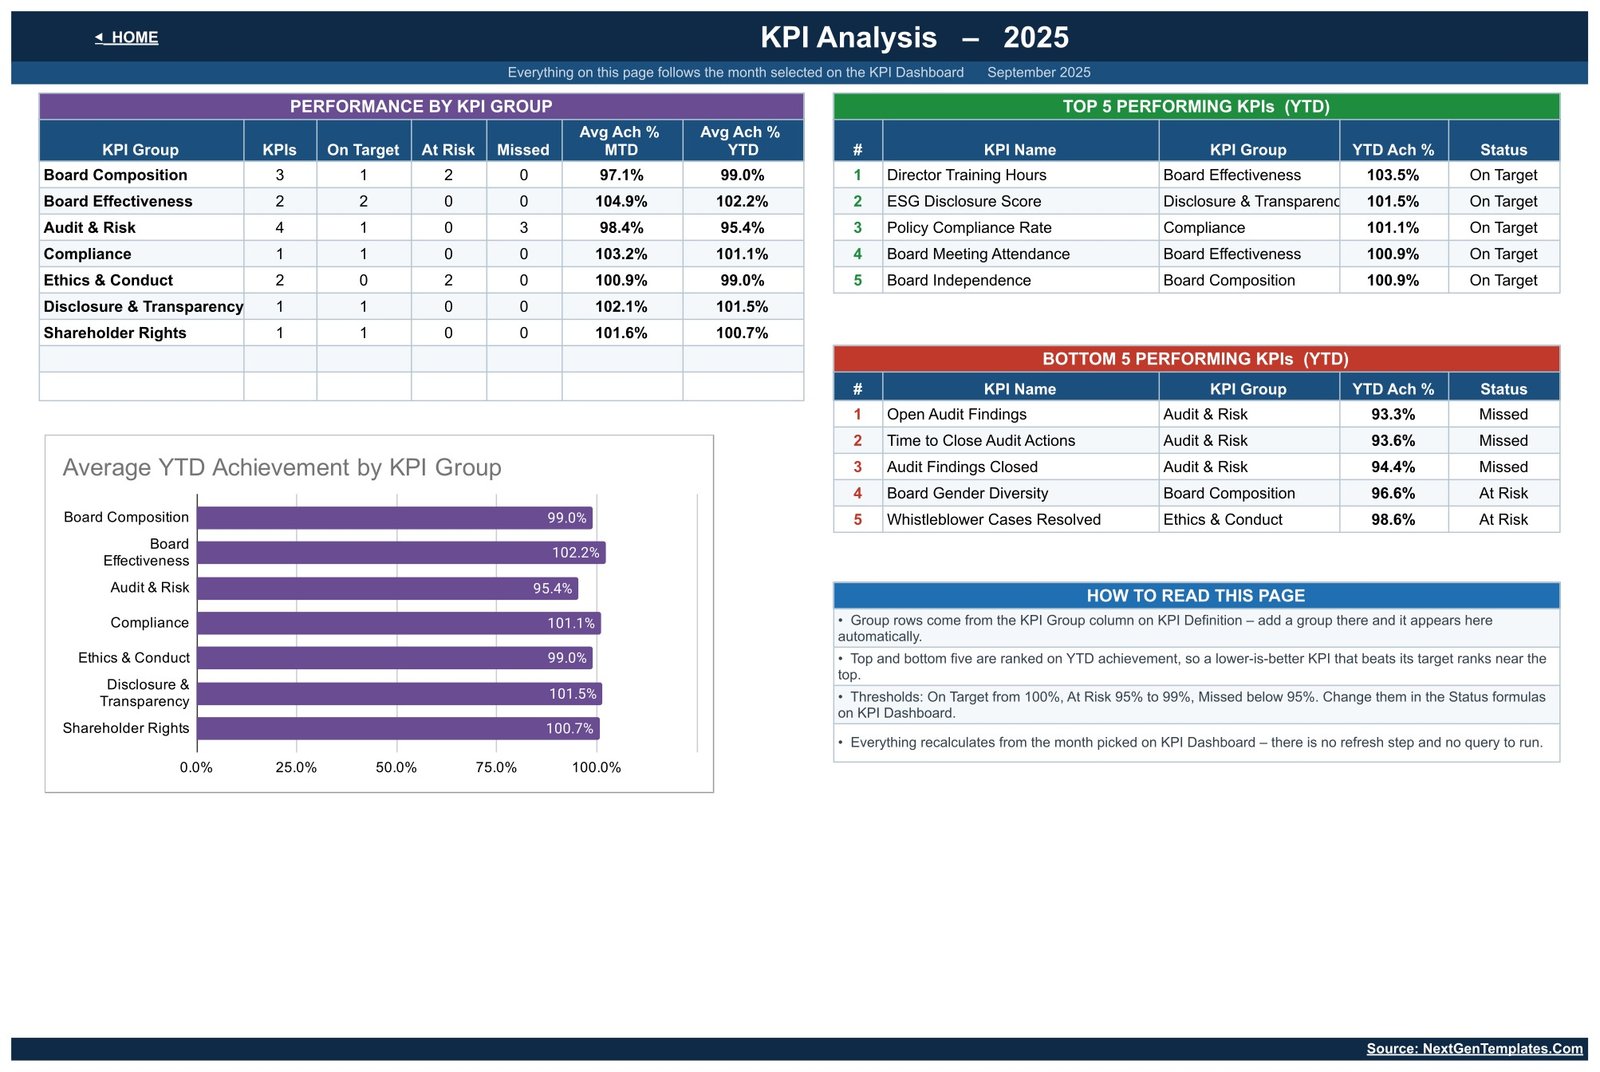
A Performance by KPI Group table counts KPIs, On Target, At Risk and Missed per group with average MTD and YTD achievement, and an Average YTD Achievement by KPI Group bar chart plots it. Beside it, Top 5 and Bottom 5 Performing KPIs (YTD) name exactly which measures are carrying the year and which are dragging it. Everything on the page follows the month selected on the KPI Dashboard.
5. KPI Input – Actual, Target and PY
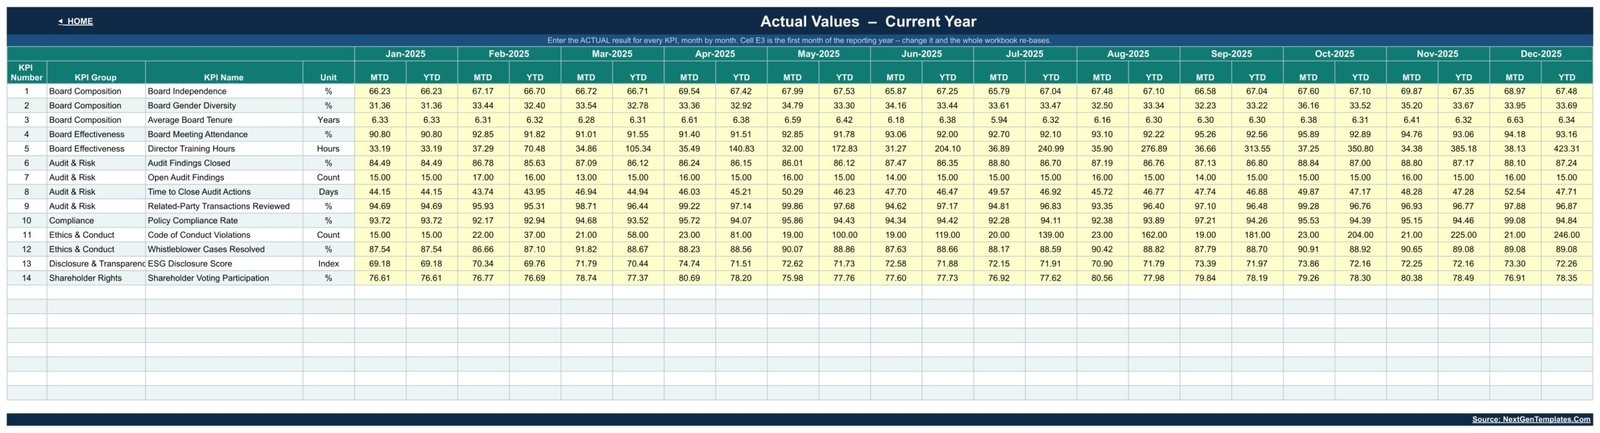
Three identically shaped entry sheets – this year’s Actual, this year’s Target and last year’s result. Each is a 14-row grid with an MTD and a YTD column per month, January to December. These are the only sheets you edit month to month.
6. KPI Definition – the master list
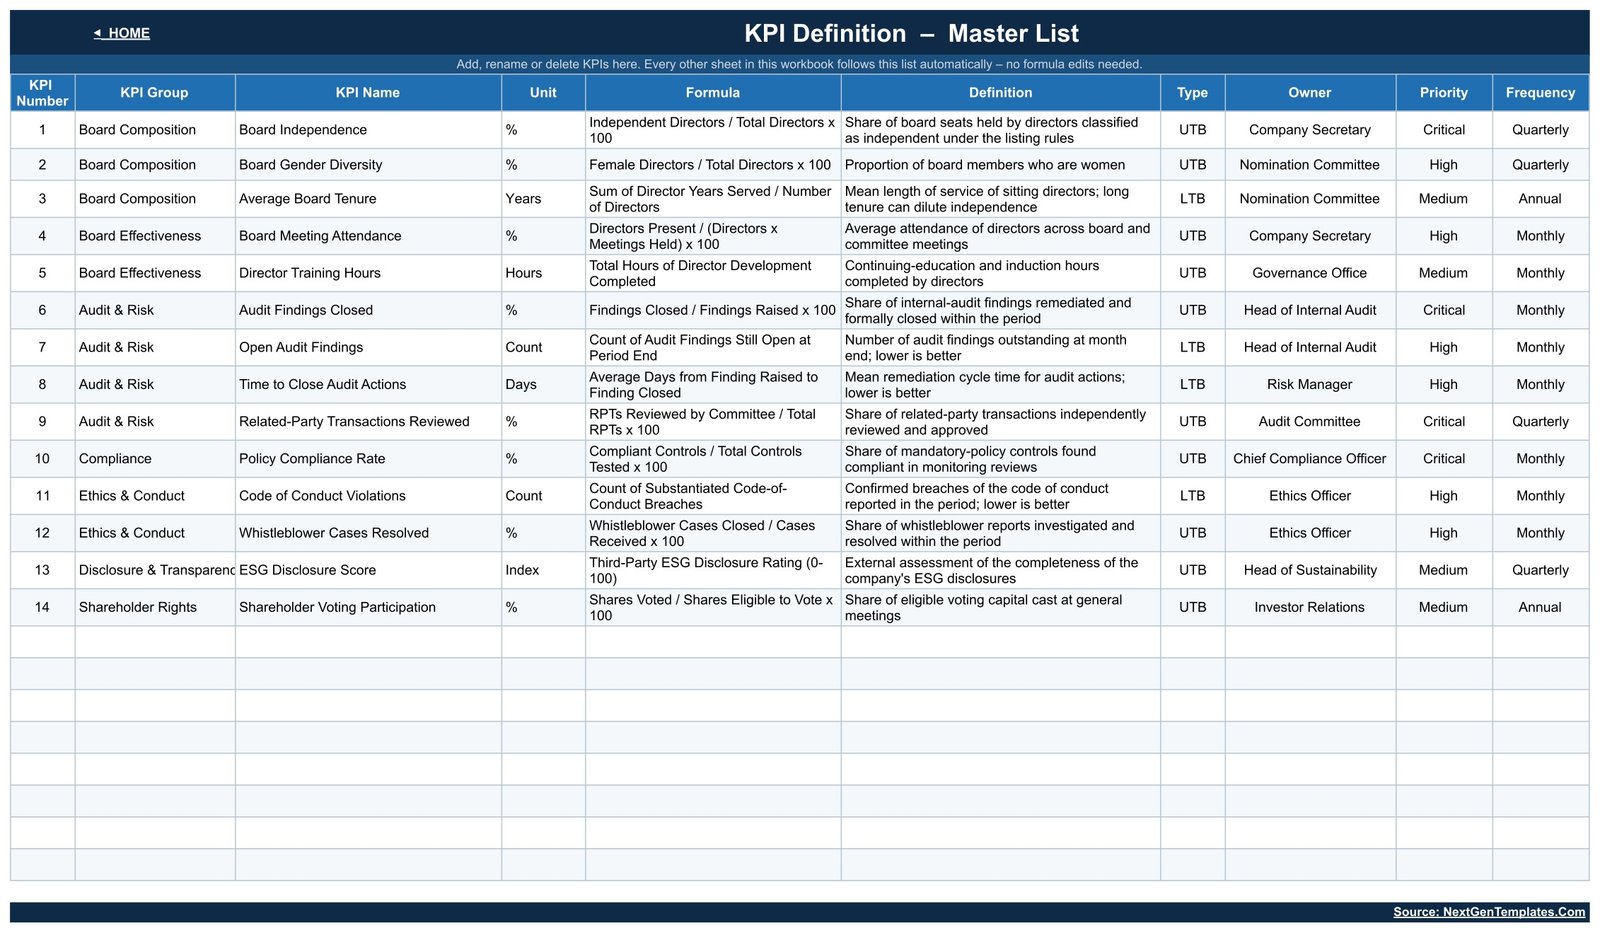
The control sheet. Every KPI’s group, name, unit, formula, definition, type (UTB/LTB), owner, priority and frequency lives here, and the whole workbook reads from it. The sample list assigns owners such as Company Secretary, Nomination Committee, Head of Internal Audit, Risk Manager, Audit Committee, Chief Compliance Officer, Ethics Officer, Head of Sustainability and Investor Relations – all editable text.
The 14 KPIs
| # | KPI Group | KPI | Unit | Type |
|---|---|---|---|---|
| 1 | Board Composition | Board Independence | % | UTB |
| 2 | Board Composition | Board Gender Diversity | % | UTB |
| 3 | Board Composition | Average Board Tenure | Years | LTB |
| 4 | Board Effectiveness | Board Meeting Attendance | % | UTB |
| 5 | Board Effectiveness | Director Training Hours | Hours | UTB |
| 6 | Audit & Risk | Audit Findings Closed | % | UTB |
| 7 | Audit & Risk | Open Audit Findings | Count | LTB |
| 8 | Audit & Risk | Time to Close Audit Actions | Days | LTB |
| 9 | Audit & Risk | Related-Party Transactions Reviewed | % | UTB |
| 10 | Compliance | Policy Compliance Rate | % | UTB |
| 11 | Ethics & Conduct | Code of Conduct Violations | Count | LTB |
| 12 | Ethics & Conduct | Whistleblower Cases Resolved | % | UTB |
| 13 | Disclosure & Transparency | ESG Disclosure Score | Index | UTB |
| 14 | Shareholder Rights | Shareholder Voting Participation | % | UTB |
All 14 are editable. Rename them, delete the ones you do not report, or add your own on the KPI Definition sheet.
Who It Is For
- Company secretaries and governance offices preparing a monthly or quarterly governance pack.
- Internal audit and risk teams who want findings-closed, open-findings and cycle-time in the same view as the board metrics.
- Compliance and ethics officers tracking policy compliance, code-of-conduct cases and whistleblower resolution over time.
- Board and committee secretaries who need one page that a non-analyst director can read in a minute.
- Consultants and advisory firms who want a reusable governance-reporting shell instead of rebuilding one per client.
- Students and trainers teaching governance metrics and KPI scorecard design.
Scorecard or Analytical Dashboard?
NextGenTemplates ships two different kinds of governance-adjacent template. They are not the same product, and plenty of teams buy both.
| This KPI Scorecard | An Analytical Dashboard | |
|---|---|---|
| Shape | Table-led scorecard, one row per KPI | Chart-led, slicers and pivots |
| Driven by | A month picker | Filters across a transaction dataset |
| Input | You type monthly totals on three sheets | You paste or import row-level records |
| Core view | Actual vs Target vs PY, MTD and YTD | Distributions, breakdowns and rankings |
| Answers | Are we hitting our governance targets? | What is going on underneath the numbers? |
| Best for | Board and committee reporting | Analyst investigation |
How to Use It
- Download the PDF that comes with this product and click the Make a Copy link inside it. That drops your own private copy into your Google Drive – the original stays untouched.
- Edit the KPI Definition sheet first. Set your KPI names, groups, units, formulas, owners, priorities and frequency. Mark each one UTB or LTB. Every other sheet follows this list.
- Set the first month of your reporting year in cell E3 of the KPI Input – Actual sheet, then the workbook re-bases to it.
- Fill the three input sheets – Actual, Target and PY – in the yellow cells, month by month, MTD and YTD.
- Open KPI Dashboard and pick a month from the Select Month dropdown. The scorecard, the summary cards and the KPI Analysis page all recalculate.
- Use KPI Trend to drill into any single KPI over twelve months when a status turns amber or red.
- Adjust the thresholds in the Status formulas if 100 / 95 does not match your tolerance.
- Share or export. Share the sheet read-only with your committee, or File > Download > PDF for the board pack.
Requirements
- A free Google account and Google Sheets in any modern browser.
- No add-ons, no Apps Script, no Excel licence, no external data connections.
- Works on desktop; readable on tablet. Data entry is far easier on a desktop.
Frequently Asked Questions
Does this template make my organisation compliant with a governance code or listing rule?
No. It records and presents numbers you enter. It does not verify them, does not audit anything, and makes no claim to satisfy any listing rule, corporate-governance code, board-reporting standard, audit requirement or regulation anywhere. Nothing in it is legal, financial, audit or governance advice – check your own obligations with your own advisers.
Are the numbers in the screenshots real?
No. Every figure shown is demonstration data so the charts and traffic lights are visible. Clear it and enter your own.
Is this the same as the Corporate Governance analytical dashboard?
No. This is the month-picker KPI scorecard – a table of KPIs with MTD/YTD Actual vs Target vs Prior Year, a Trend page and a group Analysis page. An analytical governance dashboard is chart- and filter-led over row-level data. Different tools, different questions.
Can I change the 14 KPIs?
Yes, that is the design. Add, rename, reorder or delete KPIs on the KPI Definition sheet and the scorecard, Trend page, Analysis page and input sheets all follow. Keep them inside the sheet’s prepared row range.
Why do some KPIs score above 100% when the number went down?
Because they are marked LTB (Lower The Better). For those, Achievement is Target divided by Actual, so beating a cost or cycle-time target correctly scores above 100%. UTB KPIs use Actual divided by Target.
Does it need macros, add-ons or Apps Script?
None. It is pure Google Sheets formulas and native charts. Nothing to install, nothing to authorise, no refresh step.
Can I use it in Excel instead?
This build is for Google Sheets. Excel does not reproduce every formula and chart behaviour identically, so if Excel is your platform, look at the Excel KPI scorecard line instead.
Can more than one person use it?
Yes – it is a normal Google Sheet, so share it with your team or committee and set edit or view-only rights per person.
Can I reuse it for another year?
Yes. Duplicate your copy, change the reporting-year start cell, roll this year’s Actuals into the PY sheet and enter next year’s Targets.
What exactly do I download?
A PDF that contains the Make a Copy link plus a short setup walkthrough. You are not downloading a spreadsheet file – you are getting your own live copy in Google Drive, which is what makes it shareable and always available.
Related Templates
- Environmental, Social, and Governance (ESG) Dashboard in Google Sheets – the analytical companion for the E, S and G side.
- Audit & Internal Controls Dashboard in Google Sheets – goes deeper on the audit and controls half of this scorecard.
- Carbon Footprint KPI Dashboard in Google Sheets – the same scorecard engine pointed at emissions.
- Browse all Google Sheets dashboards
What You Get
- A PDF containing the Make a Copy link to the full Google Sheets workbook.
- Six sheets: Home, KPI Dashboard, KPI Trend, KPI Analysis, three KPI Input sheets, KPI Definition, Read Me and Get More Templates.
- 14 pre-built governance KPIs with formulas, owners and definitions – all editable.
- Lifetime access to your copy, and free access to future updates of this template.
Instant delivery. The download link appears right after checkout and is emailed to you as well.
Disclaimer: this template is a reporting and tracking tool only. It is not legal, financial, audit or governance advice, and it does not ensure or evidence compliance with any law, listing rule, governance code or reporting standard. All figures shown in the screenshots are sample data.



























Reviews
There are no reviews yet.