
In today’s sustainability-driven world, managing building performance goes far beyond just saving energy — it’s about creating a smarter, greener, and more efficient environment. 🌿 Whether you oversee corporate offices, educational institutions, or commercial facilities, understanding your building’s environmental impact is the first step toward meaningful change.
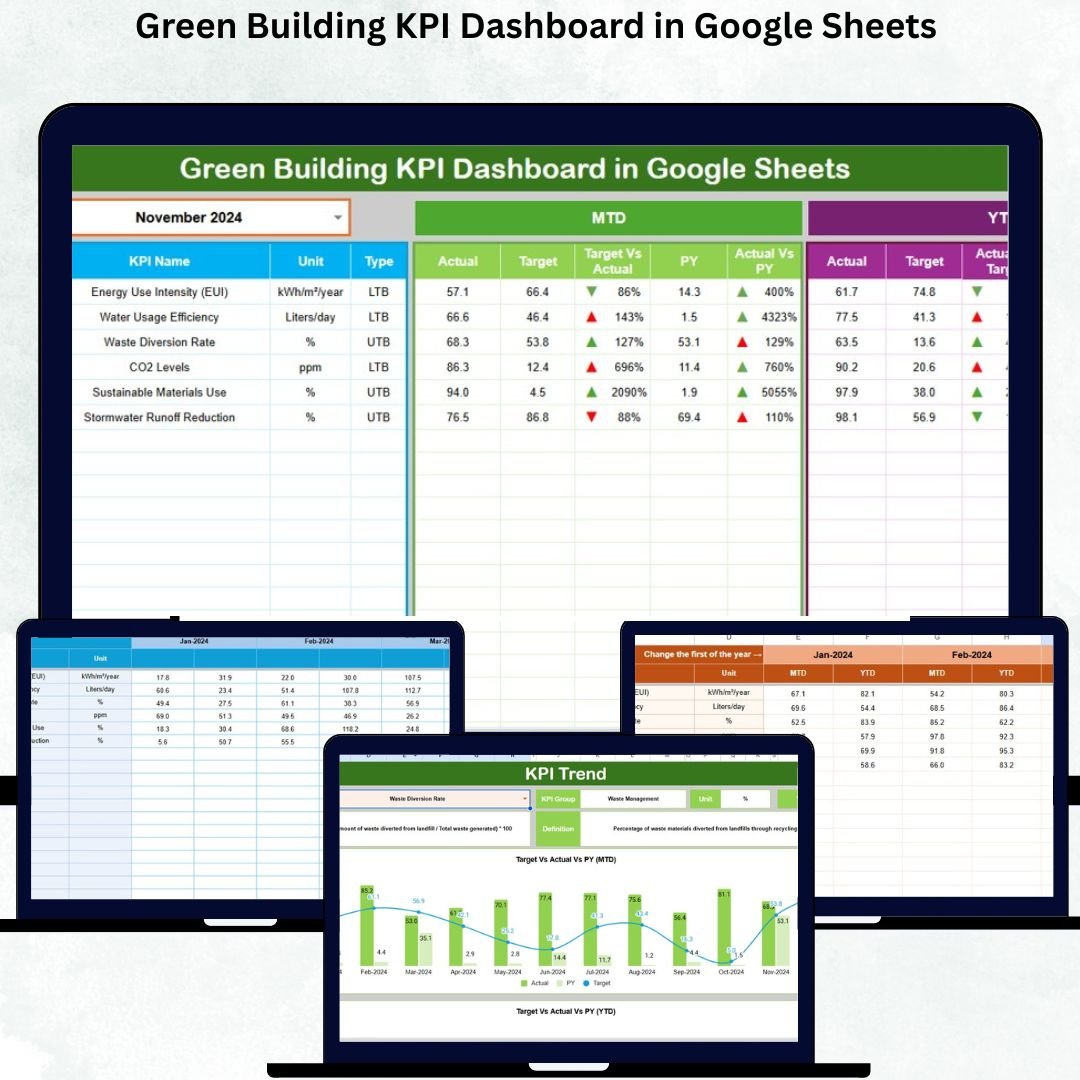
That’s why we created the Green Building KPI Dashboard in Google Sheets — a ready-to-use, cloud-based tool that helps you track, measure, and improve sustainability performance through interactive Key Performance Indicators (KPIs). Designed for simplicity and accuracy, this dashboard turns your environmental data into powerful insights.
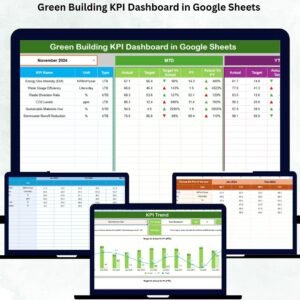
🌟 Key Features of the Green Building KPI Dashboard in Google Sheets
✨ Real-Time KPI Tracking – Instantly view Month-to-Date (MTD) and Year-to-Date (YTD) results with automatic updates when you change the month.
📊 Interactive Dashboard View – Visually monitor key sustainability metrics using dynamic charts, progress bars, and color-coded indicators (green for good, red for attention).
⚡ Comprehensive KPI Coverage – Track energy efficiency, water usage, waste recycling, carbon footprint, indoor air quality, and renewable energy utilization.
📈 Target vs. Actual Performance – Compare live performance against predefined goals with up/down trend arrows and variance highlights.
📁 Pre-Built Data Structure – Organized sheets for Actuals, Targets, Previous Year, and KPI Definitions for structured data management.
💡 Automation & Accuracy – Built-in formulas ensure error-free calculations and effortless updates across all sheets.
☁️ Cloud Accessibility – Access and collaborate with your team anytime, anywhere through Google Sheets.
📈 No Complex Software Needed – Fully built-in Google Sheets — no coding or installation required.
📂 What’s Inside the Green Building KPI Dashboard
When you download this template, you’ll get a complete, pre-formatted Google Sheets file containing six essential worksheet tabs:
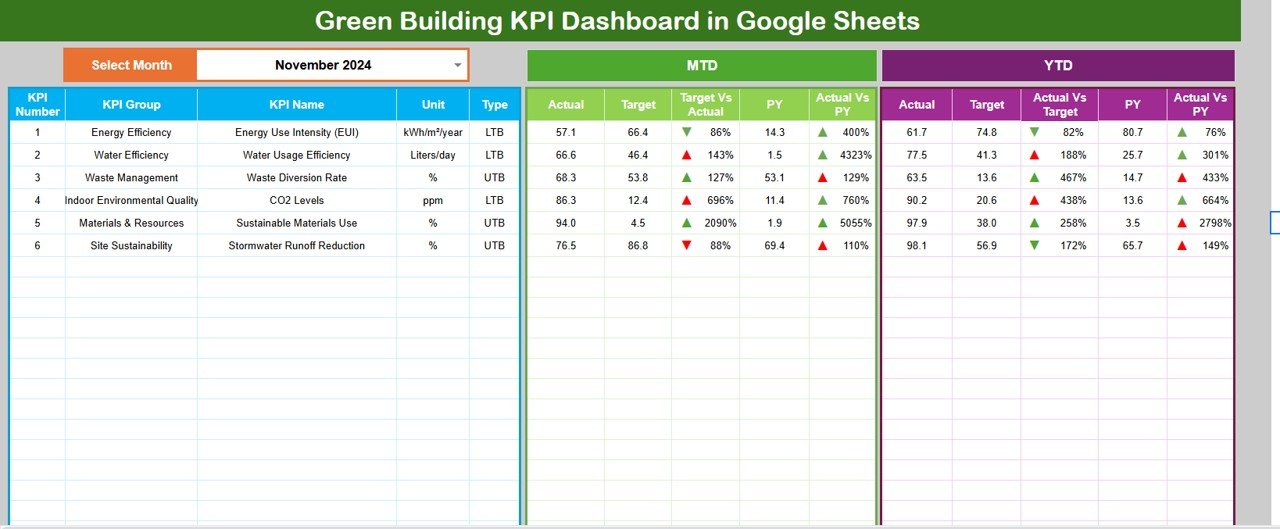
1️⃣ Dashboard Sheet Tab – The central control hub where you can select the month (cell D3) and view MTD/YTD summaries, trend arrows, and KPI cards.
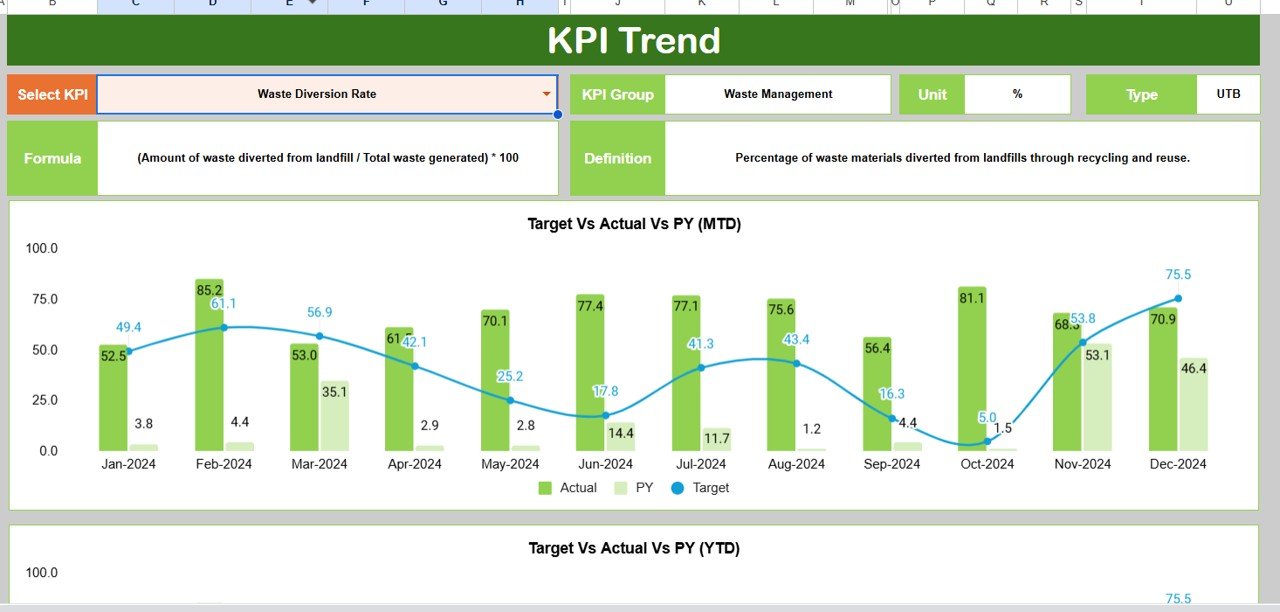
2️⃣ KPI Trend Sheet Tab – Choose any KPI (cell C3) to view its definition, formula, unit, and monthly progress chart — all automated and visually appealing.
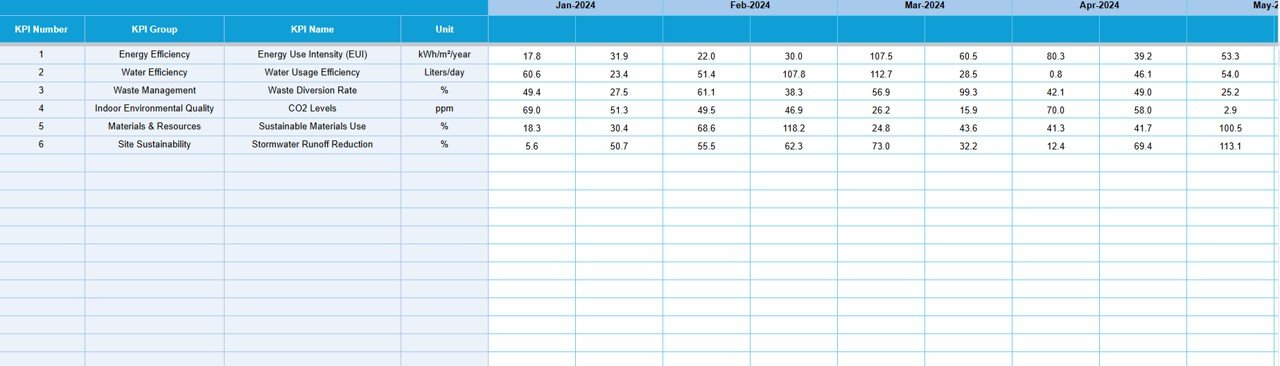
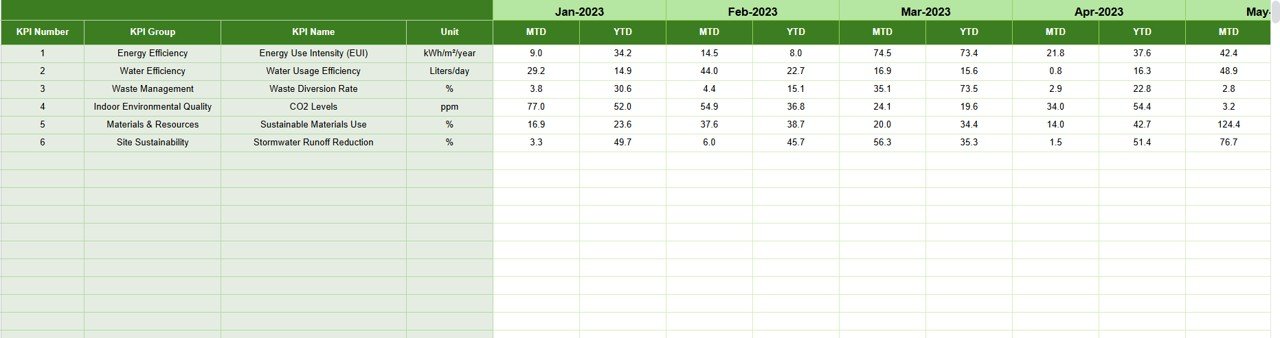
3️⃣ Actual Numbers Sheet Tab – Enter monthly actual performance values for each KPI. The dashboard auto-updates with your input data.
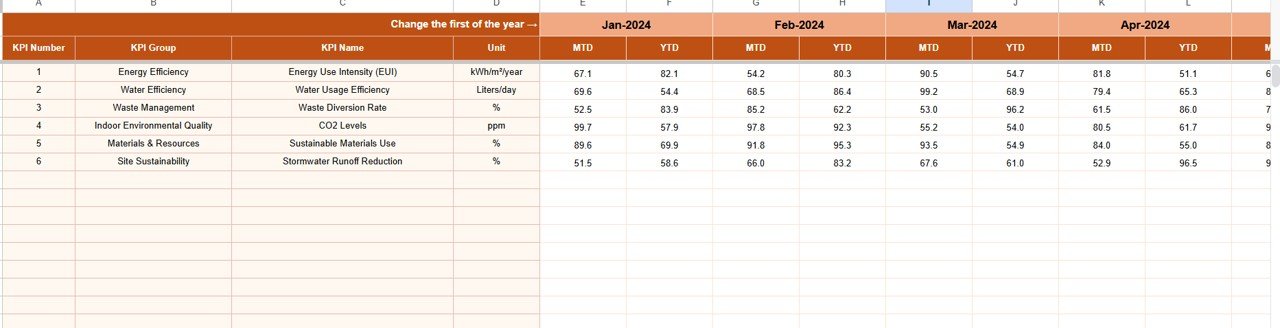
4️⃣ Target Sheet Tab – Input monthly and yearly target values to track progress and visualize goal achievement.
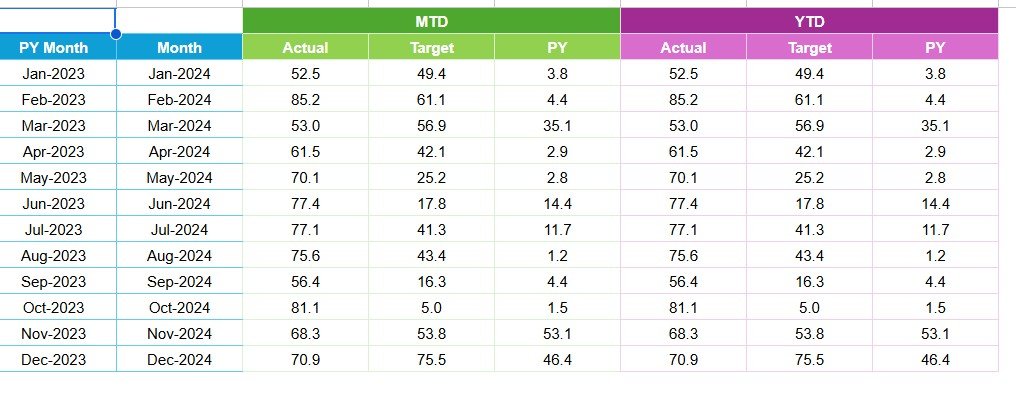
5️⃣ Previous Year Numbers Sheet Tab – Maintain last year’s data for performance benchmarking and year-over-year comparison.
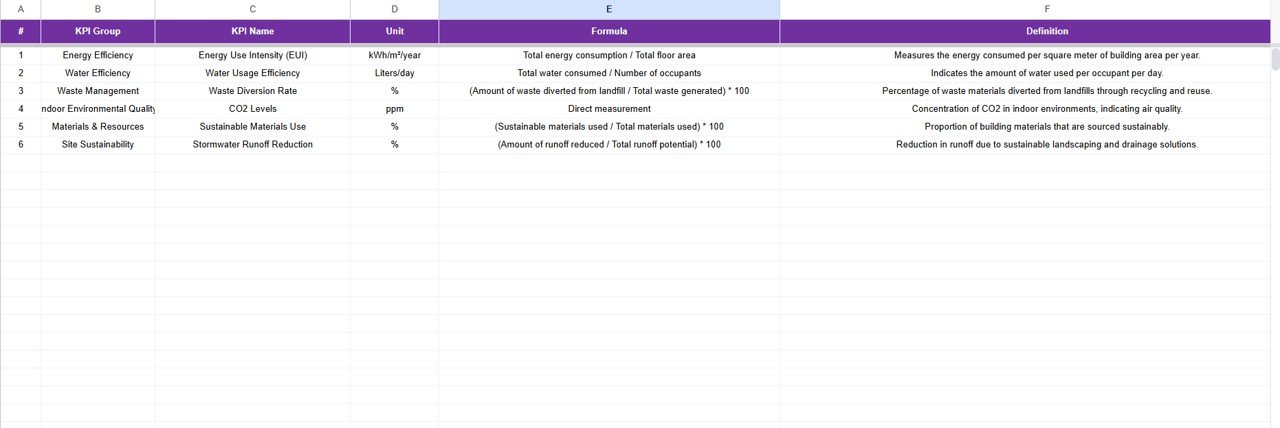
6️⃣ KPI Definition Sheet Tab – View a complete table of all KPIs with fields for KPI Group, Unit, Formula, Definition, and Type (Upper/Lower the Better).
Everything is connected, so when you update your actual or target data — the visuals, comparisons, and summaries refresh instantly. ⚙️
🧭 How to Use the Green Building KPI Dashboard
🚀 Step 1: Open the Google Sheet and navigate to the “Dashboard” tab.
📅 Step 2: Select your desired month using the dropdown in cell D3.
✏️ Step 3: Update actual data in the “Actual Numbers” sheet and targets in the “Target” sheet.
📉 Step 4: Compare the results — green arrows show improvement, red arrows indicate areas needing attention.
📊 Step 5: Use the “KPI Trend” sheet to explore individual KPI performance and monthly variations.
✅ Step 6: Regularly update values to keep your data fresh and performance analysis accurate.
👥 Who Can Benefit from This Green Building KPI Dashboard
🏢 Facility Managers – Monitor and improve building energy efficiency.
🌍 Sustainability Teams – Track environmental KPIs to meet green certification standards.
🏫 Educational Institutions – Engage students and staff in sustainability awareness.
🏗️ Corporate Offices – Reduce operational costs and carbon footprint.
💼 Consultants & Auditors – Use measurable data for reporting and compliance.
⚙️ Operations Managers – Make informed decisions with visual, data-backed insights.
📈 Executives & Investors – Gain visibility into sustainability performance and ROI.
This dashboard helps everyone stay aligned toward the same goal — a greener, smarter, and more efficient future. 🌱


Reviews
There are no reviews yet.