



The Brand Consistency KPI Dashboard in Excel is an essential tool designed for marketers, brand managers, and businesses aiming to monitor and maintain consistent branding across all their platforms. This Excel-based dashboard provides a comprehensive way to track key performance indicators (KPIs) related to brand consistency, including visual elements, messaging, tone, and audience engagement.
Brand consistency is crucial in ensuring that your brand’s image remains strong and recognizable across all marketing channels. This dashboard helps you track and analyze brand performance, ensuring alignment with your brand guidelines. It’s perfect for tracking consistency in your branding efforts, evaluating how well your branding resonates with your target audience, and adjusting strategies accordingly.
Key Features of the Brand Consistency KPI Dashboard in Excel
🎨 Brand Visual Consistency Tracking
Monitor the consistency of your brand’s visual elements, including logos, colors, fonts, and design templates across all media platforms. Ensure your visual identity remains aligned with brand guidelines.
📝 Messaging & Tone Consistency
Evaluate the consistency of your brand messaging and tone across different platforms and marketing campaigns. Ensure that your messaging is uniform and conveys the same message to your audience.
📈 Audience Engagement & Perception
Track how well your brand is engaging with your audience. Analyze KPIs related to social media interaction, email campaigns, and audience perception to ensure consistency in customer experience.
📊 Brand Guidelines Compliance
Measure how well your marketing materials and communications comply with established brand guidelines. Track compliance rates for visual and messaging elements to ensure your team is adhering to your brand standards.
📅 Time-Based Performance Monitoring
Evaluate your brand’s consistency over different time periods (daily, weekly, monthly). Identify trends, seasonal changes, or inconsistencies that might require adjustments.
⚙️ Customizable KPIs & Metrics
Customize the dashboard with your own KPIs and metrics that are important for your brand consistency efforts. Adjust the dashboard to track specific aspects of brand performance relevant to your business.
Why You’ll Love the Brand Consistency KPI Dashboard in Excel

✅ Ensure Brand Uniformity Across Platforms
Track visual and messaging consistency across multiple platforms to ensure your brand’s image remains strong and recognizable.
✅ Measure Audience Engagement
Monitor audience reactions and engagement across all marketing channels. Use this data to adjust your strategies and improve brand interactions.
✅ Evaluate Compliance with Brand Guidelines
Keep your branding efforts aligned with your established guidelines by tracking compliance rates across all your marketing materials.
✅ Real-Time Performance Tracking
Access real-time insights into how well your branding is performing. Make data-driven decisions to adjust your campaigns and ensure brand consistency.
✅ Fully Customizable for Your Brand Needs
Tailor the dashboard to track the KPIs most relevant to your brand’s goals and objectives. Adjust the tool to monitor specific brand elements and performance metrics.
What’s Inside the Brand Consistency KPI Dashboard in Excel?
- Brand Visual Consistency: Track logos, colors, fonts, and design templates to ensure consistent branding across platforms.
- Messaging & Tone Consistency: Monitor the uniformity of your brand’s messaging and tone in all communications.
- Audience Engagement & Interaction: Evaluate how your brand is engaging with its target audience.
- Brand Guidelines Compliance: Track compliance with brand standards across all media and marketing materials.
- Time-Based Performance Monitoring: Measure brand consistency over various time periods for insights on trends and improvements.
- Customizable KPIs & Metrics: Tailor the dashboard to suit your specific brand consistency goals.
How to Use the Brand Consistency KPI Dashboard in Excel
1️⃣ Download the Template: Get instant access to the Brand Consistency KPI Dashboard in Excel.
2️⃣ Input Your Data: Add your brand’s visual and messaging data to track performance across all marketing channels.
3️⃣ Set Your KPIs & Metrics: Customize the dashboard to track specific KPIs such as visual consistency, messaging alignment, and audience engagement.
4️⃣ Track Brand Performance: Monitor how well your brand is performing in terms of consistency, audience engagement, and guideline compliance.
5️⃣ Analyze & Visualize Data: Use charts and graphs to visualize trends and identify areas for improvement.
Who Can Benefit from the Brand Consistency KPI Dashboard in Excel?
🔹 Brand Managers & Marketing Professionals
🔹 Digital Marketing Teams & Social Media Managers
🔹 Content Creators & Copywriters
🔹 Small & Medium Enterprises (SMEs)
🔹 Large Corporations with Multiple Brand Guidelines
🔹 Agencies Managing Multiple Brands
Ensure that your brand remains strong, consistent, and recognizable with the Brand Consistency KPI Dashboard in Excel. Track visual elements, messaging, audience engagement, and compliance to ensure a unified brand experience across all marketing channels.
Click here to read the Detailed blog post
Visit our YouTube channel to learn step-by-step video tutorials
Youtube.com/@PKAnExcelExpert
Watch the step-by-step video Demo:
Compatibility and Requirements
- Works in Microsoft Excel desktop (Excel 2016 or later, or Microsoft 365).
- Results are shown in charts. Microsoft explains Excel charts in Create a chart from start to finish.
Frequently Asked Questions
What does the Brand Consistency KPI Dashboard track?
It tracks visual consistency (logos, colors, fonts and design templates), messaging and tone, audience engagement and perception, and compliance with brand guidelines.
Can I measure brand guideline compliance?
Yes. You can track compliance rates for visual and messaging elements in your marketing materials.
Can I review results over time?
Yes. You can review consistency by day, week or month to spot trends and gaps.
Can I add my own KPIs?
Yes. You can add your own KPIs and metrics for the parts of brand performance that matter to you.
Related Brand and Marketing Templates
- Brand Awareness KPI Dashboard in Excel: track brand awareness KPIs in Excel
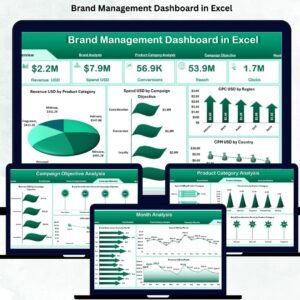
- Brand Management Dashboard in Excel: a full brand management dashboard in Excel
- Brand Identity Checklist Template in Excel: check brand identity elements with an Excel checklist
- Brand Awareness KPI Dashboard in Google Sheets: brand awareness KPIs in Google Sheets
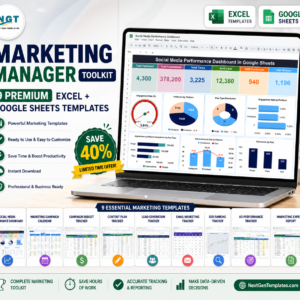
- Marketing Manager Toolkit: 9 marketing templates in one download
Browse all Excel KPI dashboards or the Excel sales and marketing templates.



























Reviews
There are no reviews yet.