



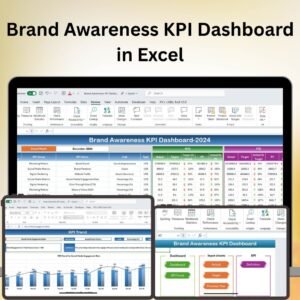
The Brand Awareness KPI Dashboard in Excel is a powerful tool designed for businesses and marketers who want to track and evaluate their brand’s visibility and performance. This interactive Excel dashboard enables you to monitor key performance indicators (KPIs) such as social media engagement, website traffic, brand mentions, and customer sentiment, all in one centralized location.
With the ability to track and visualize important metrics, this dashboard provides actionable insights to optimize your brand awareness efforts. Whether you’re a marketing team leader, a brand manager, or a business owner, this tool helps you measure the effectiveness of your brand awareness campaigns and identify areas for improvement.

Key Features of the Brand Awareness KPI Dashboard in Excel:
📊 Comprehensive KPI Tracking
Track key metrics that impact brand awareness, including social media engagement, website traffic, brand mentions, and customer sentiment, to evaluate your brand’s visibility.
📈 Social Media Analytics
Monitor engagement rates, likes, shares, comments, and follower growth on platforms like Facebook, Instagram, Twitter, and LinkedIn, ensuring that your social media campaigns are driving the desired outcomes.
🌐 Website Traffic Analysis
Track metrics such as website visits, bounce rate, time on site, and referral sources to understand how your brand’s online presence is performing and which channels drive traffic.
📣 Brand Mentions and Reach
Monitor brand mentions across the web and social media to assess the reach of your brand and the overall perception of your products or services.
🧑💻 Customer Sentiment Analysis
Analyze customer feedback, reviews, and sentiment analysis to measure public perception of your brand and determine how positive or negative brand mentions are.
💬 Customizable Reporting
Generate detailed reports to share with stakeholders, helping you showcase brand awareness efforts and their impact on business growth.
🚀 Why You’ll Love the Brand Awareness KPI Dashboard in Excel:
✅ Track Brand Visibility – Monitor your brand’s presence across various channels, including social media, websites, and customer feedback platforms, all in one place.
✅ Measure Marketing Impact – Use KPIs to evaluate the effectiveness of your brand awareness campaigns and make data-driven decisions to improve your marketing strategy.
✅ Boost Social Media Engagement – Track social media interactions and assess which platforms are delivering the highest engagement to optimize your social media marketing efforts.
✅ Optimize Website Traffic – Gain insights into website traffic trends and identify strategies to drive more visits to your site and increase brand exposure.
✅ Understand Public Perception – Measure customer sentiment to understand how your brand is perceived in the market and take action based on that feedback.
✅ Customizable and Flexible – Adapt the dashboard to suit your specific brand awareness goals, whether you’re tracking a new product launch or monitoring overall brand performance.
What’s Inside the Brand Awareness KPI Dashboard in Excel:
- Brand Awareness Tracking: Monitor metrics like brand mentions, reach, and overall visibility.
- Social Media Analytics: Track likes, shares, comments, and followers across major platforms.
- Website Traffic Analysis: Monitor site visits, bounce rates, and referral sources.
- Customer Sentiment: Analyze sentiment from customer feedback, reviews, and surveys.
- Campaign Performance: Track the effectiveness of brand awareness campaigns and analyze key KPIs for each campaign.
- Customizable Reports: Generate detailed reports that highlight key insights for stakeholders and marketing teams.
How to Use the Brand Awareness KPI Dashboard in Excel:
1️⃣ Download the Template – Instantly access your Excel file upon purchase.
2️⃣ Input Your Brand Data – Add social media metrics, website traffic, brand mentions, and customer feedback data into the dashboard.
3️⃣ Track Brand Performance – Use the dashboard to monitor brand visibility and engagement across various channels in real time.
4️⃣ Analyze Trends and Patterns – Utilize Power Excel functions to evaluate trends, patterns, and areas where brand awareness efforts need adjustment.
5️⃣ Generate Reports – Easily generate reports summarizing your brand’s performance, ideal for sharing with stakeholders, teams, or executives.
Who Can Benefit from the Brand Awareness KPI Dashboard in Excel:
- Marketing Teams
- Brand Managers
- E-Commerce Managers
- Social Media Managers
- Digital Marketing Agencies
- Business Owners
- Public Relations Teams
- Content Creators
The Brand Awareness KPI Dashboard in Excel is a must-have tool for any business looking to measure, track, and improve its brand visibility. With this dashboard, you’ll be able to optimize your marketing strategies, boost brand awareness, and grow your business more effectively.
Click here to read the Detailed blog post
https://www.pk-anexcelexpert.com/brand-awareness-kpi-dashboard-in-excel/
Visit our YouTube channel to learn step-by-step video tutorials
Youtube.com/@PKAnExcelExpert
Compatibility and Requirements
- Works in Microsoft Excel desktop (Excel 2016 or later, or Microsoft 365).
- Enter your brand data in the workbook and the KPI views and reports update from it.
- Microsoft explains how Excel charts work in Create a chart from start to finish.
Frequently Asked Questions
What does the Brand Awareness KPI Dashboard track?
It tracks brand mentions and reach, social media engagement, website traffic, customer sentiment and campaign performance.
Which social media metrics are included?
It covers engagement rates, likes, shares, comments and follower growth for platforms such as Facebook, Instagram, Twitter and LinkedIn.
What data do I need to enter?
You add social media metrics, website traffic, brand mentions and customer feedback data.
Can I share results with stakeholders?
Yes. The dashboard includes customizable reports you can share with stakeholders and marketing teams.
Related Brand and Marketing Templates
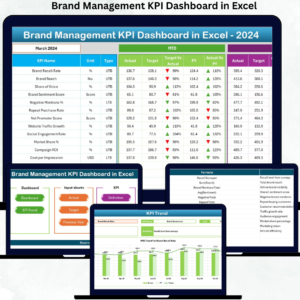
- Brand Management KPI Dashboard in Excel: brand KPIs against targets
- Brand Consistency KPI Dashboard in Excel: track how consistent your brand is
- Brand Management Dashboard in Excel: a page based brand dashboard
- Marketing Dashboard in Excel: wider marketing analysis
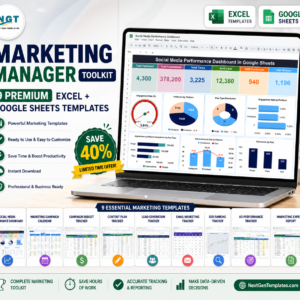
- Marketing Manager Toolkit: 9 Excel and Google Sheets marketing templates in one bundle
Browse all Excel KPI dashboards or the Excel sales and marketing templates.






























Reviews
There are no reviews yet.