

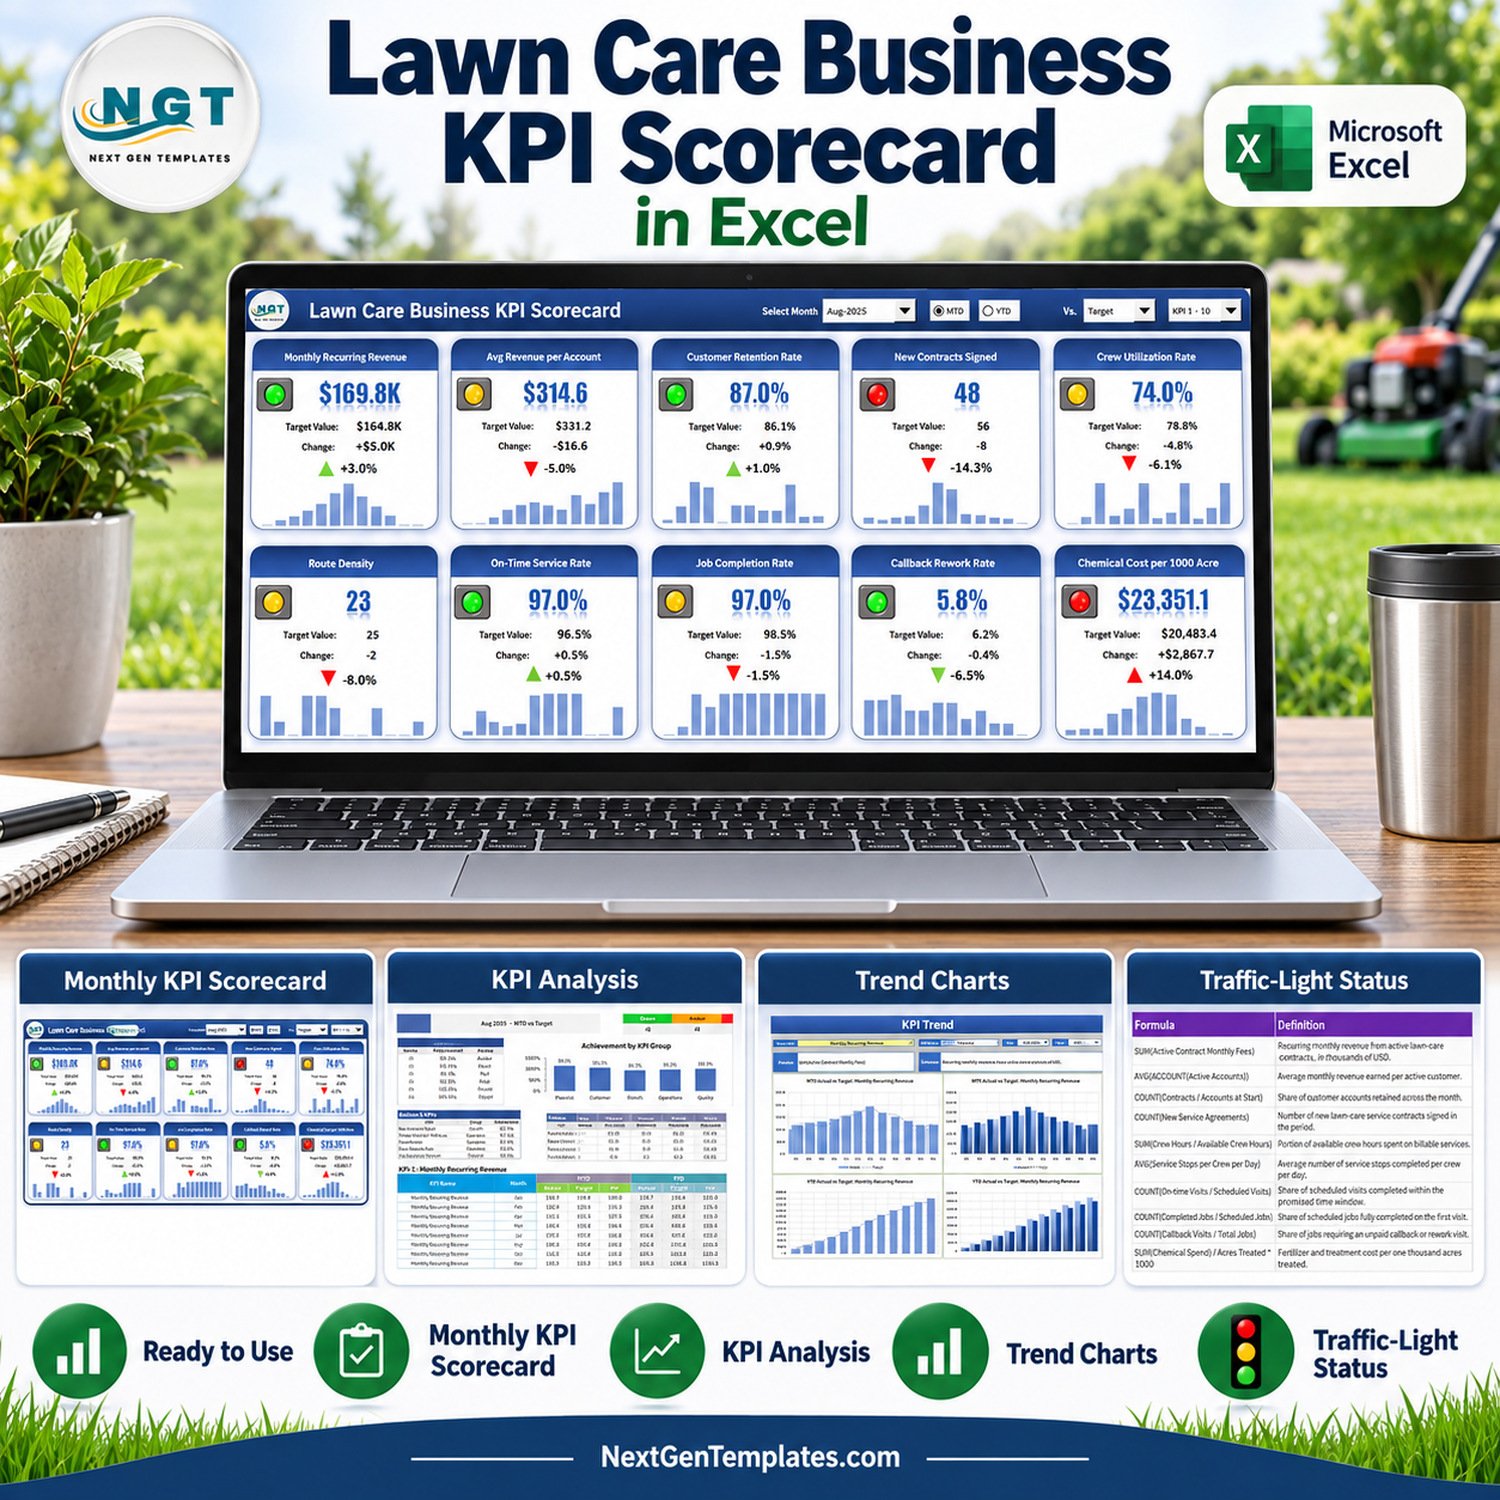
The Lawn Care Business KPI Scorecard in Excel puts 10 KPIs from 5 KPI groups on one monthly tile wall, each tile with a value, a target, a change figure, a red / amber / green traffic light and a 12-month sparkline. Pick a month, switch between MTD and YTD, and compare against Target, last year (PY) or the prior month. The sample file opens on August 2025 with 4 Green, 4 Amber and 2 Red KPIs, and the workbook has room for 20 KPIs.
📌 Which product is this? This is the Excel KPI Scorecard edition: a tile-wall scorecard with KPI Analysis, KPI Trend, Input Data, KPI Definition and Color Settings sheets. It is a different template from our analytical Excel templates and from the Lawn Care Business KPI Dashboard edition, which is still in preparation.
✅ Instant download · One-time payment · No subscription · No macros · .xlsx workbook plus PDF user manual
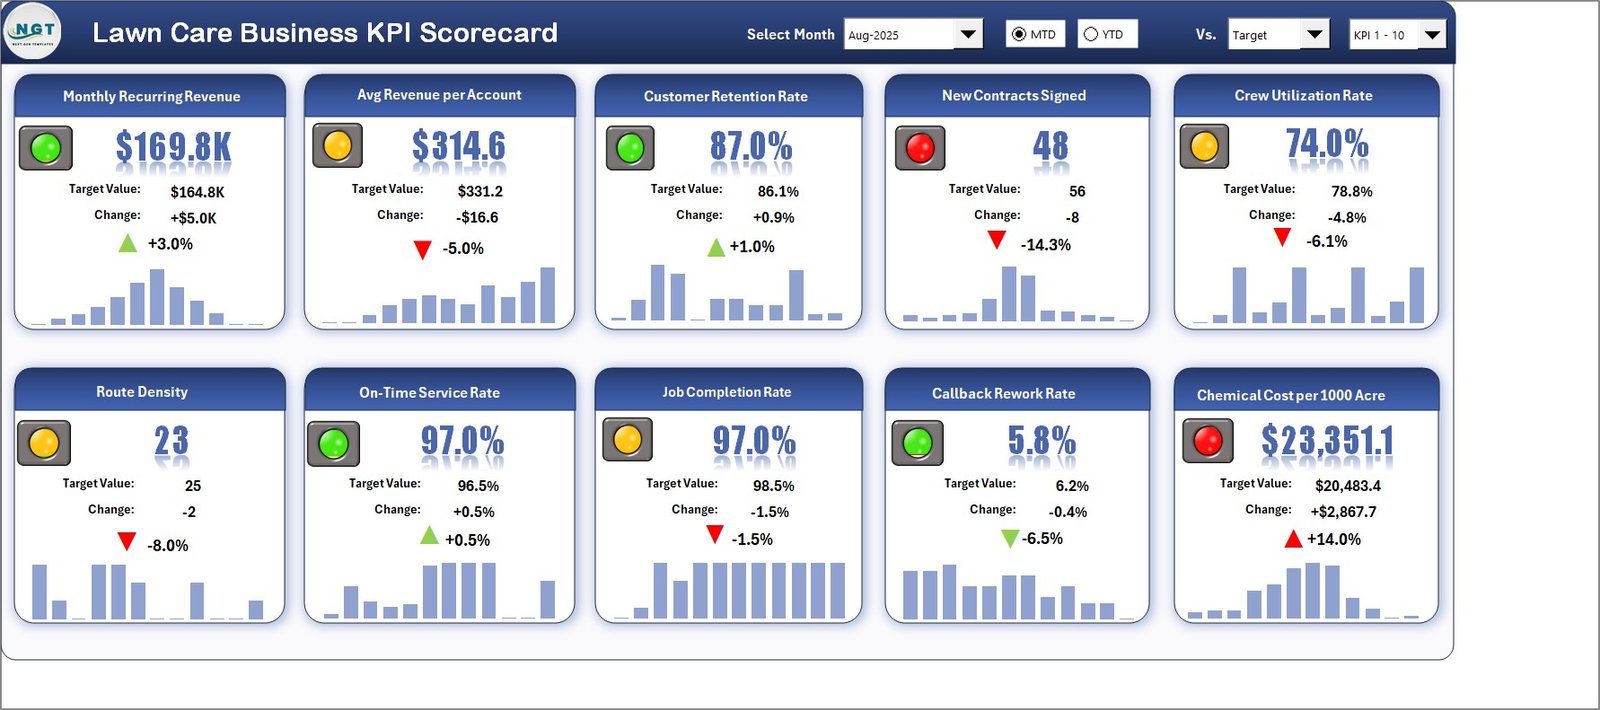
🔑 Key Features of the Lawn Care Business KPI Scorecard in Excel
🌱 10 lawn care KPIs, ready to rename – Monthly Recurring Revenue, Avg Revenue per Account, Customer Retention Rate, New Contracts Signed, Crew Utilization Rate, Route Density, On-Time Service Rate, Job Completion Rate, Callback Rework Rate and Chemical Cost per 1000 Acre, filed under Financial, Customer, Growth, Operations and Quality.
📅 Month picker with an MTD / YTD switch – Select Month lists January to December of the reporting year. The picker stores a month number, and every tile, light, arrow and sparkline looks its figures up from that number, so changing the month refreshes the whole page at once.
🎯 Three comparison modes – the Vs. dropdown compares actual figures against Target, against the same period last year (PY), or against the Prior Month. Targets and PY values sit next to the actuals on Input Data, so each mode reads from numbers you already typed.
↕️ Direction-aware traffic lights – 8 KPIs are upper-the-better (UTB) and 2 are lower-the-better (LTB): Callback Rework Rate and Chemical Cost per 1000 Acre. A falling callback rate therefore shows a green light, while a cost that runs 14% over target shows red.
🎨 Bands you control – Color Settings holds the thresholds. By default a KPI is Green at or above target, Amber within 10% of target and Red more than 10% off. Move the bands once and every page follows.
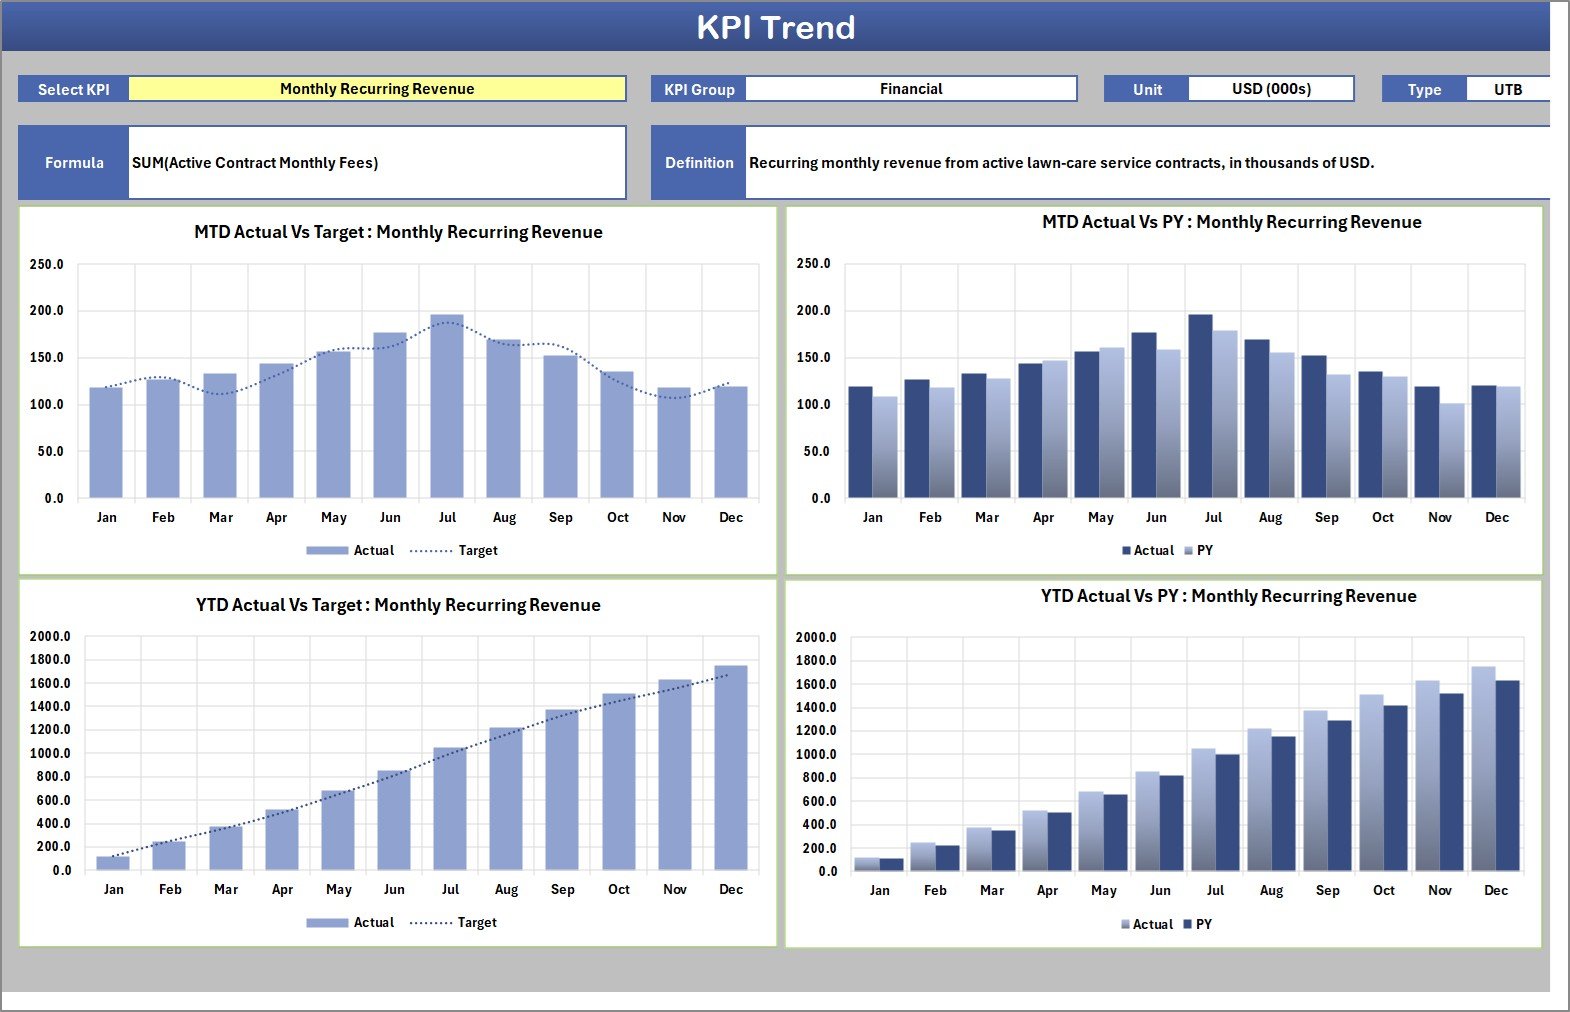
📈 Analysis and trend pages – KPI Analysis ranks achievement by KPI group and lists the five strongest and five weakest KPIs of the month. KPI Trend draws four charts for any single KPI: MTD and YTD actuals against target and against last year.
🔓 No macros – built from formulas, conditional formatting, camera pictures and sparklines in a plain .xlsx file. There is nothing to enable, no Power Query and no add-ins.
📦 What’s Inside the Workbook
The download holds one .xlsx workbook with 9 visible sheets and the Excel KPI Scorecard user manual as a PDF. You type on two sheets only (Input Data and KPI Definition); the rest calculate.
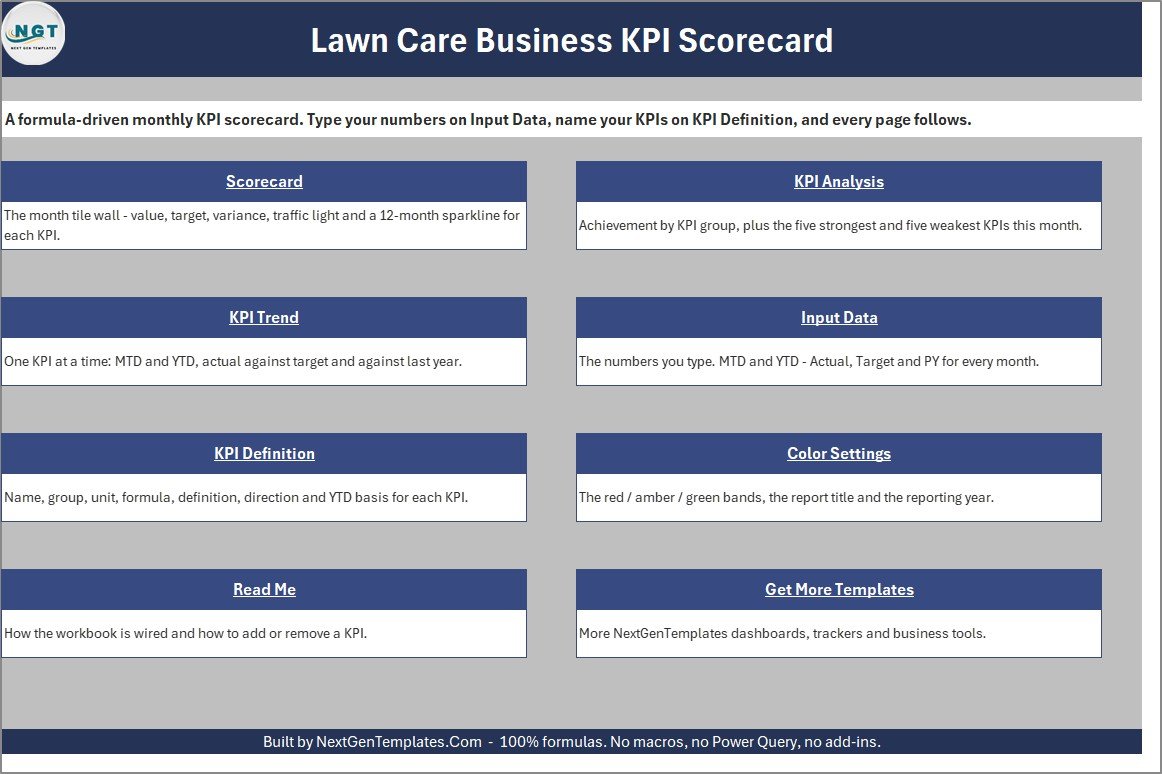
Page 1: Home
A navigation page with eight linked buttons (Scorecard, KPI Analysis, KPI Trend, Input Data, KPI Definition, Color Settings, Read Me and Get More Templates), each with a one-line description of what that sheet does.
Page 2: Scorecard
Ten KPI tiles in two rows of five. In the sample month Monthly Recurring Revenue reads $169.8K against a $164.8K target (+3.0%, green), New Contracts Signed reads 48 against 56 (−14.3%, red) and Chemical Cost per 1000 Acre reads $23,351.1 against $20,483.4 (+14.0%, red). The header holds Select Month, MTD / YTD, Vs. and the KPI 1-10 / KPI 11-20 set picker.
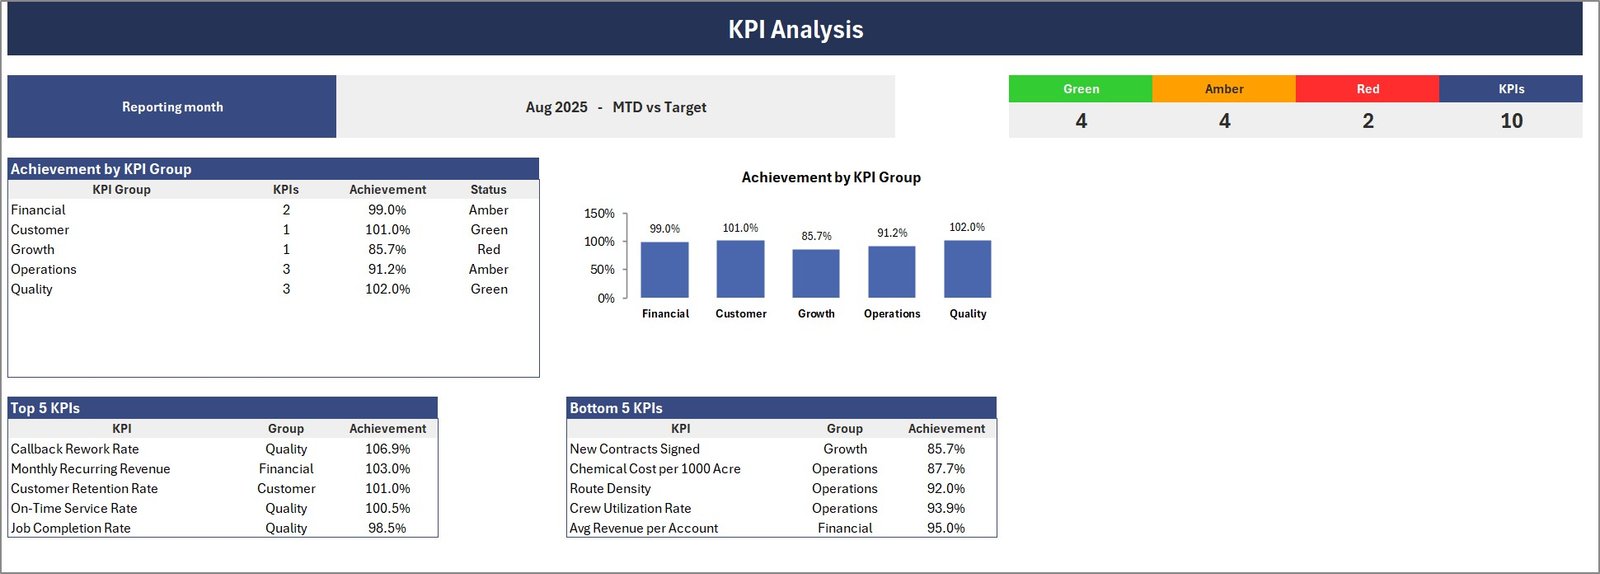
Page 3: KPI Analysis
Green / Amber / Red / KPIs counters (4 / 4 / 2 / 10 in the sample), an Achievement by KPI Group table and chart (Customer 101.0% and Quality 102.0% green, Growth 85.7% red), plus Top 5 KPIs and Bottom 5 KPIs tables. Callback Rework Rate leads at 106.9%; New Contracts Signed trails at 85.7%.
Page 4: KPI Trend
Choose one KPI to see its group, unit, type, formula and definition, then four charts across the year: MTD Actual vs Target, MTD Actual vs PY, YTD Actual vs Target and YTD Actual vs PY. The sample shows Monthly Recurring Revenue peaking in July at 195.7 (USD thousands).
Page 5: Input Data
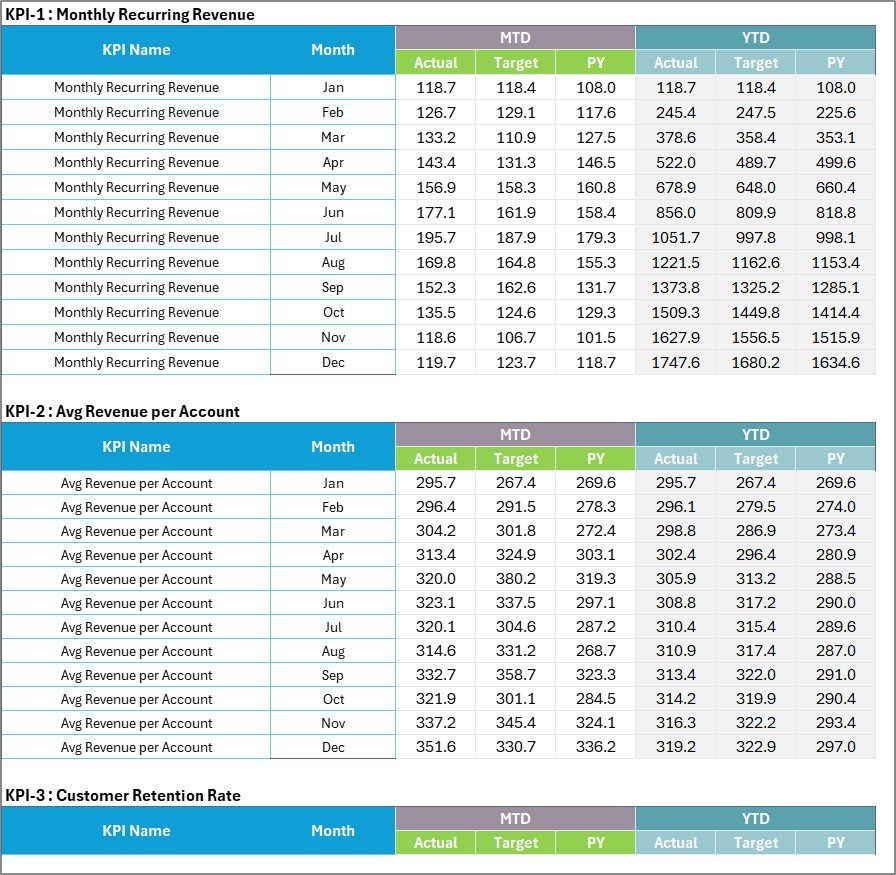
One numbered block per KPI with twelve month rows and six columns: MTD Actual, Target and PY, then YTD Actual, Target and PY. There are 20 blocks, so ten slots stay free for your own KPIs.
Page 6: KPI Definition
The master list: KPI group, name, unit, formula, definition, type (UTB or LTB) and YTD basis (Sum or Average), with a Check column that flags a duplicate name.

Page 7: Color Settings
Separate RAG bands for upper-the-better and lower-the-better KPIs, plus the report title and reporting year that feed the header and the month list.

Page 8: Read Me
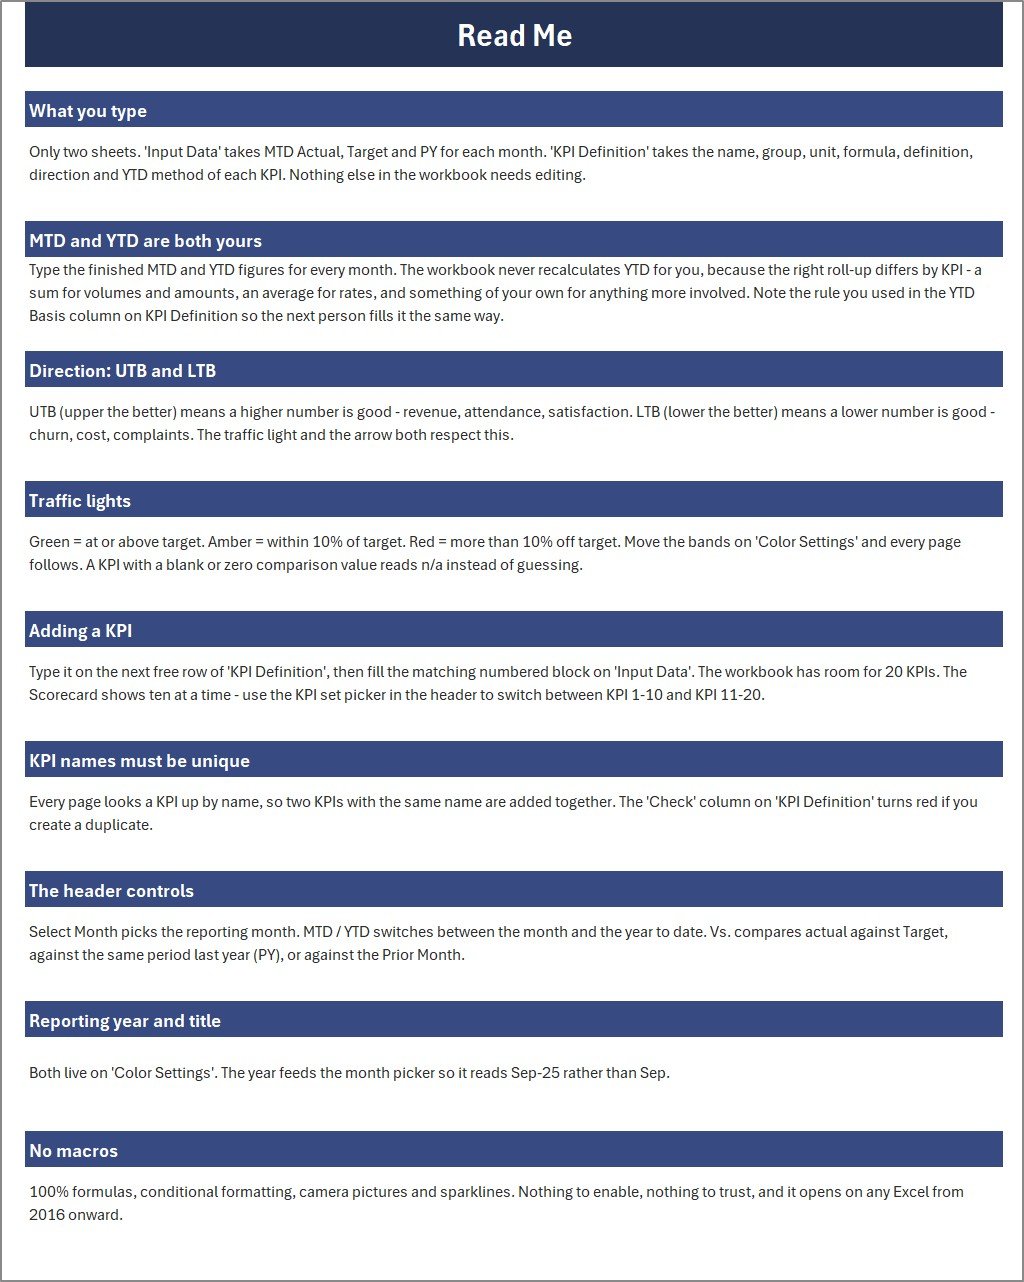
Plain-language notes on what to type, how UTB and LTB work, how the lights are banded, how to add a KPI and what each header control does.
Page 9: Get More Templates
A short guide to other NextGenTemplates product families and a contact line for customisation requests.
📊 This Excel Scorecard vs. a Google Sheets Scorecard vs. Field Service Software — Where This Fits
| Feature | Lawn Care KPI Scorecard (Excel) | Build-your-own Google Sheets scorecard | Field service software (Jobber / LMN / Service Autopilot) |
|---|---|---|---|
| Cost | ✅ $9.99 one-time (sale) | Free tool, but hours of build time | Recurring monthly subscription |
| Platform | Desktop Microsoft Excel (.xlsx) | Browser | Web and mobile app |
| Setup time | ✅ Minutes: rename KPIs, type figures | Days to design formulas and lights | Onboarding plus data import |
| Monthly KPI traffic lights | ✅ 10 tiles, editable bands | Only if you build them | Depends on plan and reports |
| Target, PY and prior-month comparison | ✅ One dropdown | Manual formulas | Varies by product |
| Scheduling, routing and invoicing | ❌ Not included | ❌ Not included | ✅ Core feature |
| Real-time team collaboration | Share the file; one editor at a time works best | ✅ Live co-editing | ✅ Multi-user |
| Mobile access | View only; header controls need desktop Excel | ✅ Browser and app | ✅ Mobile app |
| Customizable KPIs | ✅ 20 slots, your names and units | ✅ Anything you build | Limited to built-in reports |
| Year-1 cost at 5 users | ✅ One purchase | Staff time | Subscription for every month |
For owners who already run jobs in a field service app but want one clear monthly KPI review without another subscription, this scorecard sits in the sweet spot.
👥 Who This Template Is For — and Who It’s Not For
✅ This template is built for:
- Owners of residential or commercial lawn care and landscaping companies who review results once a month
- Operations managers who want crew utilization, route density and callback rates on one page
- Bookkeepers or consultants preparing a monthly KPI pack for a lawn care client
❌ This template is NOT for:
- Teams that need job scheduling, crew routing, quoting or invoicing — this is a reporting template
- Anyone expecting a live feed from field service or accounting software; figures are typed or pasted
- Users who only have Excel for the web or a phone; the dropdowns and option buttons need desktop Excel
⚙️ How to Use the Scorecard
- Unzip the download and open the .xlsx in desktop Microsoft Excel. No macros to enable.
- On Color Settings, set the report title, the reporting year and, if you like, your own RAG bands.
- On KPI Definition, keep or rename the 10 KPIs and set each group, unit, UTB / LTB type and YTD basis.
- On Input Data, type MTD Actual, Target and PY plus the YTD figures for each month.
- On Scorecard, choose the month, MTD or YTD, and Target, PY or Prior Month.
- Review KPI Analysis for group achievement and KPI Trend for any single KPI.
💼 Real-World Use Cases
A four-crew residential lawn care owner types last month’s contract revenue, new signings and callbacks on the first Monday of the month. Two red tiles — New Contracts Signed and Chemical Cost per 1000 Acre — set the agenda for the crew leads meeting.
An operations manager at a commercial grounds company switches the Vs. dropdown to Prior Month to see whether route density and crew utilization recovered after a slow spring, then opens KPI Trend to compare this year’s curve with last year’s.
A bookkeeper serving several landscaping clients keeps one copy of the workbook per client, renames the KPIs to match what each client measures, and sends the KPI Analysis page as the monthly summary.
⚠️ Limits to Know Before You Buy
- YTD figures are typed, not calculated — the right roll-up differs by KPI, so the YTD Basis column records your rule.
- One reporting year per file and monthly totals only; there is no weekly or per-crew breakdown.
- Chemical Cost per 1000 Acre is a cost figure you enter. The workbook does not log product applications, rates or any regulatory or licensing records.
- A blank or zero comparison value shows n/a rather than a light, so a zero target cannot be scored.
- The form controls and camera pictures need desktop Excel; Excel for the web and mobile apps can view the file but not drive the header.
- Cosmetic: Read Me says the month picker reads “Sep-25”, while the list actually shows the four-digit form “Aug-2025”.
❓ Frequently Asked Questions
What KPIs does the Lawn Care Business KPI Scorecard in Excel track?
It ships with 10 KPIs: Monthly Recurring Revenue, Avg Revenue per Account, Customer Retention Rate, New Contracts Signed, Crew Utilization Rate, Route Density, On-Time Service Rate, Job Completion Rate, Callback Rework Rate and Chemical Cost per 1000 Acre. You can rename any of them and add up to 10 more.
Is this the same as the Lawn Care Business KPI Dashboard?
No. This is the scorecard edition — a 10-tile monthly wall with analysis, trend and settings sheets. The KPI Dashboard edition is a separate template with a different layout and KPI set, and it is still in preparation.
Do I need macros or Microsoft 365?
No macros are used; the file is a plain .xlsx built from formulas, conditional formatting, camera pictures and sparklines. Use desktop Microsoft Excel, because the month dropdown and MTD / YTD option buttons are form controls that Excel for the web cannot operate.
How long does setup take?
Most people are running in under an hour: set the year and title on Color Settings, rename the KPIs on KPI Definition, and type twelve months of actual, target and PY figures on Input Data. Every page updates as soon as the numbers are in.
How does it compare with Jobber or LMN?
Field service apps run scheduling, routing and invoicing on a subscription. This scorecard does none of that; it is a one-time-purchase monthly KPI review that you fill from the reports those systems already give you.
Can I change the traffic-light thresholds?
Yes. Color Settings holds separate bands for upper-the-better and lower-the-better KPIs. The defaults are green at or above target, amber within 10% and red more than 10% off, and every page follows whatever you set.
👤 About the Author
Built by PK and the NextGenTemplates team, who have published Excel, Google Sheets and Power BI tutorials on YouTube for years (@PKAnExcelExpert, @NextGenTemplates, @NeoTechNavigators). Every template is built and checked before release. Microsoft explains the controls used in the header in its overview of form controls in Excel.
🔗 Explore Related Templates
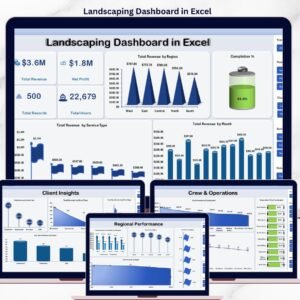
🌳 Landscaping Dashboard in Excel – an analytical dashboard for landscaping jobs, revenue and crews.
📊 Landscaping Dashboard in Power BI and Landscaping Dashboard in Google Sheets – the same topic on other platforms.
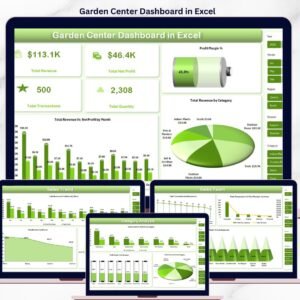
🌻 Garden Center Dashboard in Excel – for businesses that also sell plants and supplies.
🏊 Swimming Pool Service KPI Scorecard in Excel and Plumbing Business KPI Scorecard in Excel – sister scorecards for other field service trades.
📂 Browse every Excel KPI dashboard and scorecard template.
📖 Click here to read the Detailed Blog Post
🎥 Visit our YouTube channel for step-by-step video tutorials
👉 YouTube.com/@NextGenTemplates
📅 Last updated: September 2026





























Reviews
There are no reviews yet.