

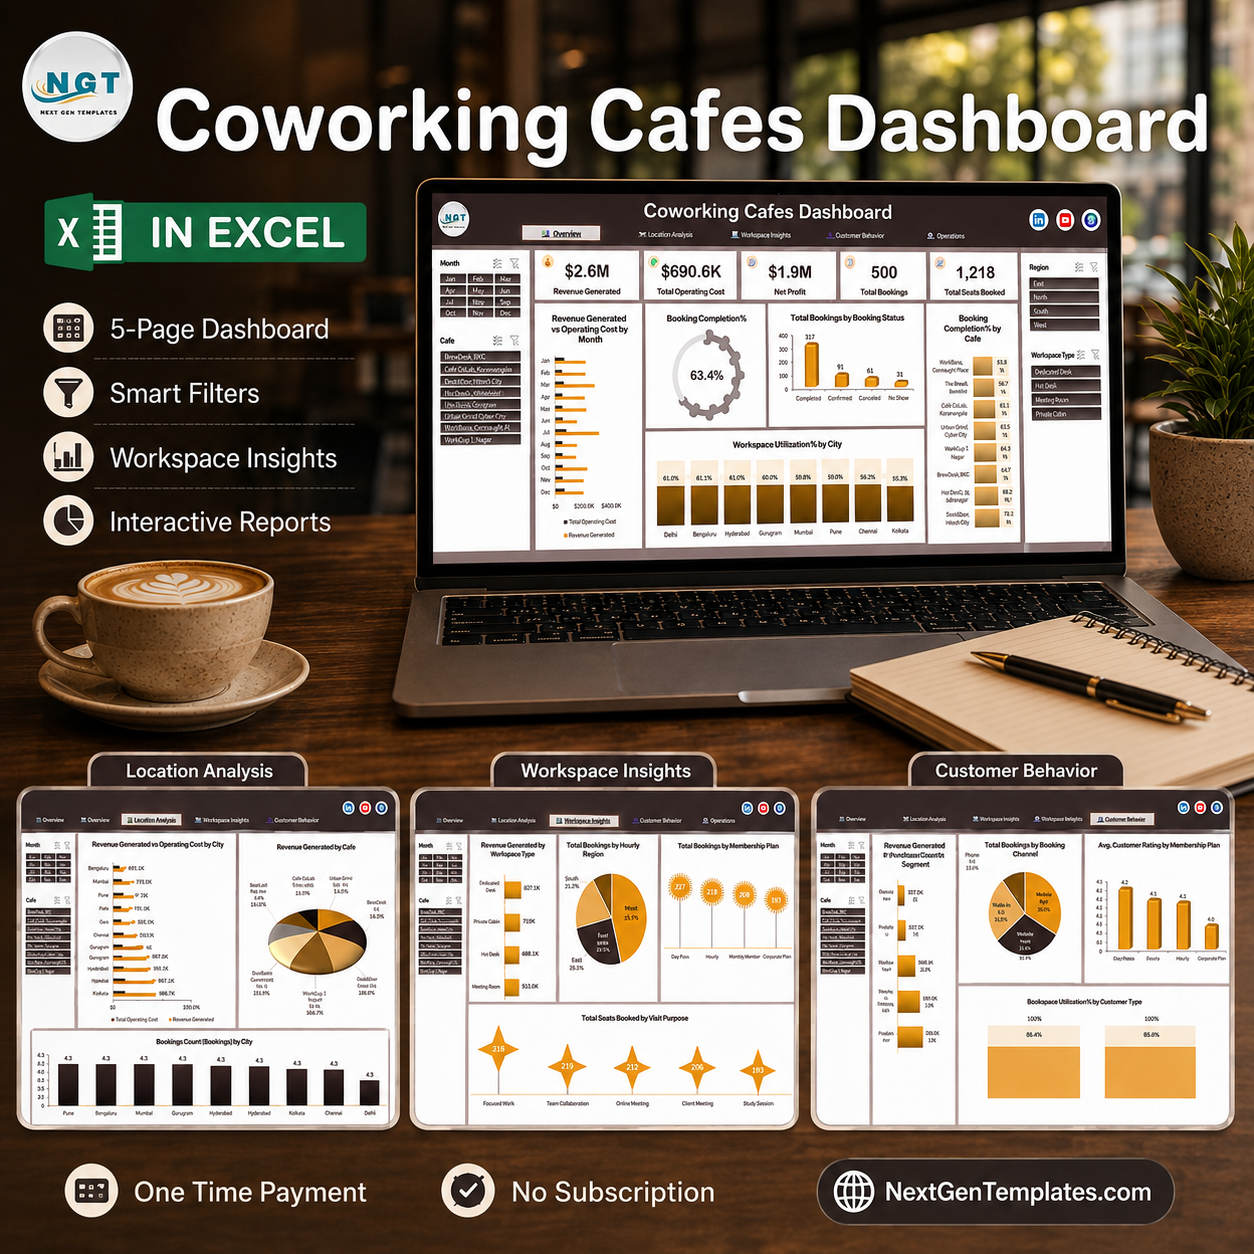
The Coworking Cafes Dashboard in Excel takes a full year of cafe-workspace trading and lays it out across five slicer-driven report pages. The sample build carries $2.6M in revenue generated, $690.6K of operating cost, $1.9M of net profit, 500 bookings and 1,218 seats booked across eight coworking cafes in eight cities, and every figure recalculates the moment you paste your own rows in. It is built on plain Excel formulas, pivot tables and slicers – no macros, no Power Pivot licence, no add-ins – so it opens on any machine running Excel 2016 or later, including Excel for Mac and Microsoft 365. Downloads are instant, the file is unlocked and fully editable, and if it does not open on your setup we refund it. Over 300,000 subscribers follow the NextGenTemplates channels for templates built this way. Coworking Cafes Dashboard in Excel
A note on which template this is, because NextGenTemplates ships more than one coworking template. This is the analytical Excel dashboard – five wide report pages you explore with four synced slicers, built for reading a multi-site cafe-workspace portfolio. It is not a monthly KPI scorecard with a month picker, target-versus-actual columns and traffic lights. If the scorecard format is what you want, browse the Excel KPI Dashboard category instead.
Key Features of the Coworking Cafes Dashboard in Excel
- Four synced slicers on every page. Month, Cafe, Region and Workspace Type sit in fixed left and right rails. Click The Study Roastery plus Meeting Room and all five pages answer that one question together.
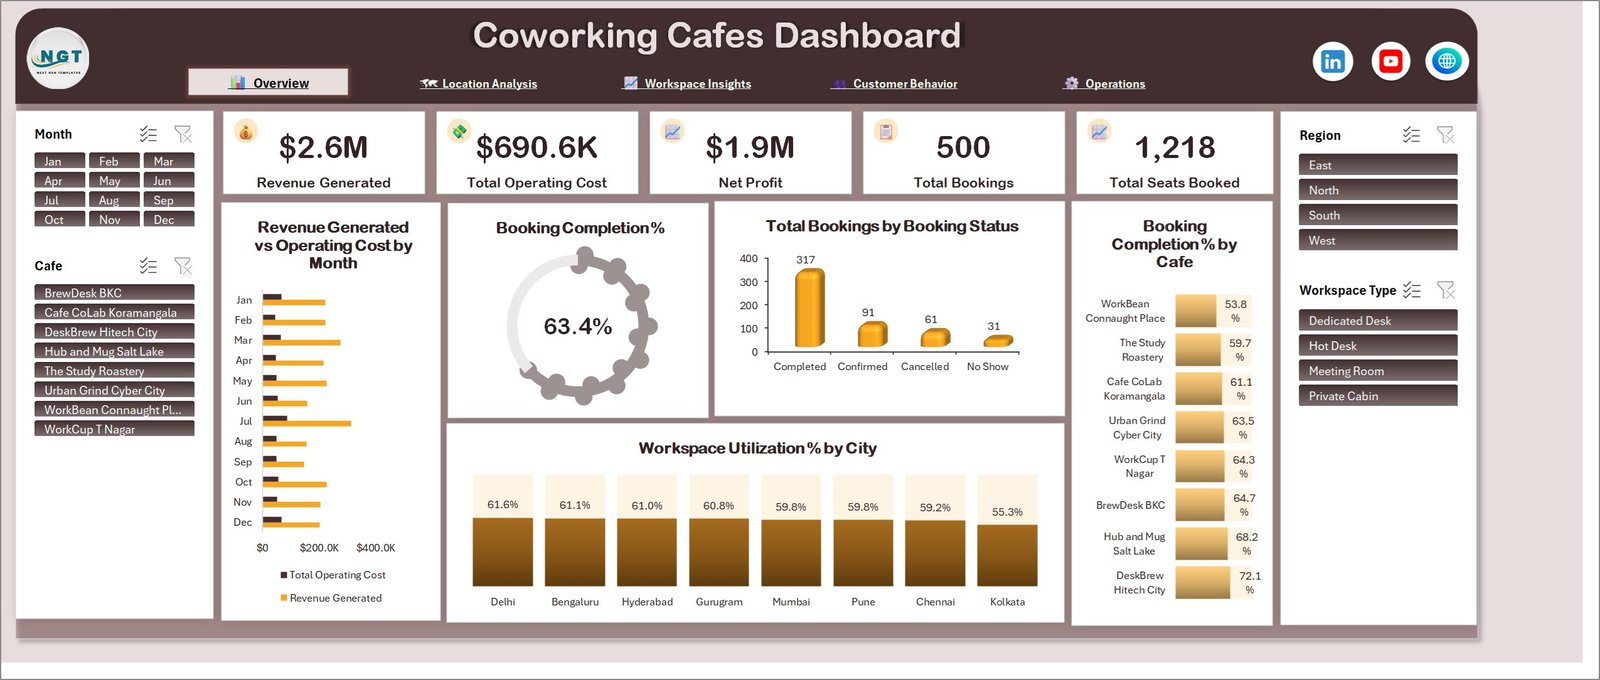
- Five headline cards. Revenue Generated, Total Operating Cost, Net Profit, Total Bookings and Total Seats Booked sit above the fold on the Overview page and move with the slicers.
- A booking completion donut. One 63.4% read on how many bookings actually turn into a seated session, so a rise in cancellations or no-shows is visible in a second.
- Booking status breakdown. Completed 317, Confirmed 91, Cancelled 61 and No Show 31 as a column chart on the Overview page, and again as a seat-weighted share on Operations.
- Cafe league table. Booking Completion % for all eight cafes, from DeskBrew Hitech City at 72.1% down to WorkBean Connaught Place at 53.8%, so a site that fills the diary but not the seats stands out.
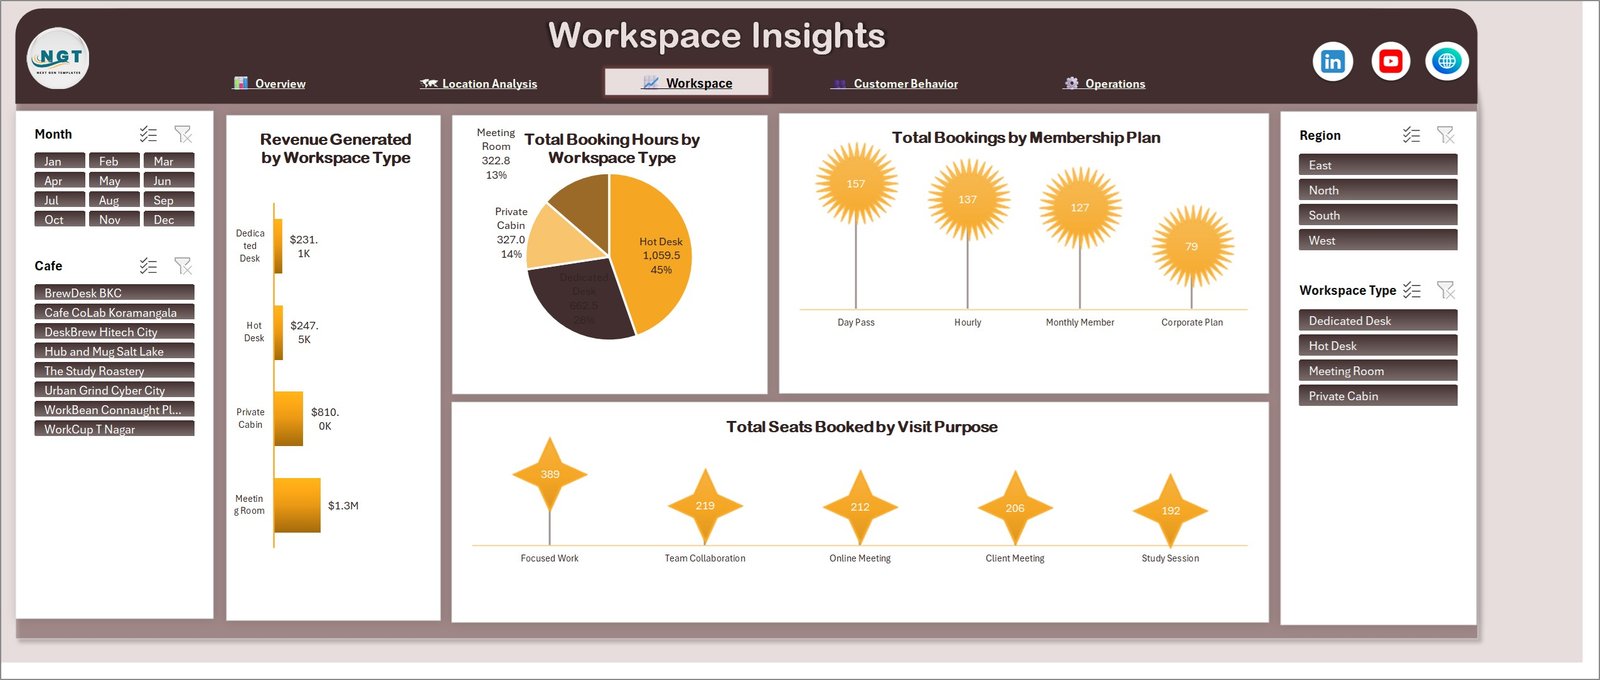
- Workspace-type economics. Revenue Generated and Total Booking Hours split across Meeting Room, Private Cabin, Hot Desk and Dedicated Desk – Hot Desk takes 45% of the hours while Meeting Room takes the revenue.
- Customer segment and channel views. Revenue by Freelancer, Remote Employee, Startup Team, Student and Consultant, plus bookings split across Website, Mobile App, Walk-in and Partner.
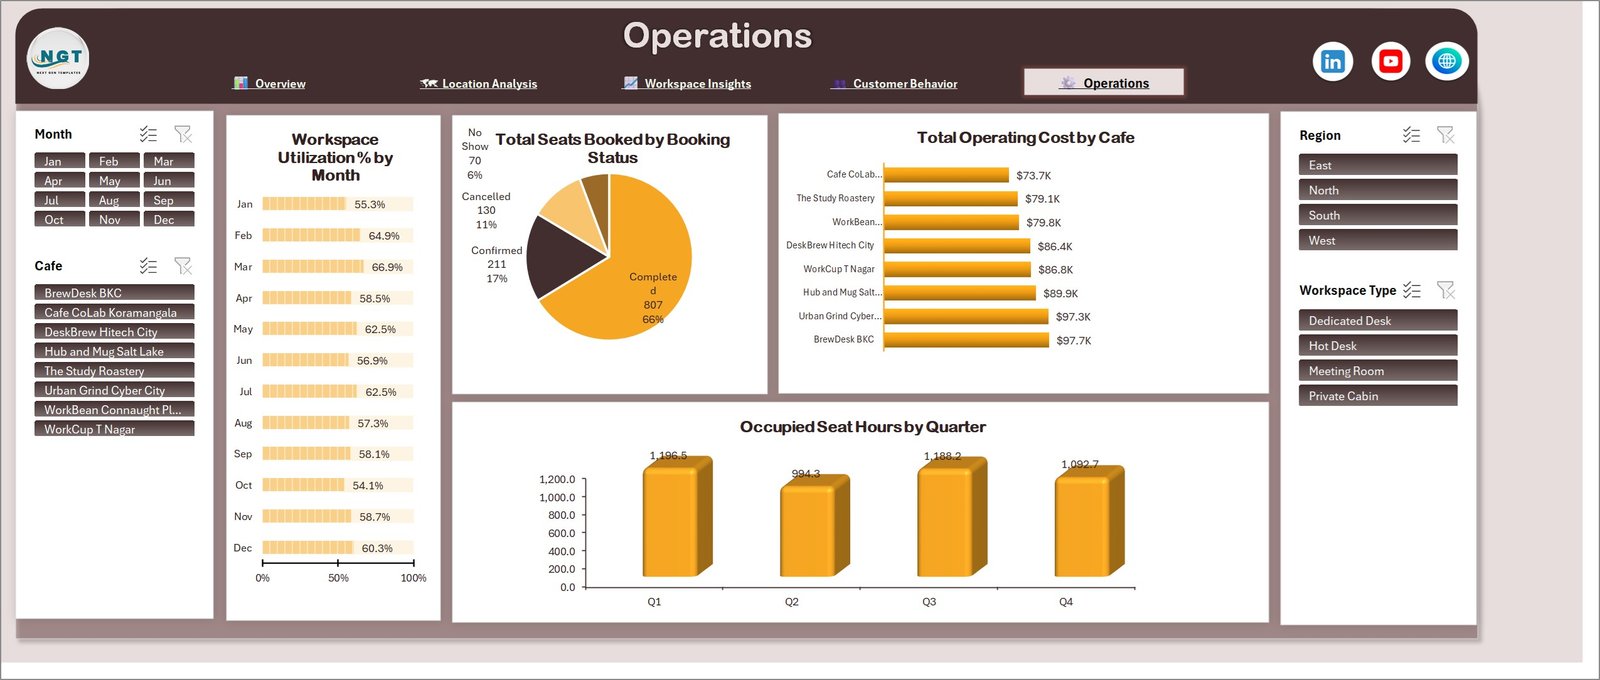
- Utilisation and cost operations page. Workspace Utilization % for all twelve months, Total Operating Cost by Cafe and Occupied Seat Hours by Quarter on one screen. Coworking Cafes Dashboard in Excel
- No macros, no add-ins. A plain .xlsx workbook of formulas and pivot-driven charts that passes corporate macro blocks.
- Paste your own data. Replace the sample rows, refresh, and every chart, card and slicer button rebuilds from your values.
What’s Inside the Coworking Cafes Dashboard in Excel
Page 1 – Overview. The five KPI cards, Revenue Generated vs Operating Cost by Month, the Booking Completion % donut at 63.4%, Total Bookings by Booking Status and Booking Completion % by Cafe, with Workspace Utilization % by City running along the bottom from Delhi at 61.6% to Kolkata at 55.3%.
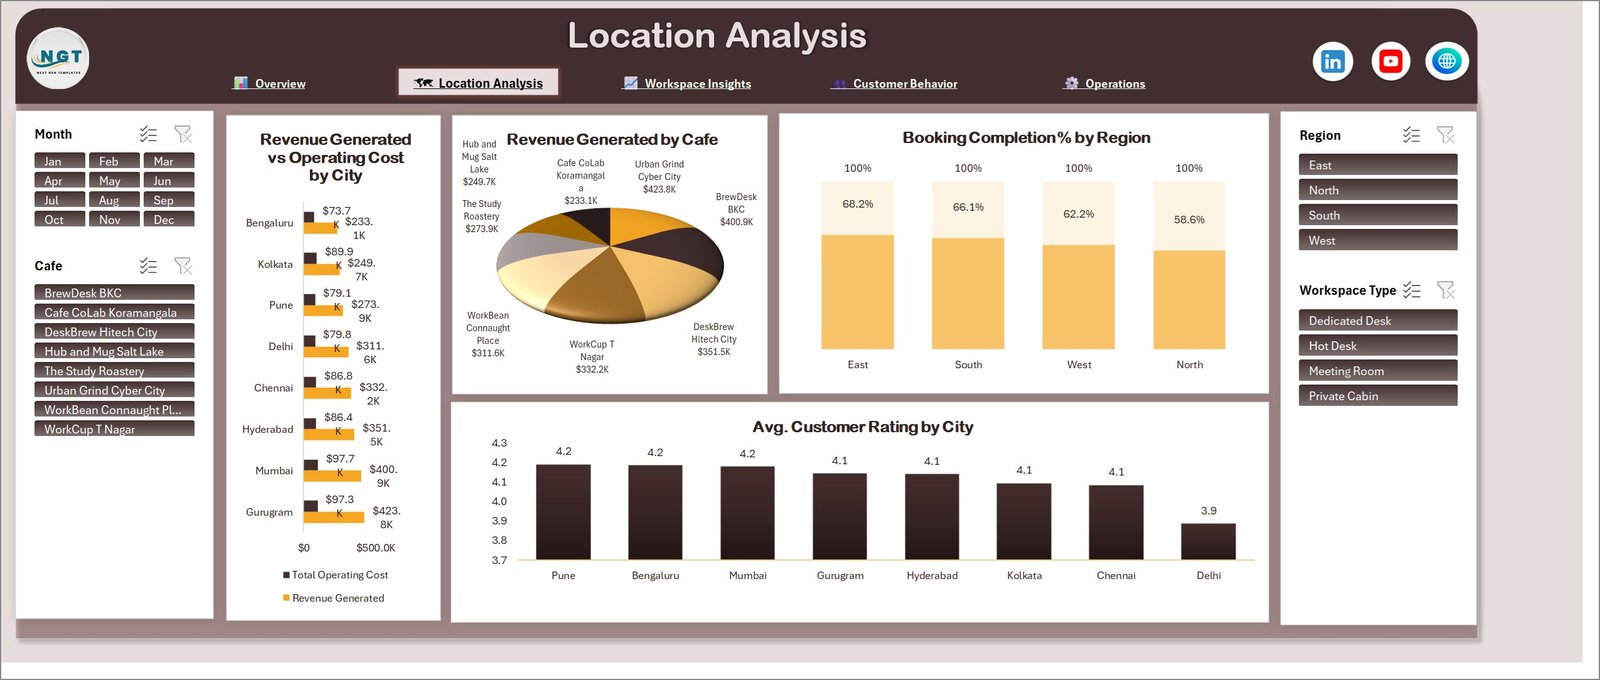
Page 2 – Location Analysis. Revenue Generated vs Operating Cost by City (Gurugram leads on $423.8K of revenue against $97.3K of cost; Bengaluru sits lowest at $233.1K against $73.7K), Revenue Generated by Cafe, Booking Completion % by Region (East 68.2%, South 66.1%, West 62.2%, North 58.6%) and Avg. Customer Rating by City, where Pune, Bengaluru and Mumbai hold 4.2 and Delhi trails at 3.9.
Page 3 – Workspace Insights. Revenue Generated by Workspace Type (Meeting Room $1.3M, Private Cabin $810.0K, Hot Desk $247.5K, Dedicated Desk $231.1K), Total Booking Hours by Workspace Type (Hot Desk 1,059.5 hours or 45%, Dedicated Desk 662.5, Private Cabin 327.0, Meeting Room 322.8), Total Bookings by Membership Plan (Day Pass 157, Hourly 137, Monthly Member 127, Corporate Plan 79) and Total Seats Booked by Visit Purpose, led by Focused Work at 389 seats.
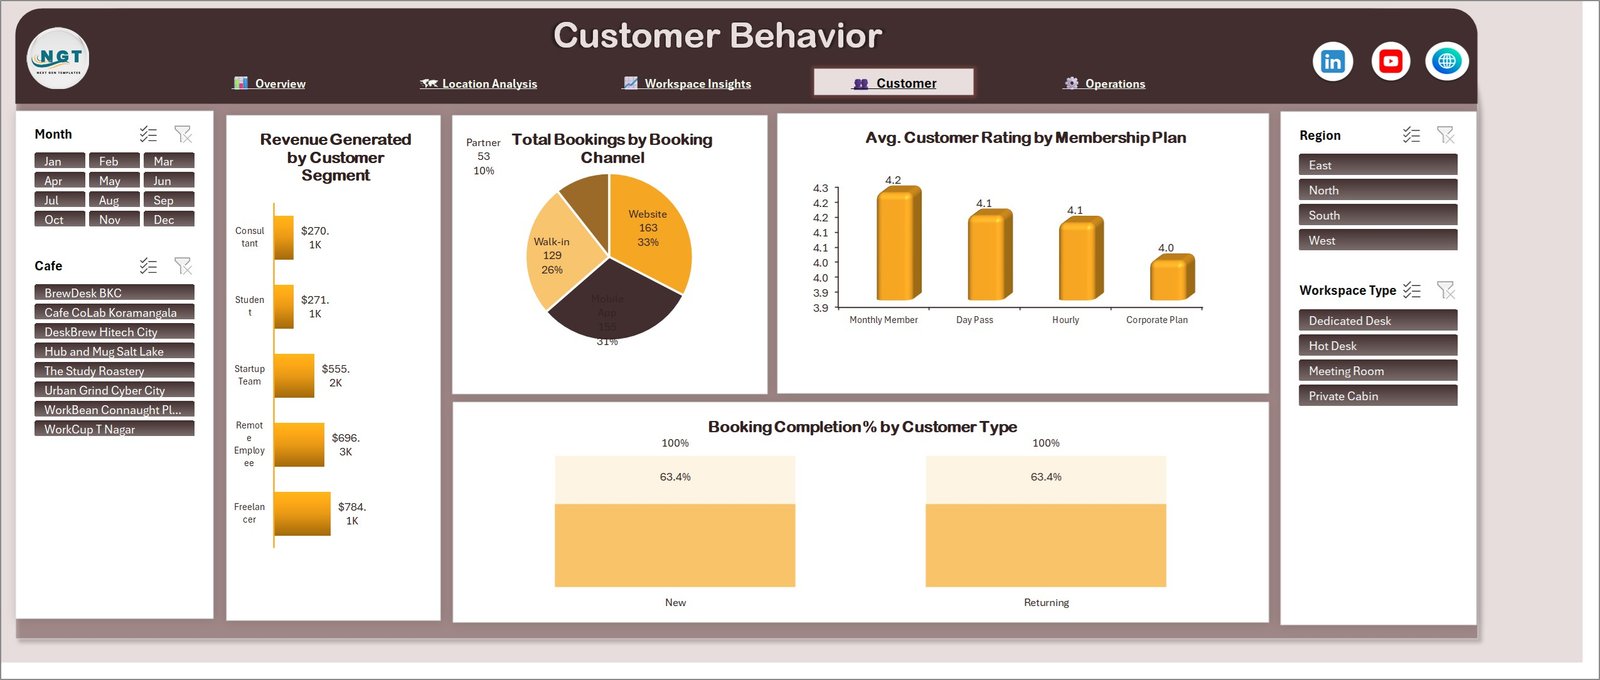
Page 4 – Customer Behavior. Revenue Generated by Customer Segment (Freelancer $784.1K, Remote Employee $696.3K, Startup Team $555.2K, Student $271.1K, Consultant $270.1K), Total Bookings by Booking Channel (Website 163, Mobile App 155, Walk-in 129, Partner 53), Avg. Customer Rating by Membership Plan and Booking Completion % by Customer Type for new against returning guests.
Page 5 – Operations. Workspace Utilization % by Month (a March peak of 66.9% against an October low of 54.1%), Total Seats Booked by Booking Status (Completed 807 seats or 66%, Confirmed 211, Cancelled 130, No Show 70), Total Operating Cost by Cafe from BrewDesk BKC at $97.7K down to Cafe CoLab Koramangala at $73.7K, and Occupied Seat Hours by Quarter, where Q1 holds 1,196.5 hours and Q2 dips to 994.3.
Behind the five pages sit the data sheet you paste into and the pivot layer that feeds every chart. Nothing is hard-coded to the sample rows. Coworking Cafes Dashboard in Excel
Coworking Cafes Dashboard in Excel vs. Google Sheets vs. Coworking SaaS – Where This Fits
| What matters | This Excel dashboard | Google Sheets build | Coworking SaaS (Nexudus, OfficeRnD, Cobot) |
|---|---|---|---|
| Cost | $17.99 once | Free tool, days of build time | Monthly subscription, billed per member or per site |
| Platform | Excel 2016+, Mac, 365 | Browser only | Vendor cloud |
| Setup time | Under 20 minutes | 2-5 days to build | Weeks of onboarding and data migration |
| Works before you have a booking system | Yes, paste a spreadsheet export | Yes, if you build it | No, it is the booking system |
| Multi-site comparison out of the box | Eight cafes and eight cities, ready | Build it yourself | Usually a higher tier |
| Revenue against operating cost per site | Built in, by city and by cafe | Build it yourself | Finance module, often extra |
| Real-time team collaboration | Via OneDrive or SharePoint | Native | Native |
| Mobile access | Excel mobile, read-only slicers | Full | Full |
| Customisable fields | Add columns and the pivots follow | Yes, you build them | Change requests to the vendor |
| You own the file | Yes, unlocked and offline | Yes | No, data lives in the vendor account |
Who This Template Is For – and Who It’s Not For
It fits owners running several cafes that sell desk time, cafe managers who need to know whether meeting rooms or hot desks pay the rent, operations leads comparing utilisation across cities, and anyone reporting cafe-workspace performance to an investor or a landlord each month.
It does not fit anyone who needs a live booking engine – this reads a data export, it does not take reservations or payments. It is not a point-of-sale system for food and drink, and it is not an accounting ledger. If you run a single cafe with a handful of bookings a week, a plain sheet will serve you better than five report pages. Coworking Cafes Dashboard in Excel
How to Use the Coworking Cafes Dashboard in Excel
- Download the ZIP, extract it and open the workbook in Excel. Enable editing when prompted.
- Open the data sheet and replace the sample rows with your own bookings – cafe, city, region, workspace type, membership plan, customer segment, booking channel, seats, hours, revenue, operating cost, rating and status. Keep the column headers as they are.
- Press Ctrl + Alt + F5 to refresh all pivots. Every card, chart and slicer picks up the new rows.
- Use the Month, Cafe, Region and Workspace Type slicers to filter. They are connected across all five pages, so one click re-scopes the whole report.
- Rename cafes, cities, membership plans and visit purposes in the data sheet – the slicer buttons and chart axes rebuild themselves from your values.
- Use the coloured navigation strip at the top of each page to move between Overview, Location Analysis, Workspace Insights, Customer Behavior and Operations.
- Print or export any page to PDF for a monthly owners’ pack.
Real-World Use Cases
Ritu, who owns four cafe-workspaces. She opens the Overview page each Monday, sees completion sitting at 63.4% and drills into Booking Completion % by Cafe. DeskBrew Hitech City converts 72.1% of its bookings while WorkBean Connaught Place manages 53.8% – which is what started the deposit-on-booking trial at the Delhi site.
Arjun, operations lead across eight cities. He lives on the Operations page. Utilisation dipped to 54.1% in October while occupied seat hours held near 1,100, so he moved two staff shifts rather than cutting opening hours.
Sneha, who reports to the investors. She filters to a quarter and exports Location Analysis. Gurugram brings $423.8K of revenue on $97.3K of cost; Bengaluru brings $233.1K on $73.7K. The gap between those two ratios is the whole conversation about where the next site goes.
Frequently Asked Questions
Does this need macros or any add-in?
No. It is a plain .xlsx workbook with formulas, pivot tables and slicers. Nothing to enable, nothing to install, and it passes corporate macro blocks.
Which Excel versions does it work in?
Excel 2016, 2019, 2021 and Microsoft 365 on Windows and Mac. Slicers need a desktop version – Excel Online will display the charts, but slicer clicks are limited.
Is this the same as your coworking KPI dashboards?
No. This is the analytical dashboard – five wide pages driven by slicers, built for exploring a portfolio. The KPI line is a different template with a month picker, target-versus-actual traffic lights and a dedicated trend page. It is also a different template from the Coworking Space Dashboard, which covers a conventional coworking office rather than cafes that sell desk time.
Can I add my own cafes, cities and membership plans?
Yes. Type them into the data sheet and refresh. The slicer buttons and every chart axis rebuild from your values, so you are not stuck with the eight sample cafes.
Does it connect to my booking system or POS?
Not directly. Export a booking report from whatever you use, paste it into the data sheet and refresh. There is no API connection, which is also why it works before you have a booking platform at all.
Can I change the currency?
Yes. The sample is formatted in dollars. Select the value columns on the data sheet and the pivot layer, apply your own currency format, and the cards and charts follow.
How many rows can I paste in?
The sample carries 500 bookings across a full year. Pivot tables handle far more; tens of thousands of rows refresh in a couple of seconds on ordinary hardware.
Can I rebrand it for my business?
Yes. The workbook is unlocked. Swap the logo, change the colour palette and edit the page titles.
Do I get updates?
Yes. Re-download from your account whenever the file is revised. There is no subscription. Coworking Cafes Dashboard in Excel
About the Author
Built by PK – Microsoft Certified Professional with 15+ years of Excel, Google Sheets, and Power BI experience. Founder of NextGenTemplates, reaching 300K+ subscribers across YouTube channels. Every template is hand-built and tested before release.
Explore Related Templates
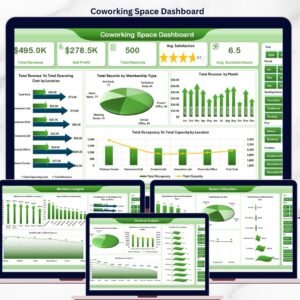
- Coworking Space Dashboard in Excel – the same analytical layout for a conventional coworking office.
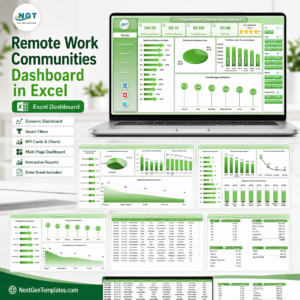
- Remote Work Communities Dashboard in Excel – membership, engagement and community revenue.
- Co-working Space KPI Dashboard in Excel – the month-picker scorecard format with traffic lights.
- Resource Booking Tracker in Excel – a simple desk and room booking log to feed this dashboard.
- Coworking Space Dashboard in Power BI – the same subject for a Power BI team.
- Browse the full Excel Dashboard category or every MS Excel template.
Get the Coworking Cafes Dashboard in Excel for $17.99 instead of $29.99. Instant download, unlocked file, lifetime updates, and a refund if it does not open on your setup. Read the full walkthrough on PK-AnExcelExpert.com.
Last updated: 23 August 2026.






























Reviews
There are no reviews yet.