

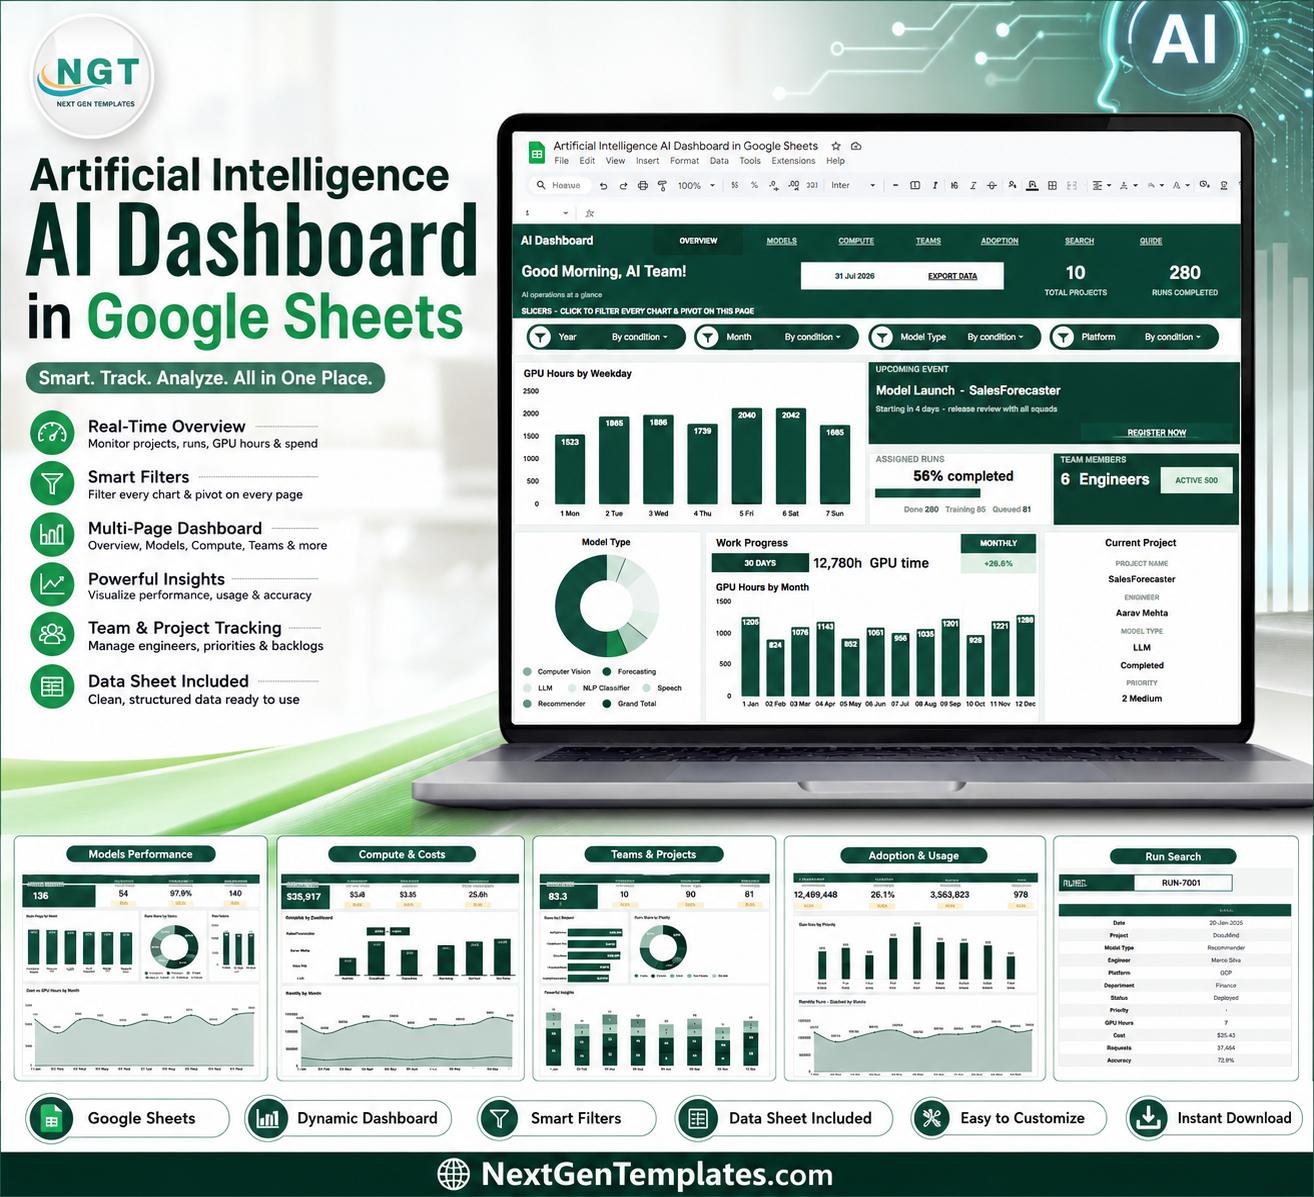
Artificial Intelligence AI Dashboard in Google Sheets gives AI teams one editable workbook for projects, runs, GPU hours, cost, requests, accuracy, and adoption. Stanford HAI’s 2026 AI Index reported that U.S. private AI investment reached $285.9 billion in 2025, so AI work now needs clear operating controls. NextGenTemplates supports 8,400+ teams in 40+ countries with one-time-purchase templates. You get sample data, slicers, charts, and editable fields with no subscription, no per-user fee, and a structure you can review before replacing the sample records.Artificial Intelligence AI Dashboard in Google Sheets
Key Features of Artificial Intelligence AI Dashboard in Google Sheets
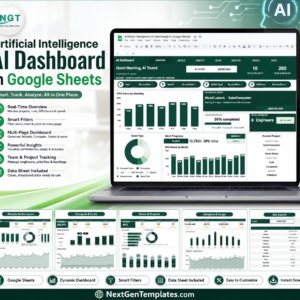
- Seven useful sheet tabs – Overview, Model Performance, Compute and Costs, Teams and Projects, Adoption and Usage, Search, and Data.
- High-level KPI cards – track Total Projects, Runs Completed, Assigned Runs, Team Members, Work Progress, GPU Time, Monthly, and Current Project.
- Slicer-driven analysis – filter the dashboard quickly by project, model type, engineer, platform, department, status, priority, and month.
- Model and compute tracking – compare accuracy, requests, GPU hours, platform usage, monthly spend, and project cost.
- Team workload visibility – review runs by engineer, priority, project, status, and month so delivery risk is easier to spot.
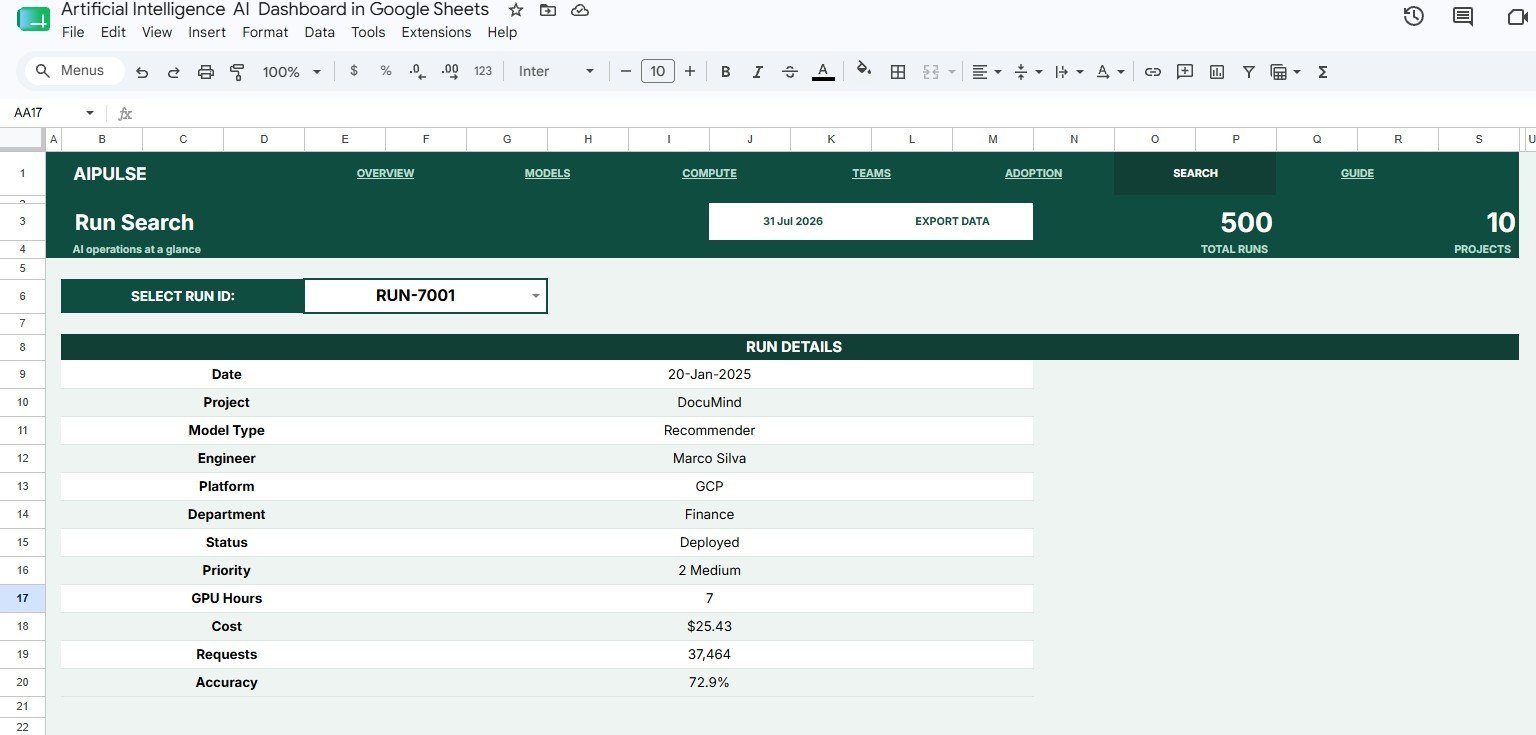
- Search sheet – select a Run ID and instantly view its full record without scrolling through the Data sheet.
- Editable Google Sheets format – share with your team, adjust fields, and update sample records in the same file.
What’s Inside the Artificial Intelligence AI Dashboard in Google Sheets
Overview Page
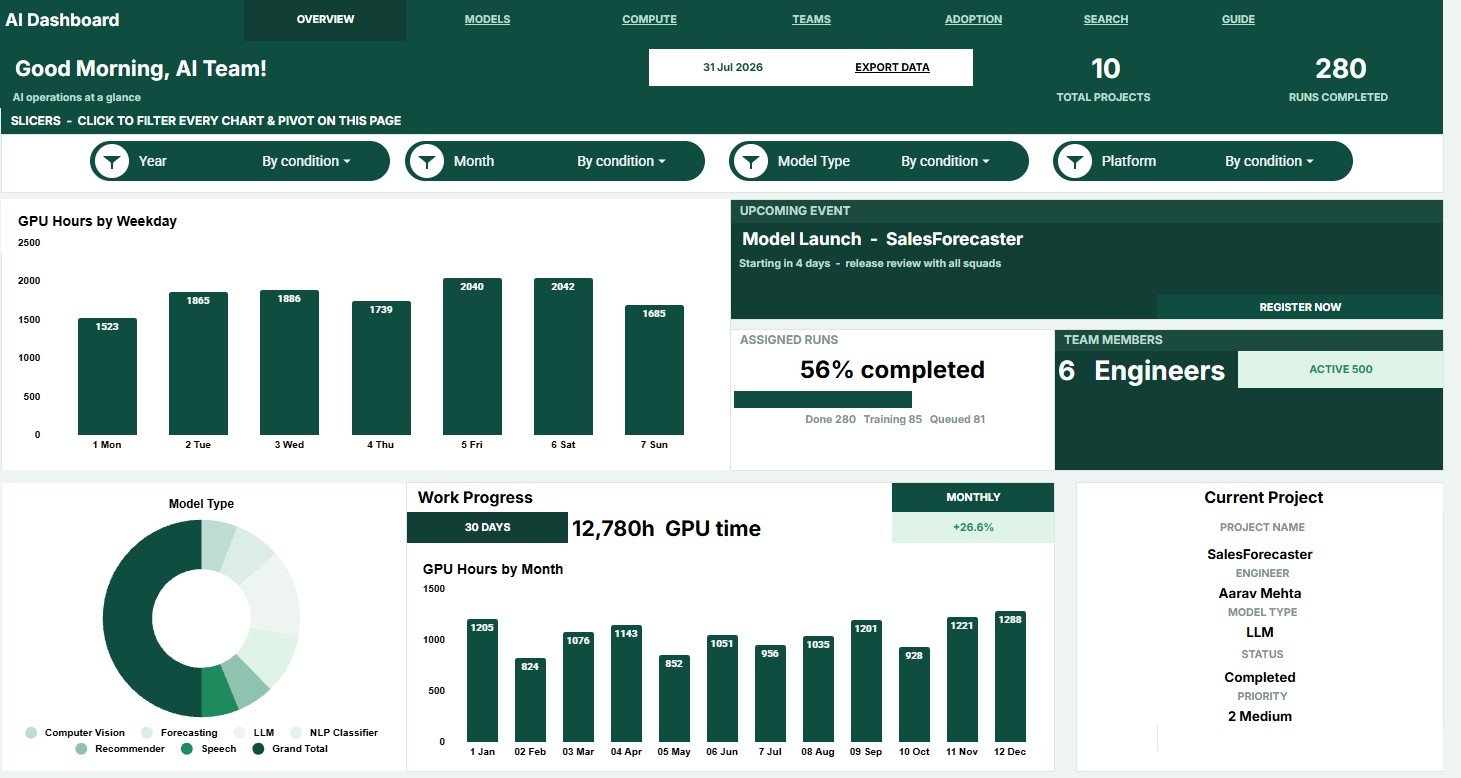
The Overview page summarizes active AI work through cards for Total Projects, Runs Completed, Assigned Runs, Team Members, Work Progress, GPU Time, Monthly, and Current Project.
GPU Hours by Weekday shows which days consume the most compute. Use it to plan heavy model runs around team capacity and infrastructure limits.
Assigned Runs by Status separates completed, assigned, pending, and in-progress work. It helps managers see whether delivery is moving or waiting on blockers.
Projects by Model Type compares the model families used across projects. This is useful when balancing LLM, vision, forecasting, and other model workloads.
GPU Hours by Month tracks compute consumption over time. A rising month can point to heavier experiments, inefficient runs, or growing demand.
Current Project Details by Project keeps the selected project visible with its core run details. It gives project owners a focused view after applying slicers.
Artificial Intelligence AI Dashboard in Google Sheets
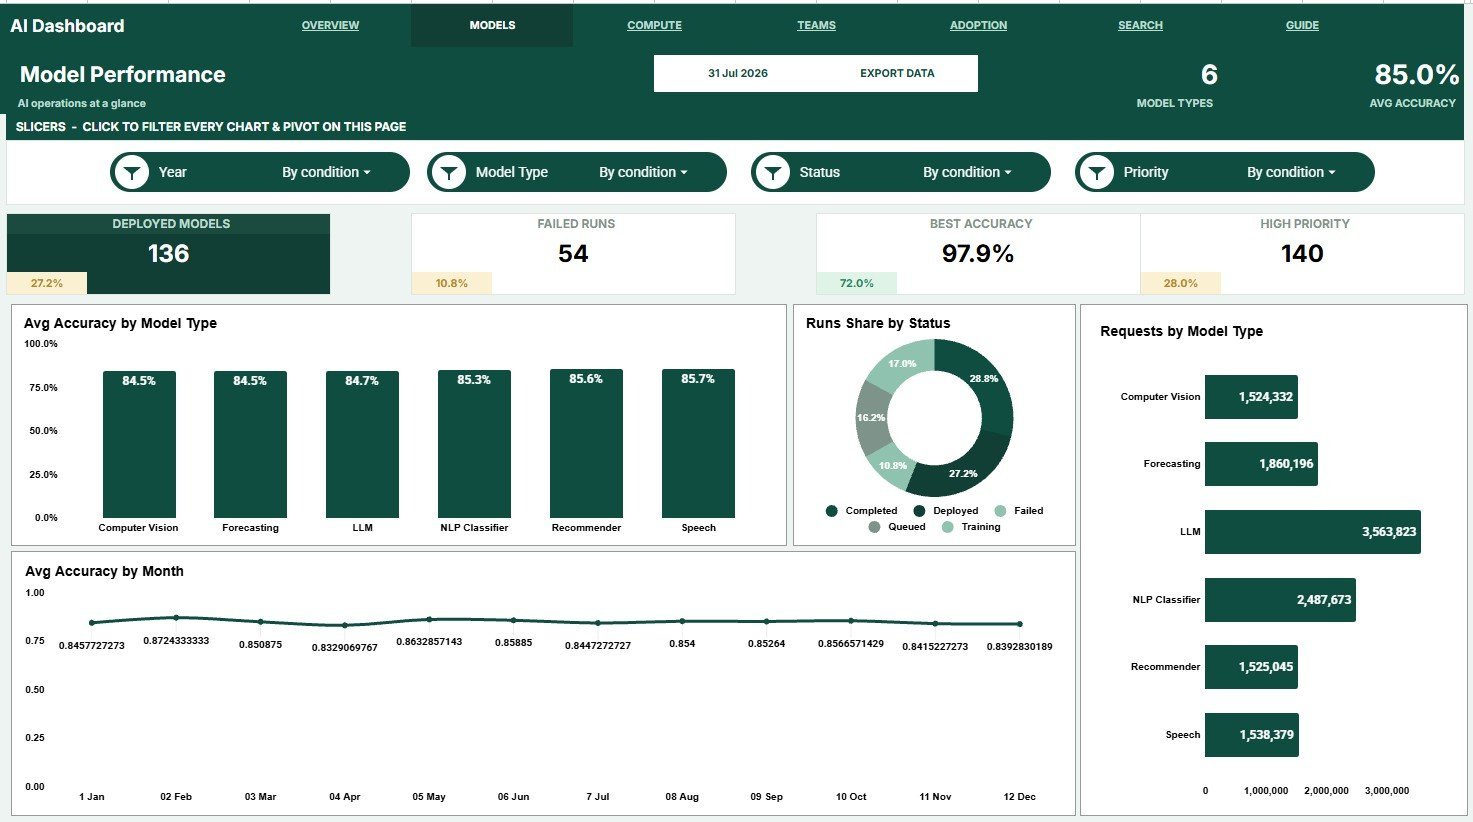
Model Performance
Avg Accuracy by Model Type compares model quality across model groups. It helps identify which model types are producing stronger outcomes.
Runs Share by Status shows the distribution of run outcomes. It gives a quick read on completion rate, backlog, and blocked work.
Requests by Model Type highlights usage volume by model group. It helps teams understand which models are driving the most demand.
Avg Accuracy by Month tracks accuracy movement across time. Use it to see whether model quality is improving after changes and retraining.
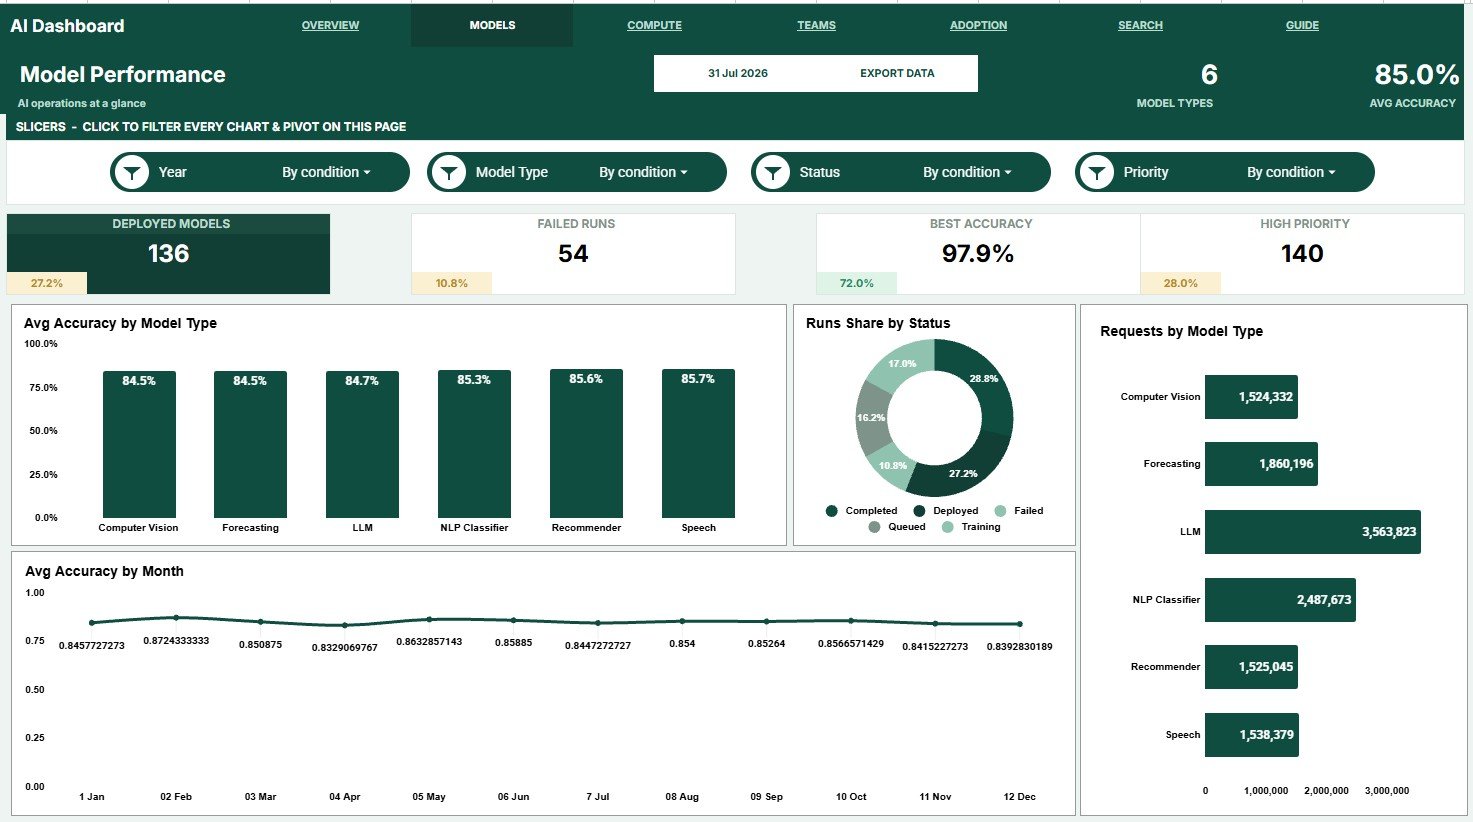
Model Performance
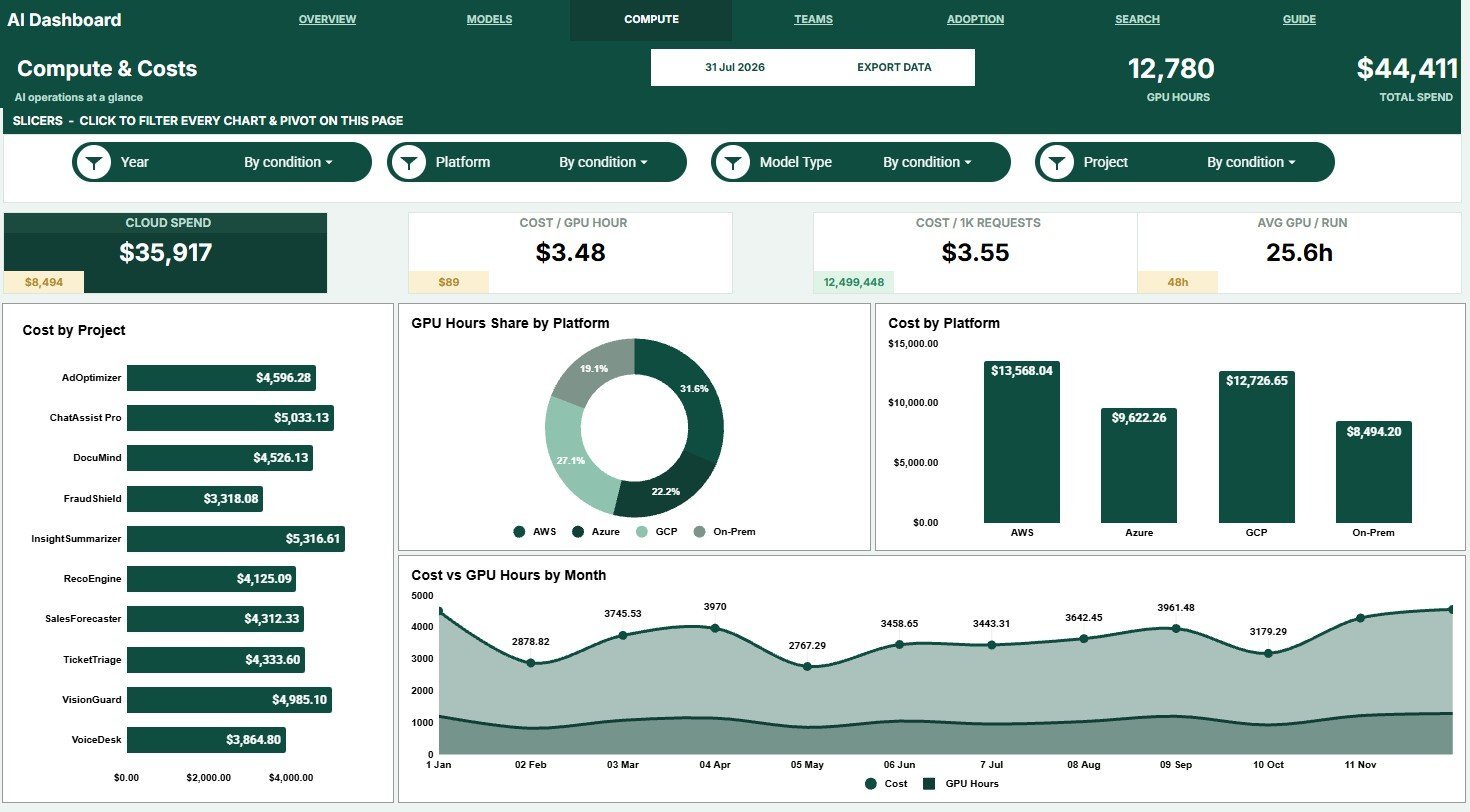
Compute and Costs
Cost by Project identifies which projects are using the most budget. It is useful for cost review, chargeback, and prioritization meetings.
GPU Hours Share by Platform compares compute usage across platforms. It shows whether one provider or environment is carrying most of the load.
Cost by Platform shows how spend is split by platform. This helps teams evaluate vendor mix and spot expensive execution paths.
Cost and GPU Hours by Month connects financial spend with compute usage. It makes it easier to see whether rising cost is tied to actual workload growth.
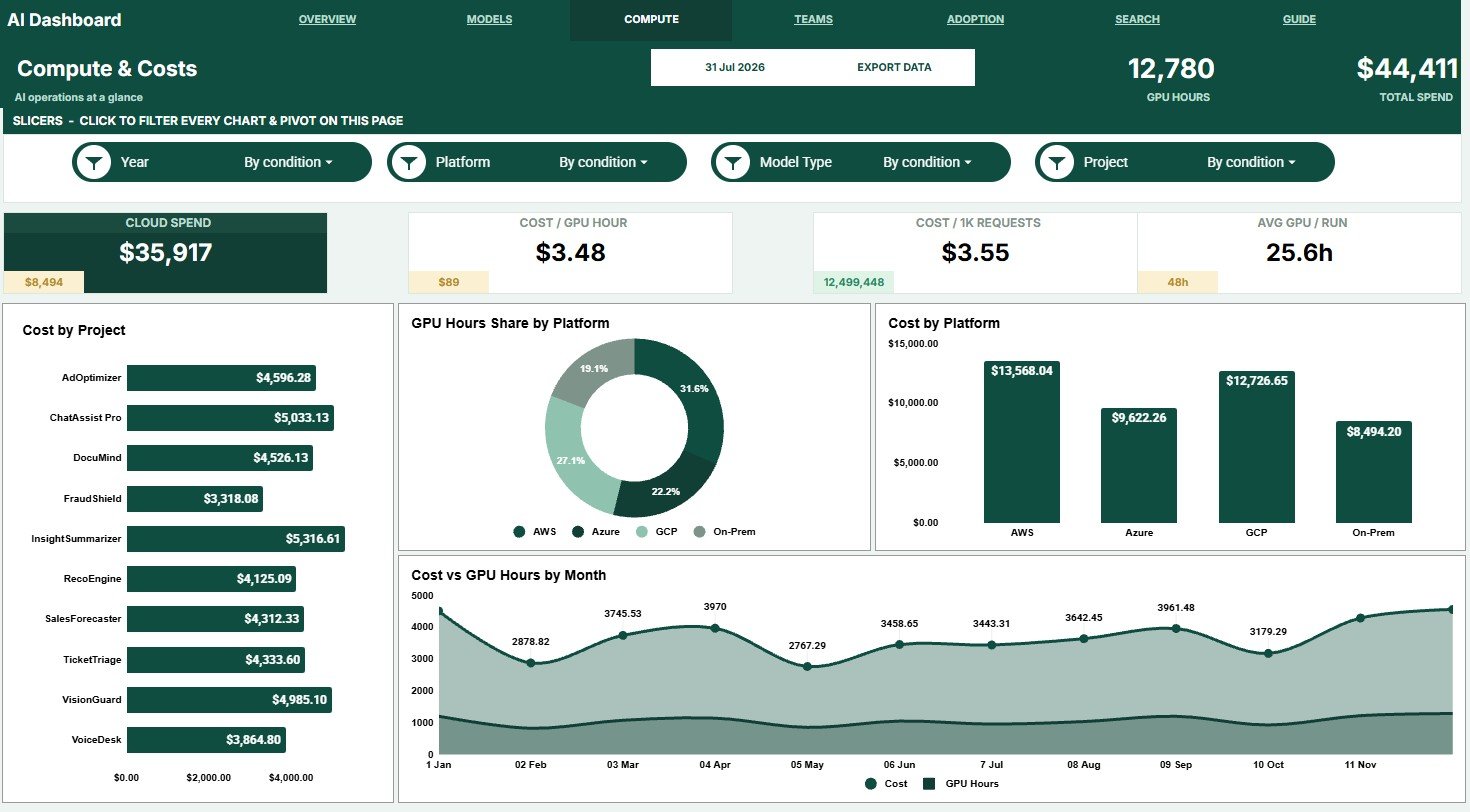
Compute and Costs
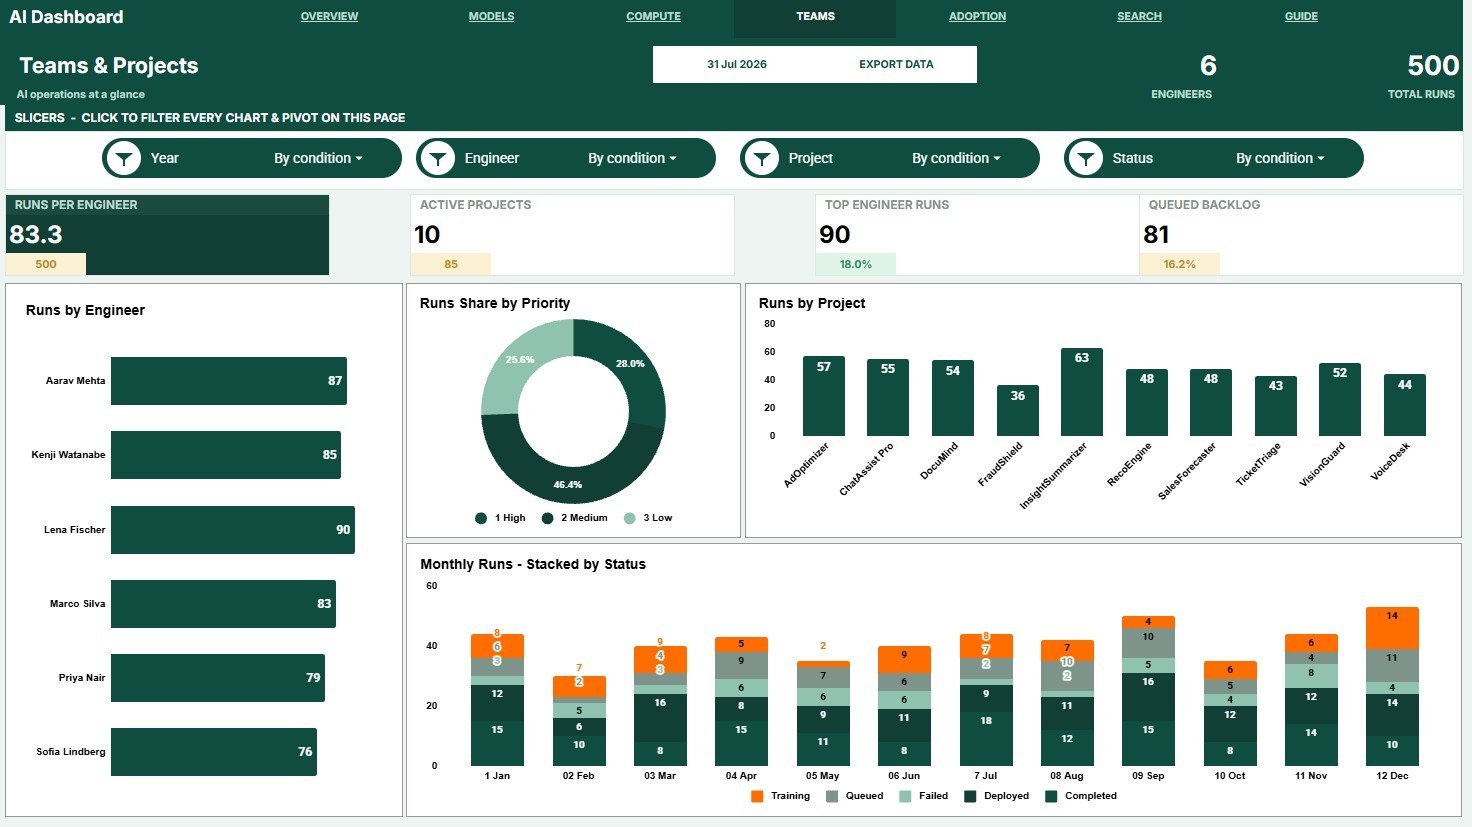
Teams and Projects
Runs by Engineer shows workload by team member. It helps managers spot uneven assignments and review delivery ownership.
Runs Share by Priority breaks work into priority levels. It helps teams see whether urgent AI work is crowding out planned runs.
Runs by Project compares project activity. It shows which initiatives are getting the most execution attention.
Monthly Runs by Status tracks status movement month by month. It helps identify whether delays are improving or building up.
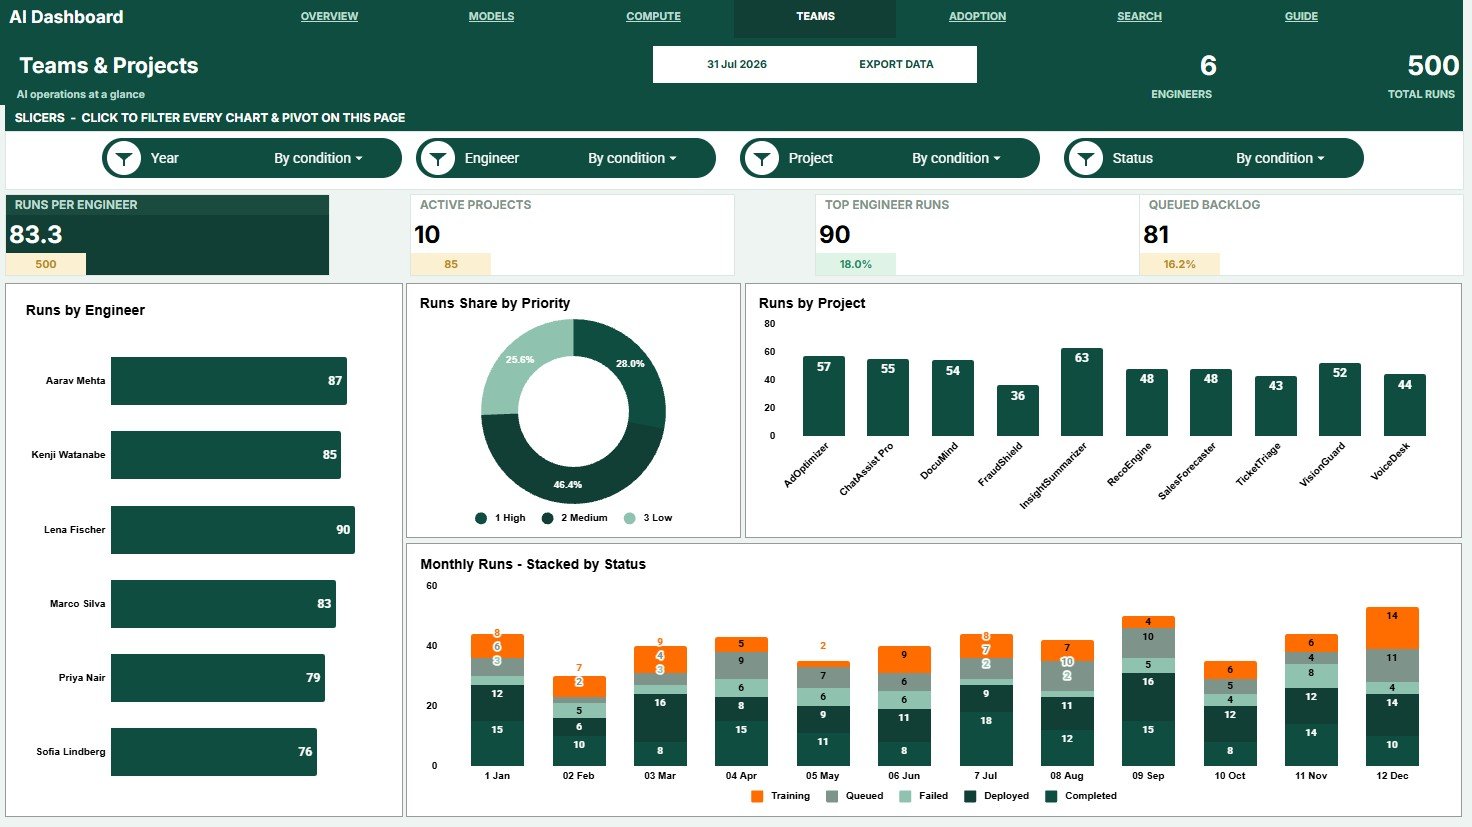
Teams and Projects
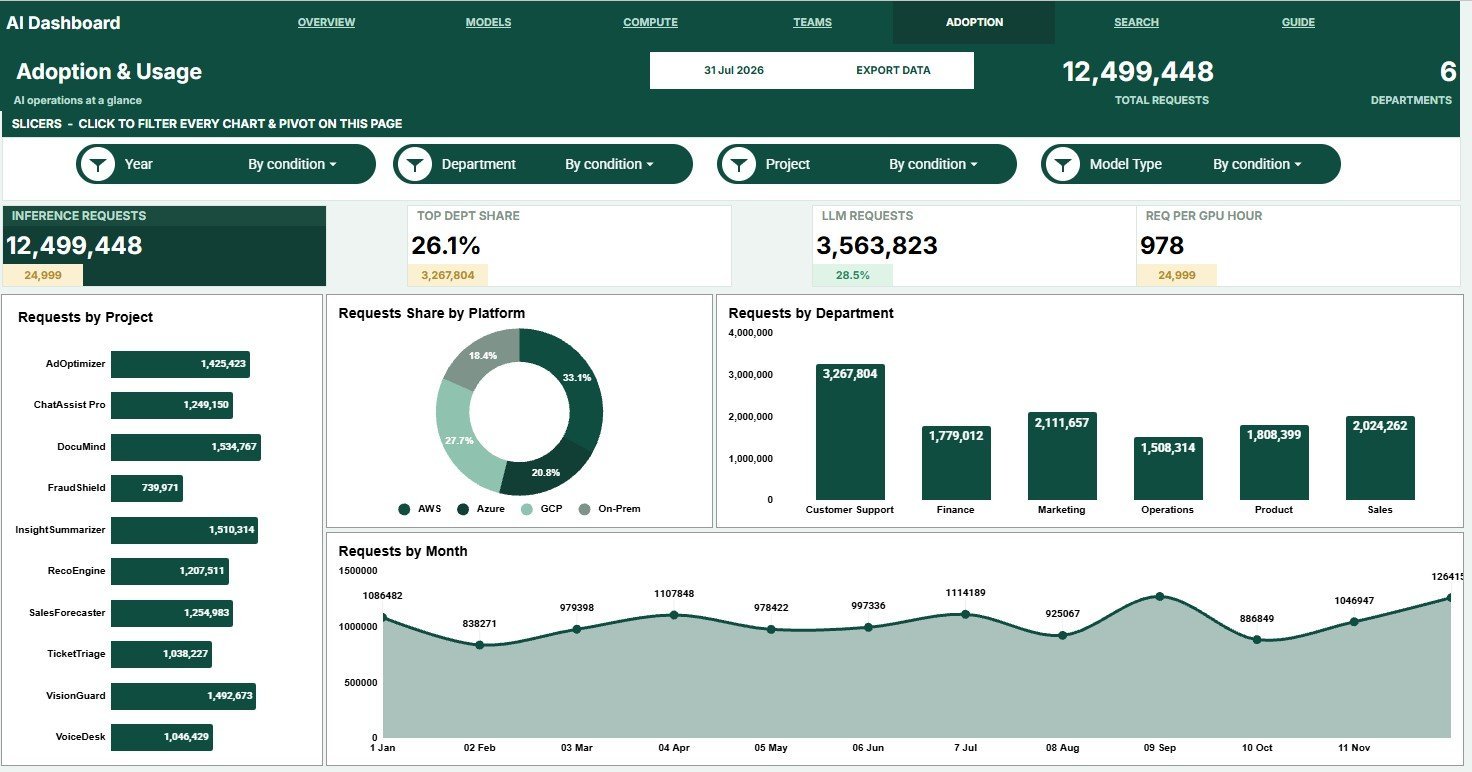
Adoption and Usage
Requests by Project shows demand across AI initiatives. It helps prioritize projects that are receiving the most internal or customer usage.
Requests Share by Platform compares platform adoption. It helps evaluate where teams are actually running AI work.
Requests by Department shows which business groups use AI most. It supports adoption reviews and department-level reporting.
Requests by Month tracks usage growth over time. It helps teams connect adoption trends with cost and compute planning.
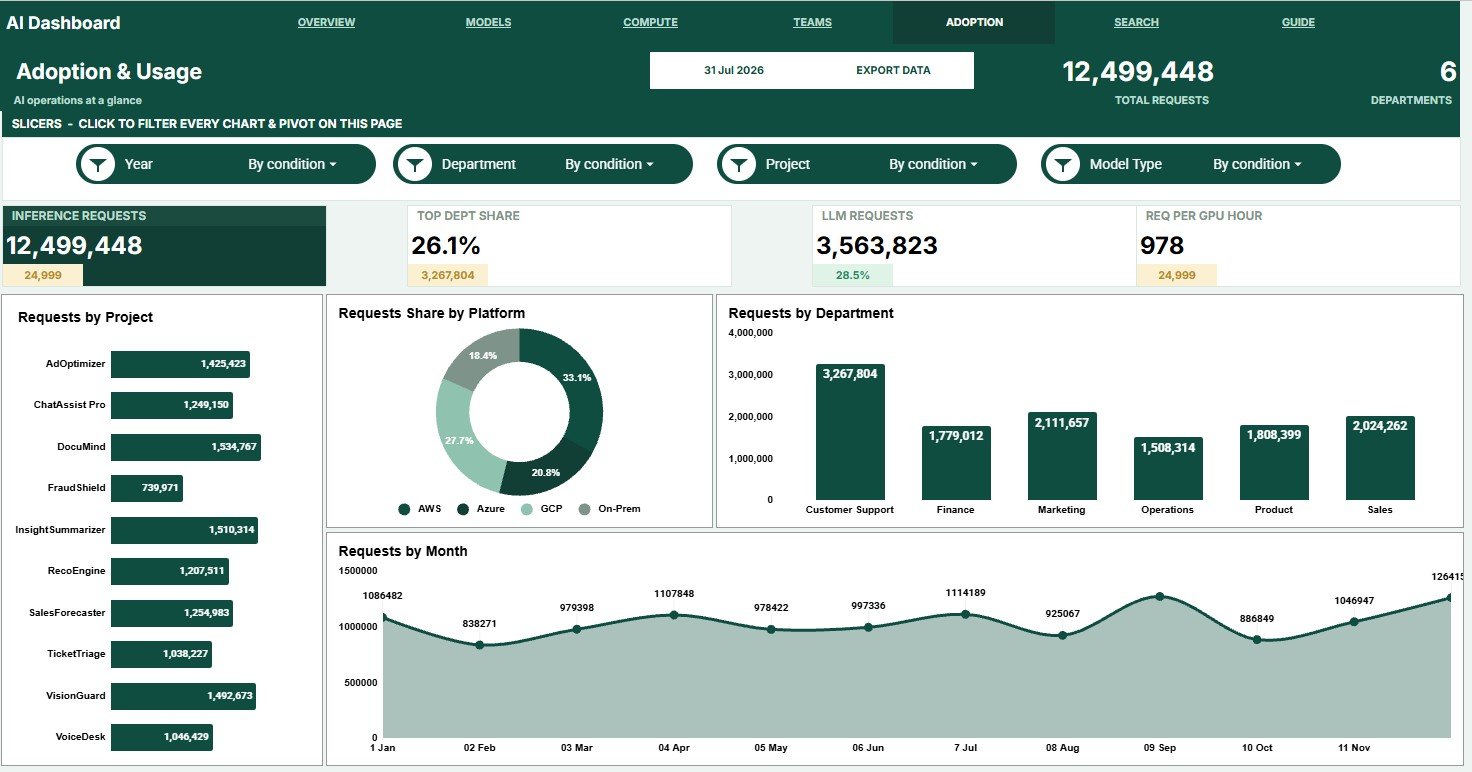
Adoption and Usage
Search Sheet Tab
The Search sheet lets users select a Run ID and instantly view Date, Project, Model Type, Engineer, Platform, Department, Status, Priority, GPU Hours, Cost, Requests, and Accuracy.
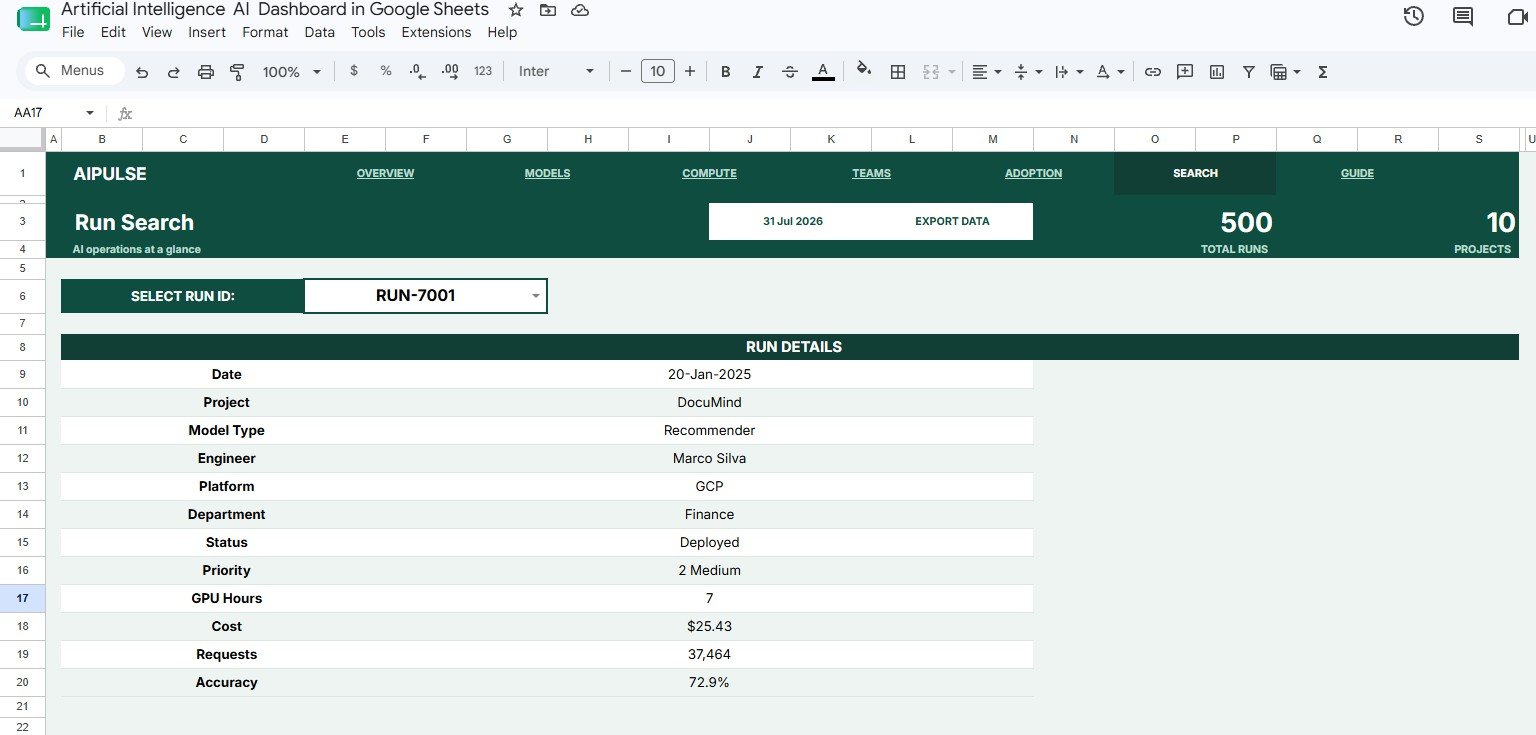
Search Sheet tab
Data Sheet Tab
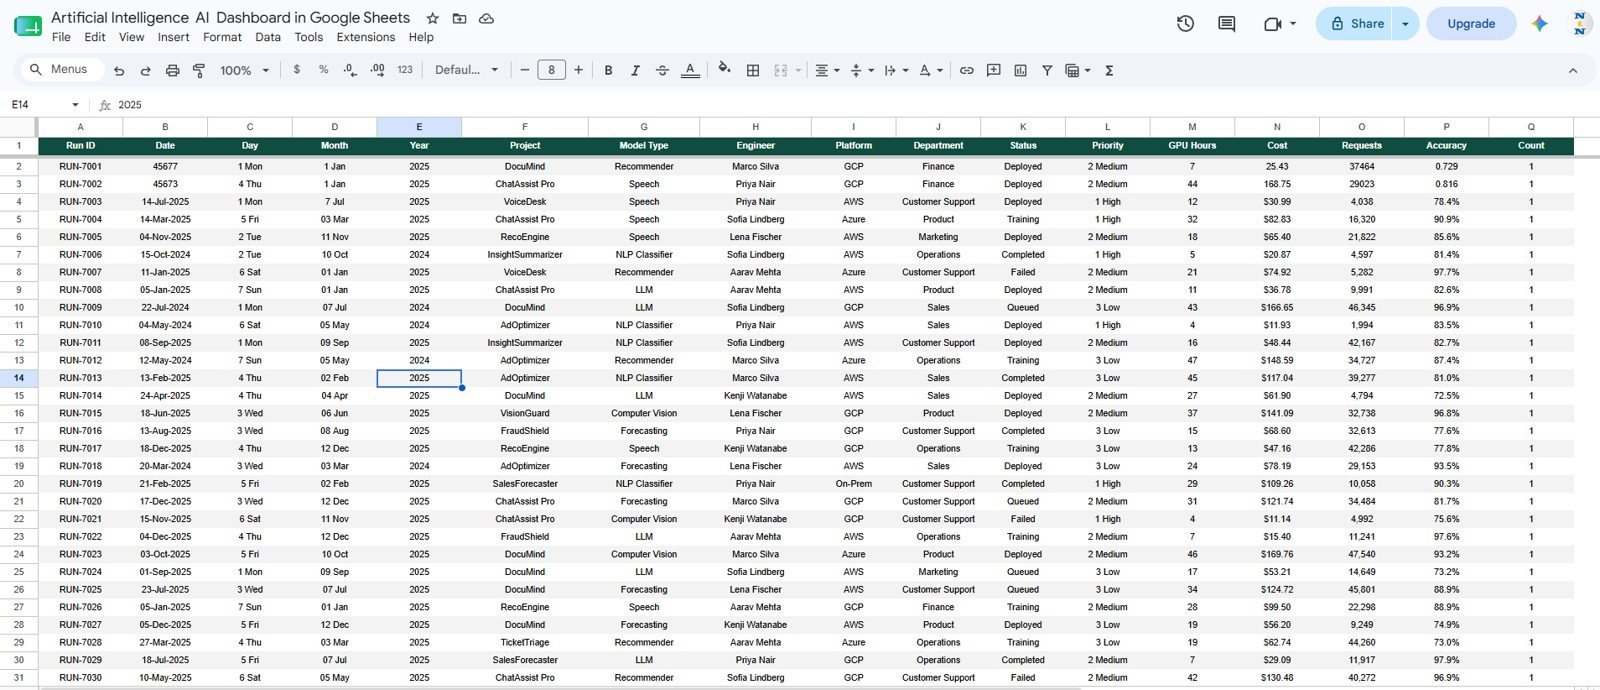
The Data sheet is the source table. Replace the sample rows in the same format, keep the column names consistent, and the dashboard views update from that structured data.
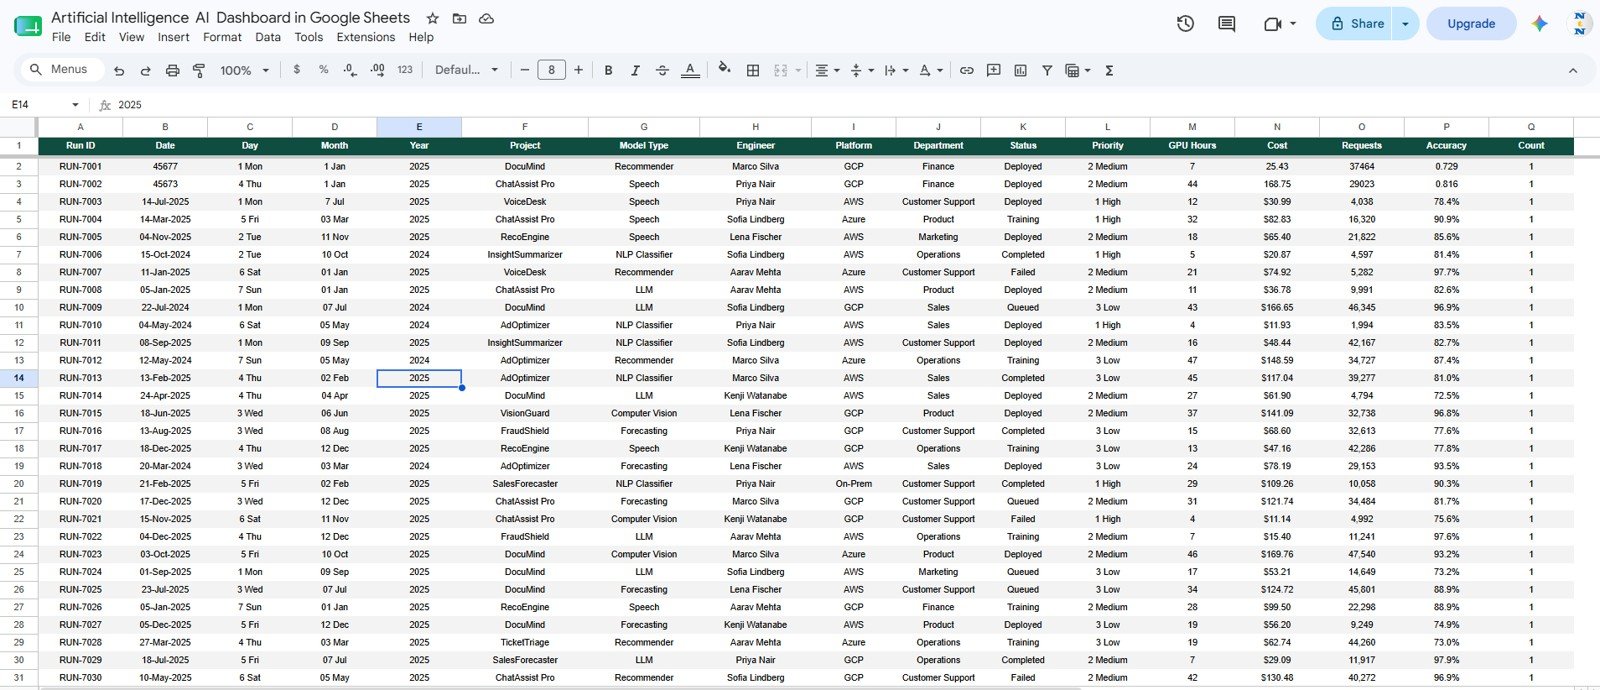
Data Sheet tab
Artificial Intelligence AI Dashboard in Google Sheets vs. Microsoft Excel Dashboard vs. Paid AI/ML SaaS – Where This Fits
| Feature | This Google Sheets template | Microsoft Excel dashboard | Paid AI/ML SaaS |
|---|---|---|---|
| Cost | $9.99 sale price | Low if self-built | Monthly or usage-based fees |
| Platform | Browser-based Google Sheets | Desktop or OneDrive Excel | Vendor-hosted platform |
| Setup time | Start with sample AI run data | Build charts and formulas manually | Requires onboarding and integrations |
| Real-time team collaboration | Native Google sharing | Depends on workbook sharing setup | Usually included by plan |
| Mobile access | Google Sheets app or browser | Excel app or browser | Usually included |
| Customizable fields | Edit columns, slicers, and records | Fully editable if you build it | Plan and admin dependent |
| Share with link | Yes, with Drive permissions | Possible with OneDrive | Account based |
| Year-1 cost at 5 users | $9.99 before workspace costs | Your build time plus software access | Often hundreds or thousands per year |
| AI compute and cost tracking | GPU hours, platform cost, monthly cost | Manual setup needed | Often included but less editable |
| Run search | Built-in Run ID search sheet | Manual lookup setup needed | Usually search-driven |
Who This Template Is For – and Who It’s Not For
This template is for AI project managers, machine learning leads, data science teams, software departments, AI consultants, and operations managers who need a clear view of AI projects without opening a paid platform for every stakeholder.
It is not for teams that need automatic API ingestion, live model telemetry, experiment tracking integrations, access control by role, or enterprise AI governance workflows. In those cases, pair this template with your MLOps or observability system.
How to Use the Artificial Intelligence AI Dashboard in Google Sheets
- Open the Google Sheets copy from your download guide.
- Replace the sample records in the Data sheet with your own AI run data.
- Keep Run ID, Date, Project, Model Type, Engineer, Platform, Department, Status, Priority, GPU Hours, Cost, Requests, and Accuracy in the same format.
- Use the slicers on each dashboard tab to filter by the fields you review most often.
- Open the Search sheet when you need the full detail for one Run ID.
Real-World Use Cases
Priya, AI program manager: reviews GPU Hours by Month and Cost by Project before her weekly portfolio meeting, then uses slicers to isolate the models driving the largest spend.
Marcus, machine learning lead: watches Avg Accuracy by Model Type and Avg Accuracy by Month to compare experiment quality after a model update.
Elena, finance partner: checks Cost by Platform and Cost and GPU Hours by Month before approving the next compute budget.
Frequently Asked Questions
What is the Artificial Intelligence AI Dashboard in Google Sheets?
It is a ready-to-use Google Sheets dashboard for tracking AI projects, model runs, GPU hours, costs, requests, accuracy, adoption, team assignments, and detailed run records.
Can I change the sample data?
Yes. Replace the rows in the Data sheet with your own records while keeping the same column structure. The dashboard views are designed to work from that table.
Does it connect automatically to OpenAI, cloud GPUs, or ML platforms?
No. This is a spreadsheet template, not an API connector. You can paste exported data from your AI tools or add your own Apps Script integration later.
Can multiple people edit it?
Yes. Because it is built in Google Sheets, you can share the file through Google Drive and control who can view, comment, or edit.
Is this only for technical teams?
No. Technical teams can manage run details, while finance, operations, and department leaders can use the dashboard pages to review cost, usage, workload, and adoption.
Is there a subscription?
No. The template is a one-time digital purchase from NextGenTemplates. Any Google Workspace costs are separate from the template purchase.
About the Author
Built by PK – Microsoft Certified Professional with 15+ years of Excel, Google Sheets, and Power BI experience. Founder of NextGenTemplates, reaching 300K+ subscribers across YouTube channels. Every template is hand-built and tested before release.
Explore Related Templates
- Artificial Intelligence Ethics KPI Dashboard in Google Sheets
- Technology Dashboard in Google Sheets
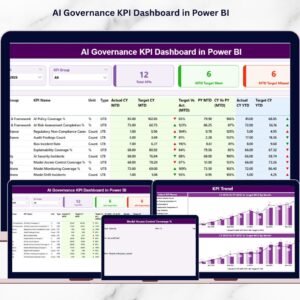
- AI Governance KPI Dashboard in Power BI
- Augmented Analytics Dashboard in Power BI
- Browse Google Sheets Dashboard Templates
- Browse all Google Sheets Templates
Ready to organize AI projects, compute spend, and model performance in one shared spreadsheet? Add the Artificial Intelligence AI Dashboard in Google Sheets to your toolkit and replace the sample records with your own run data.
Watch the step-by-step video Demo:
Last updated: July 2026








Reviews
There are no reviews yet.