

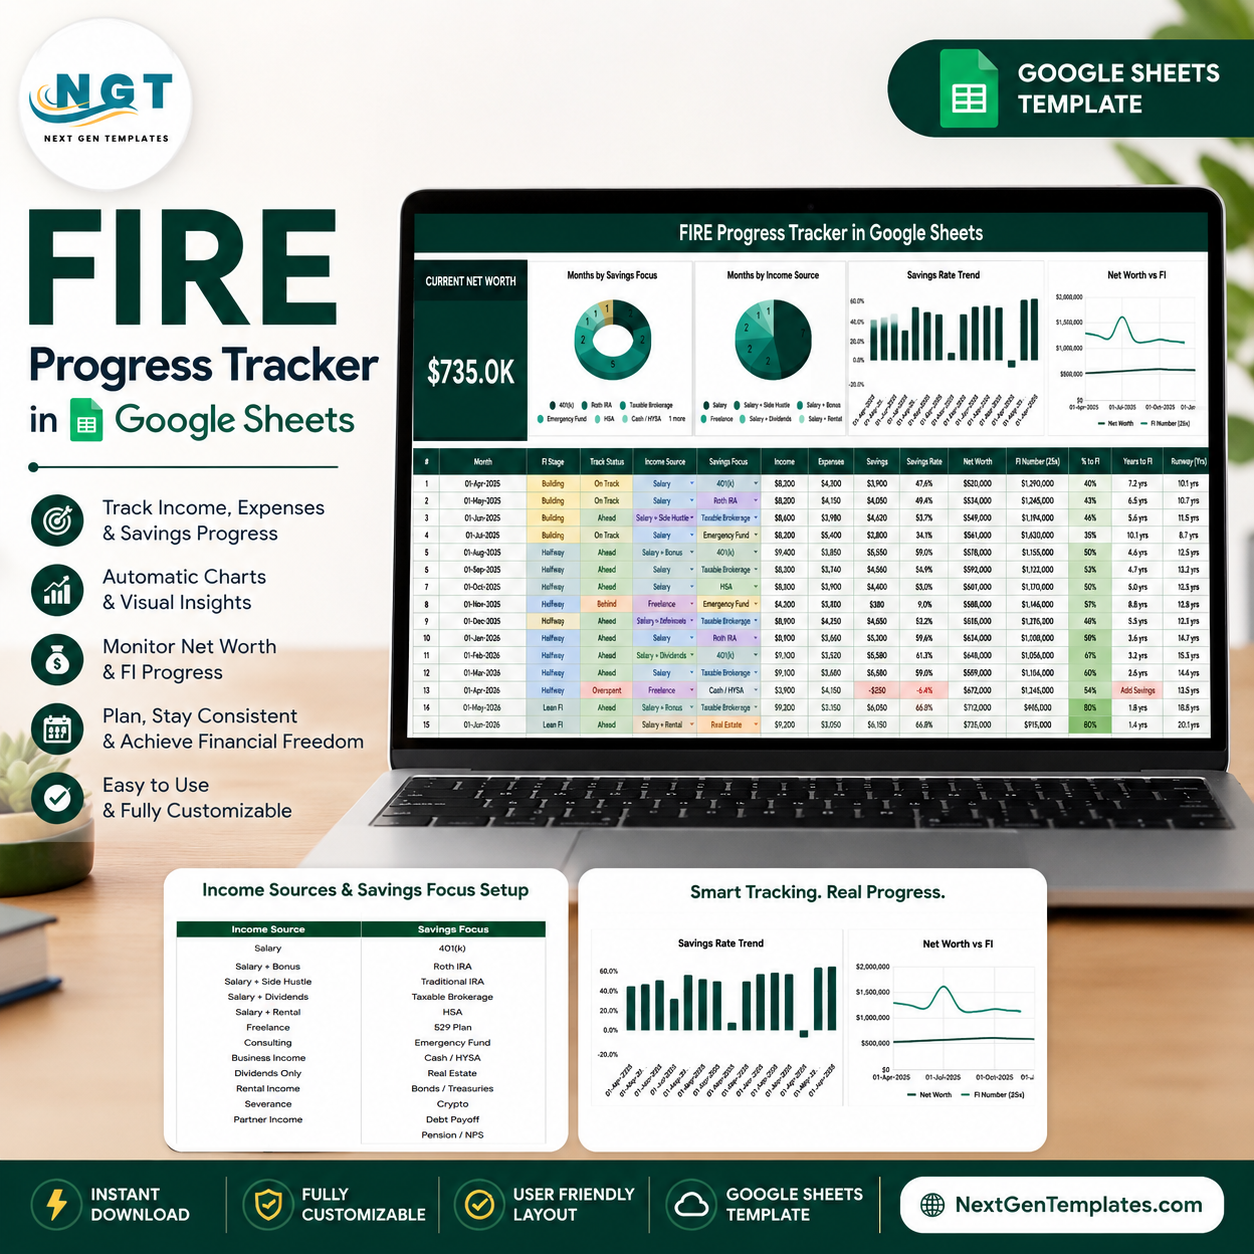

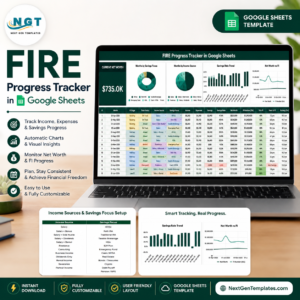
FIRE Progress Tracker in Google Sheets gives personal finance planners a ready-to-use way to monitor 10 FIRE cards, 4 overview charts, and 2 list-analysis blocks in one shared spreadsheet. The tracker uses the common 25x rule for the FI Number, then shows % to FI, Years to FI, Runway (Years), current net worth, income, expenses, savings, savings rate, and monthly net worth in one view. Built by PK, Microsoft Certified Professional with 15+ years of Excel, Google Sheets, and Power BI experience and 300K+ tutorial subscribers, this template is a one-time $6.99 purchase with no recurring finance-app subscription.
Use it to keep your financial independence target visible, review monthly savings behavior, compare income sources, and understand how quickly your net worth is moving toward your FIRE number.
Key Features of FIRE Progress Tracker in Google Sheets
- 10 high-level FIRE cards: Current Net Worth, Income, Expenses, Savings, Savings Rate, Net Worth, FI Number (25x), % to FI, Years to FI, and Runway (Years).
- Overview dashboard page: Review the main FIRE metrics with slicers and charts instead of scanning raw monthly entries.
- Monthly savings focus analysis: See which saving priorities appear most often across the months you track.
- Income source analysis: Compare income source patterns so salary, side income, investing income, or other labels stay visible.
- Savings rate trend: Track whether your savings rate is improving, slipping, or staying flat over time.
- Net worth vs. FI number chart: Compare actual net worth against the target FI Number month by month.
- List option setup: Maintain Income Source and Savings Focus lists for cleaner dropdowns and reporting.
- Google Sheets sharing: Work from your own copy in Google Drive and share with a spouse, partner, coach, or planner.
What’s Inside the FIRE Progress Tracker in Google Sheets
1 – Overview Page
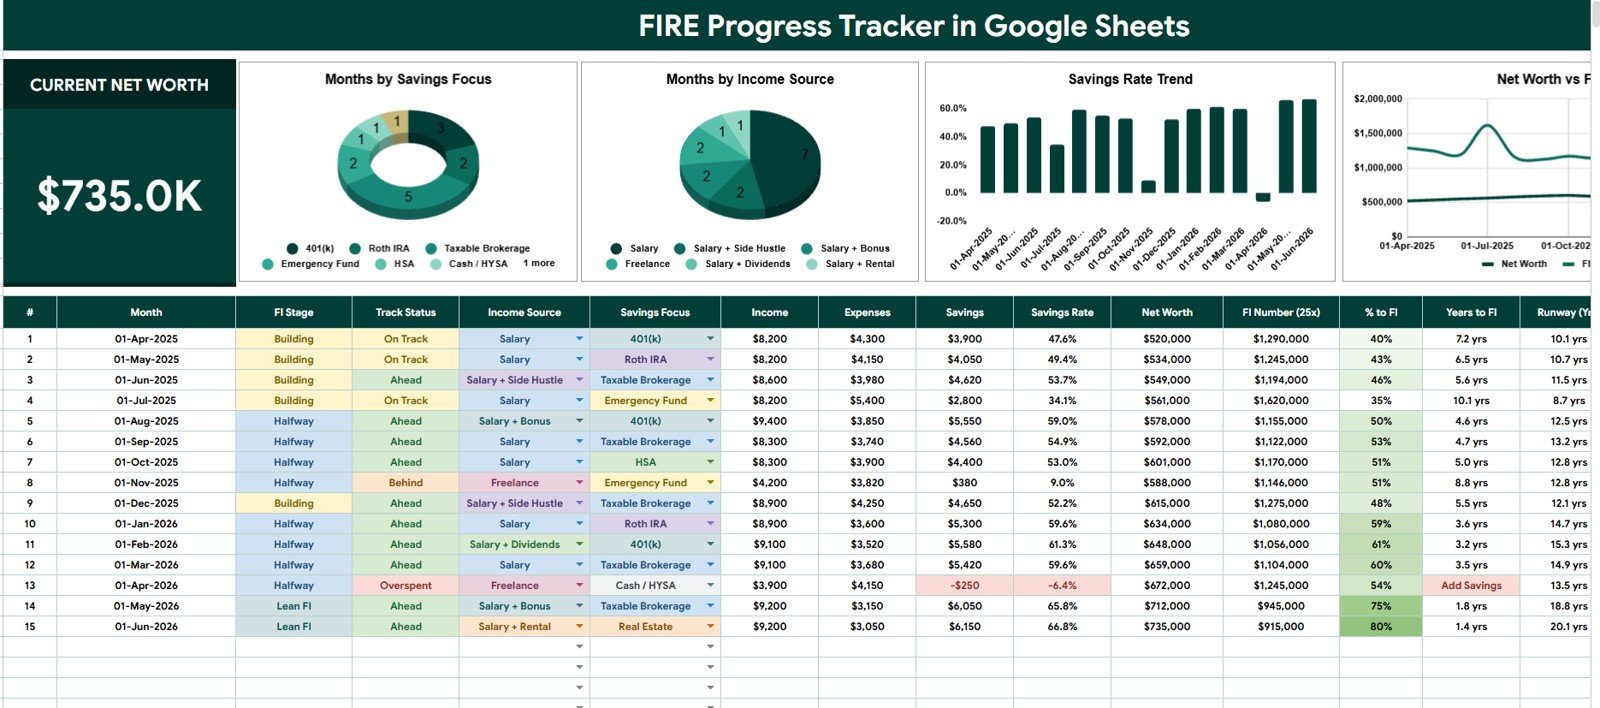
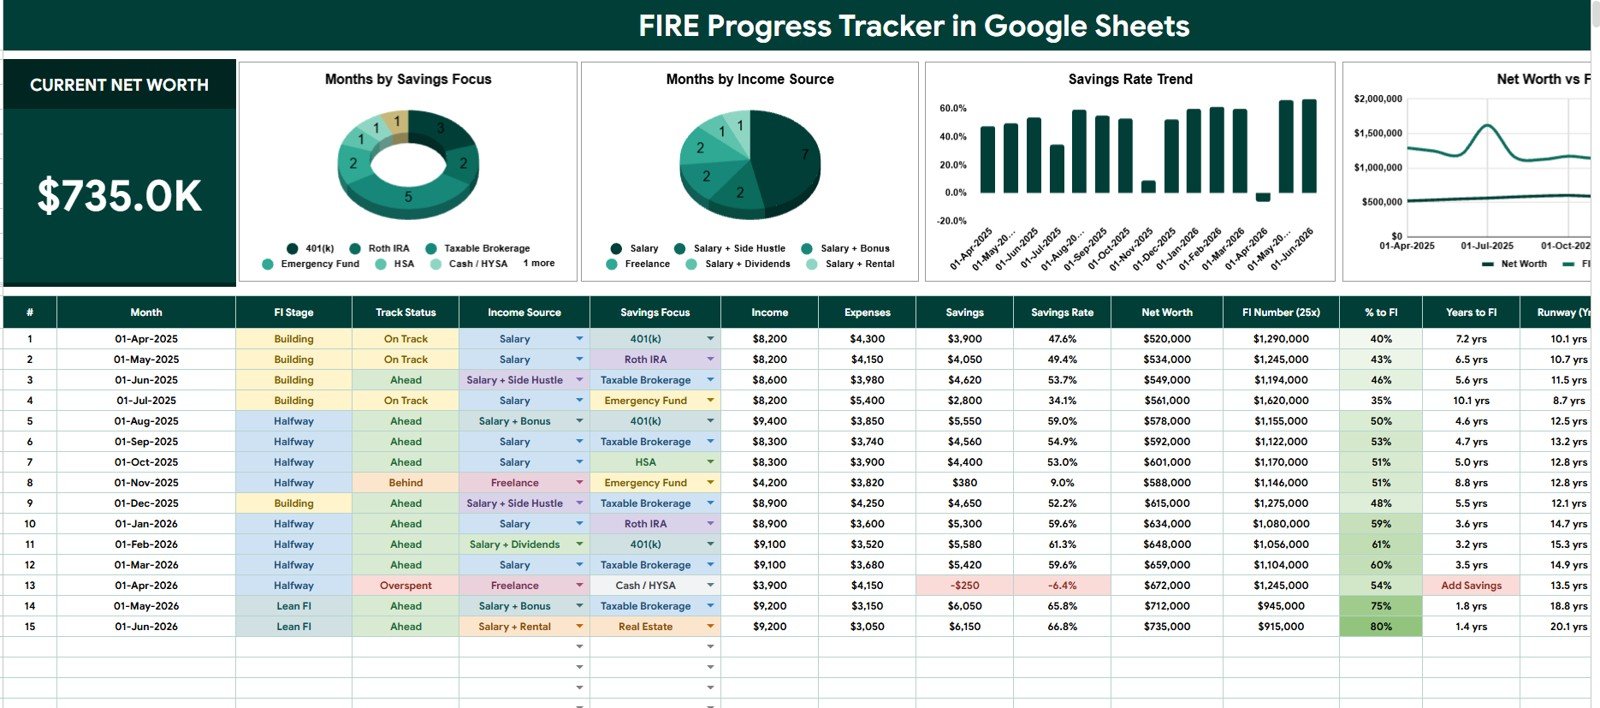
The Overview Page is the main reporting sheet. At the top, the template shows Current Net Worth, Income, Expenses, Savings, Savings Rate, Net Worth, FI Number (25x), % to FI, Years to FI, and Runway (Years), so users can see their financial independence position before looking at the charts.
The page also includes slicers so users can filter the dashboard quickly. This is helpful when you want to isolate a specific income source, savings focus, month, or review period without rebuilding formulas.
Months by Savings Focus: This chart shows how tracked months are grouped by savings focus. It helps you see whether your progress is mostly tied to emergency savings, investing, debt payoff, retirement contributions, or another custom focus area.
If one focus dominates the chart, you can decide whether that pattern is intentional or whether your plan needs better balance across cash, investing, debt, and long-term retirement goals.
Months by Income Source: This chart groups months by the selected income source. It helps users separate regular salary months from side income, business income, dividend income, rental income, or other custom labels.
When income sources change, the chart makes it easier to see whether FIRE progress depends on one stream or whether multiple sources are supporting the plan.
Savings Rate by Month: This chart tracks the savings rate across each month. It is useful for spotting high-saving months, weak months, and repeating seasonal patterns in spending or income.
The trend also gives a quick reality check: if income rises but savings rate does not improve, expenses may be absorbing the gain before it can move net worth forward.
Net Worth and FI Number by Month: This chart compares actual net worth against the calculated FI Number over time. It helps users see whether the distance to financial independence is closing, flat, or widening.
Because the FI Number is tied to expenses, the chart also makes lifestyle inflation visible. If expenses rise, the FI target can move upward even when net worth is growing.
FIRE Progress Tracker in Google Sheets
2 – Income Source and Savings Focus Lists
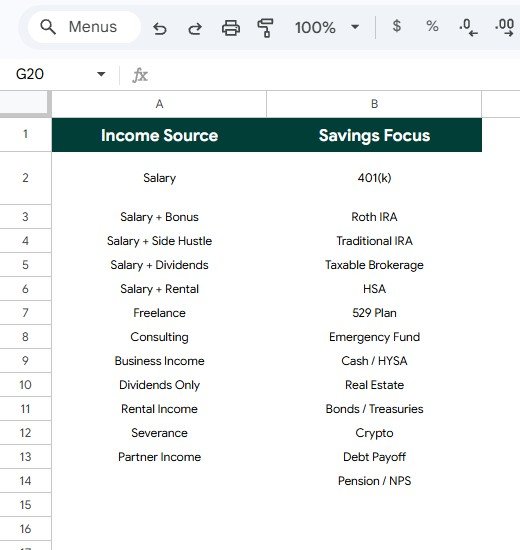
The second sheet tab supports clean dropdowns and consistent reporting. Instead of typing income sources and savings focus values manually each time, users can maintain the list options in one place.
Income Source by List Option: This list analysis helps standardize the income source values used in the tracker. Clean labels make the Months by Income Source chart easier to trust.
Savings Focus by List Option: This section keeps savings focus options consistent. Users can rename or expand the list based on their own FIRE strategy, such as emergency fund, index investing, debt payoff, real estate, retirement account, or cash buffer.
Income Source and Savings Focus Lists
FIRE Progress Tracker in Google Sheets vs. Microsoft Excel Tracker vs. Paid Finance SaaS – Where This Fits
| Feature | This Google Sheets tracker | Microsoft Excel tracker | Paid finance SaaS |
|---|---|---|---|
| Cost | $6.99 one-time sale price | Template cost or internal build time | Usually monthly or annual subscription |
| Platform | Google Sheets in Google Drive | Excel desktop or Excel Online | Vendor-hosted web or mobile app |
| Setup time | Copy the Sheet, update lists, enter monthly data | Download workbook and adjust formulas | Account setup, bank links, rules, and permissions |
| Real-time team collaboration | Native Google sharing | Depends on OneDrive or SharePoint | Usually account based |
| Mobile access | Google Sheets app or browser | Excel app or browser | Usually included |
| Customizable fields | Edit lists, labels, and sheet structure | Editable if workbook is unlocked | Limited by vendor settings |
| Share with link | Yes, with Drive permissions | Yes, with cloud storage | Usually login based |
| Year-1 cost at 5 users | $6.99 before any Google Workspace costs | Template plus Microsoft access | Can become recurring per user or household |
| FI Number and runway view | Included as headline cards | Must be built or customized | Depends on the app |
Who This Template Is For – and Who It’s Not For
This template is for FIRE beginners, personal finance trackers, couples planning financial independence, budget coaches, spreadsheet users, and anyone who wants a simple monthly view of savings rate, net worth, and FI target progress.
It is not for users who need automatic bank imports, investment account synchronization, tax advice, retirement advice, Monte Carlo simulations, or regulated financial planning software. This is a tracking template, not a financial advisor.
How to Use the FIRE Progress Tracker in Google Sheets
- Open the PDF guide from your download and create your own editable Google Sheets copy.
- Review the list sheet and update Income Source and Savings Focus options.
- Enter your monthly net worth, income, expenses, savings, and related labels.
- Review the Overview Page cards to see current net worth, savings rate, FI Number, % to FI, Years to FI, and Runway.
- Use slicers to filter the charts for a specific month, income source, or savings focus.
- Update the tracker each month so the net worth and FI number trend stays useful.
Real-World Use Cases
Ananya, a FIRE beginner, uses the savings rate trend to understand whether her new budgeting habits are actually increasing savings month by month.
Mark and Julia, a couple planning early retirement, review Net Worth and FI Number by Month before monthly money meetings so they can decide whether expenses are pushing the FI target higher.
Dev, a side-income builder, uses Months by Income Source to see whether consulting income is becoming a reliable part of the FIRE plan.
Frequently Asked Questions
What does the FIRE Progress Tracker in Google Sheets track?
It tracks current net worth, income, expenses, savings, savings rate, net worth, FI Number (25x), % to FI, Years to FI, Runway (Years), income source, savings focus, and monthly chart trends.
Can I customize the income source and savings focus lists?
Yes. The list sheet lets you edit the available income source and savings focus options so the tracker matches your own financial life.
Does this template calculate the FI Number?
Yes. The template includes an FI Number (25x) card so users can compare net worth against a common financial independence target.
Can more than one person use the tracker?
Yes. Because it is built in Google Sheets, you can share your copied file with another editor or viewer through Google Drive permissions.
Is this a financial advice product?
No. It is a spreadsheet tracker for organizing and visualizing your own financial data. It does not provide investment, tax, legal, or retirement advice.
Is a digital file included?
The product is prepared as a Google Sheets template with a copy workflow. Add the final downloadable file URL before publishing so buyers receive the correct guide or download package.
About the Author
Built by PK – Microsoft Certified Professional with 15+ years of Excel, Google Sheets, and Power BI experience. Founder of NextGenTemplates, reaching 300K+ subscribers across YouTube channels. Every template is hand-built and tested before release.
Explore Related Templates
- Retirement Savings Tracker in Google Sheets
- Personal Cash Flow Tracker in Google Sheets
- Mutual Fund and SIP Tracker in Google Sheets
- Dividend Income Tracker in Google Sheets
- Stock Portfolio Tracker in Google Sheets
Browse more Google Sheets templates, Google Sheets trackers, and Google Sheets financial tools.
Watch the step-by-step video Demo:
Download the FIRE Progress Tracker in Google Sheets when you want a simple FIRE dashboard for net worth, savings rate, FI Number, runway, and monthly progress review.
Last updated: July 27, 2026.
Compatibility and Requirements
- Works in Google Sheets. You need a free Google account and a web browser.
- Your copy lives in your own Google Drive, and you can share it with a spouse, partner, coach or planner. Google explains how to create charts in Sheets in Add & edit a chart or graph.
More Questions About This Template
Is there a milestone version of this tracker?
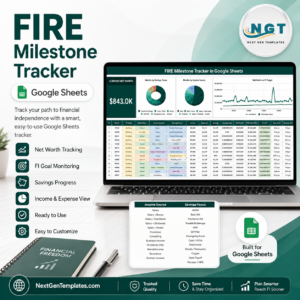
Yes. See the FIRE Milestone Tracker in Google Sheets if you want to follow your progress as a set of milestones.
Does the tracker import data from my bank or investment accounts?
No. You enter your monthly net worth, income, expenses and savings yourself, and the Overview Page cards and charts update from those entries.
Which numbers show how close I am to financial independence?
The Overview Page has FI Number (25x), % to FI, Years to FI and Runway (Years). The Net Worth and FI Number by Month chart shows whether the gap is closing over time.
Can I use my own income source and savings focus labels?
Yes. Edit the Income Source and Savings Focus options on the list sheet. The Months by Income Source and Months by Savings Focus charts use those labels.





Reviews
There are no reviews yet.