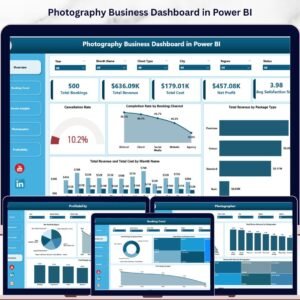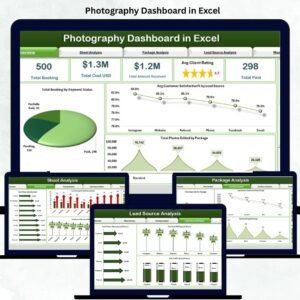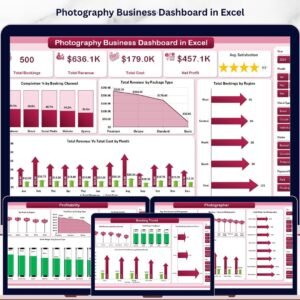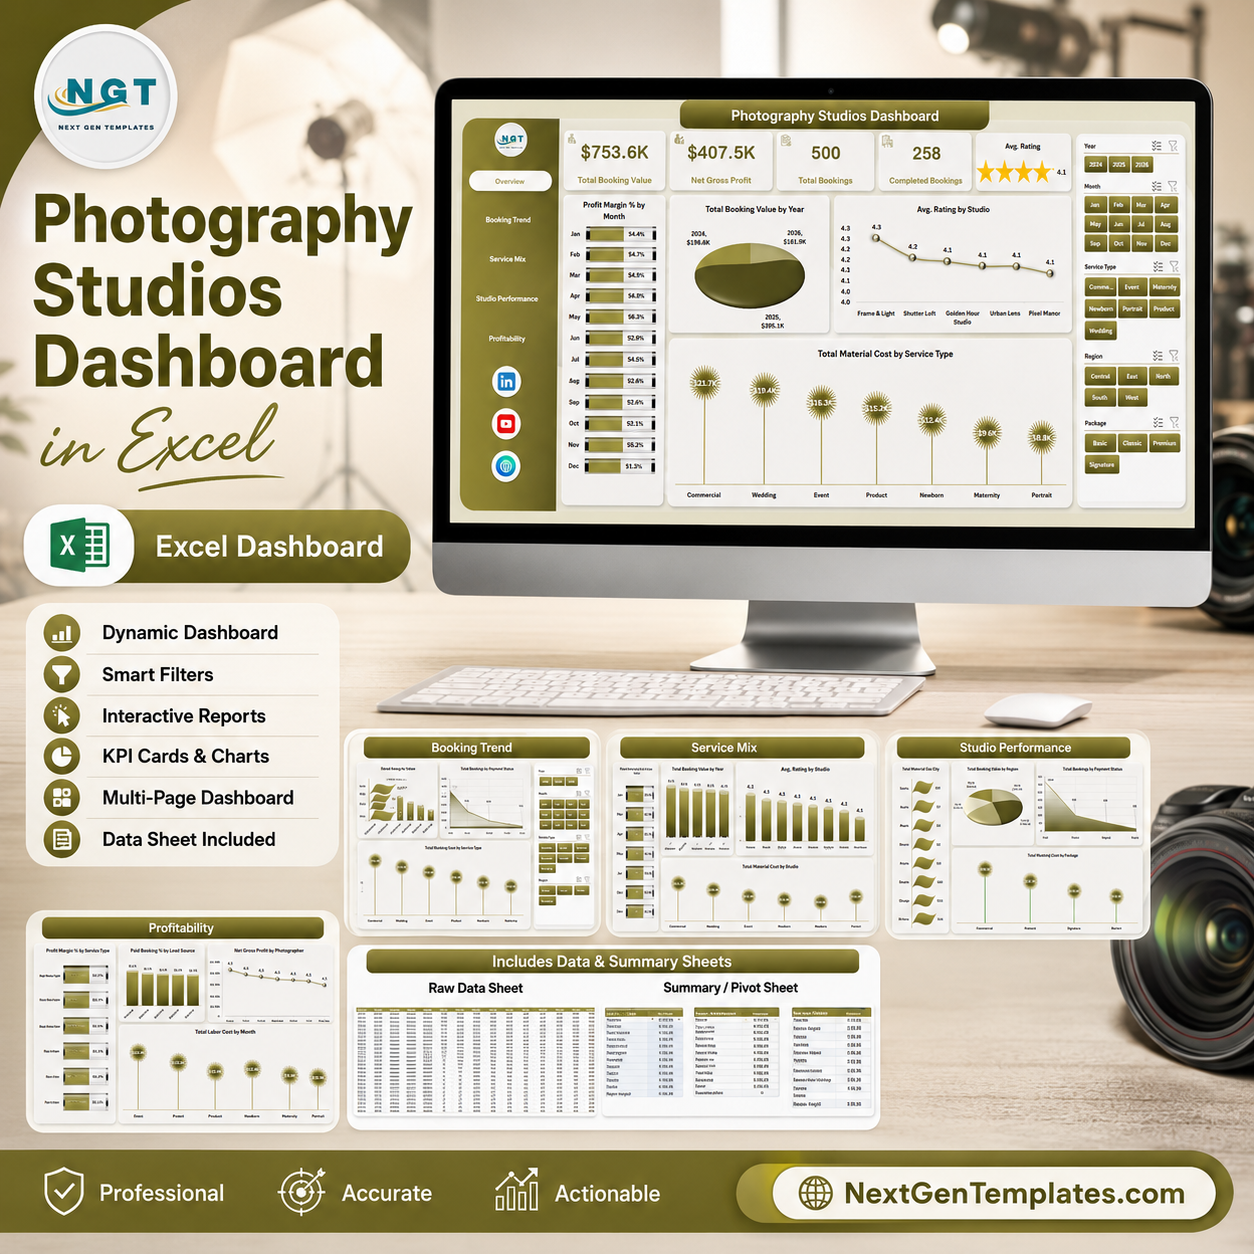


Photography Studios Dashboard in Excel gives studio owners a 7-sheet reporting workbook with 5 headline cards, 16 ready-made charts, slicer-based filtering, a data entry sheet, and a support sheet powered by pivot tables. A studio with only 25 bookings per month creates 300 records a year, and missed profit, rating, payment, or service-mix signals can quickly hide inside raw rows. This template gives you a structured Excel dashboard, one-time pricing, instant download, and no subscription risk.
Built by NextGenTemplates and PK, this workbook is made for teams that want practical Excel reporting without CRM setup time or monthly SaaS fees.
Key Features of Photography Studios Dashboard in Excel
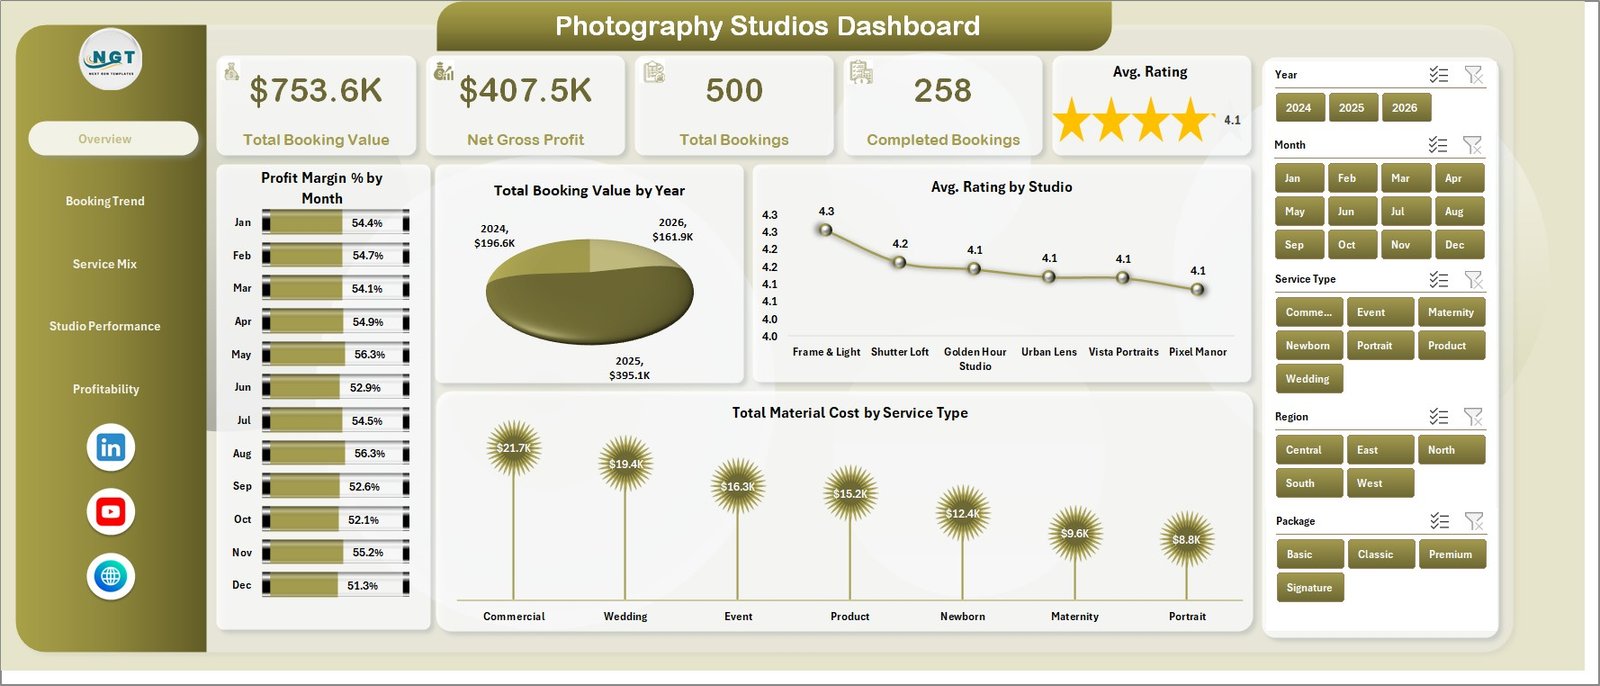
5 executive KPI cards: The Overview page tracks Total Booking Value, Net Gross Profit, Total Bookings, Completed Bookings, and Avg. Rating in one top row. These cards help owners review revenue, delivery volume, completion, and customer satisfaction before drilling into charts.
16 chart views across 5 dashboard pages: The workbook covers profit margin, booking value, ratings, material cost, lead source, booking status, service type, package, client type, studio, city, region, payment status, photographer, and labor cost analysis.
Multiple slicers for quick filtering: Use slicers to filter the dashboard by fields such as month, year, studio, photographer, service type, package, client type, city, region, status, or lead source, depending on your dataset.
Excel-native pivot structure: The Support sheet contains the pivot tables that drive the charts. After replacing the Data sheet records, use Refresh All from the Excel Data ribbon to update pivots and charts together.
Editable data format: The Data sheet is designed for adding your photography booking records in the same column structure, so the dashboard remains reusable month after month.
What’s Inside the Photography Studios Dashboard in Excel
1. Overview Page
The Overview page opens with Total Booking Value, Net Gross Profit, Total Bookings, Completed Bookings, and Avg. Rating cards. It also includes slicers and four charts for high-level studio analysis.
Profit Margin % by Month: Shows monthly margin movement so you can spot profitable and weak months. It helps separate busy months from truly profitable months.
Total Booking Value by Year: Compares booking value across years to show growth or decline. It is useful for annual planning and target review.
Avg. Rating by Studio: Compares customer satisfaction across studio locations. It helps identify where client experience is strongest or needs attention.
Total Material Cost by Service Type: Shows which photography services consume the most material cost. It supports better package pricing and cost control.
Photography Studios Dashboard in Excel
2. Booking Trend
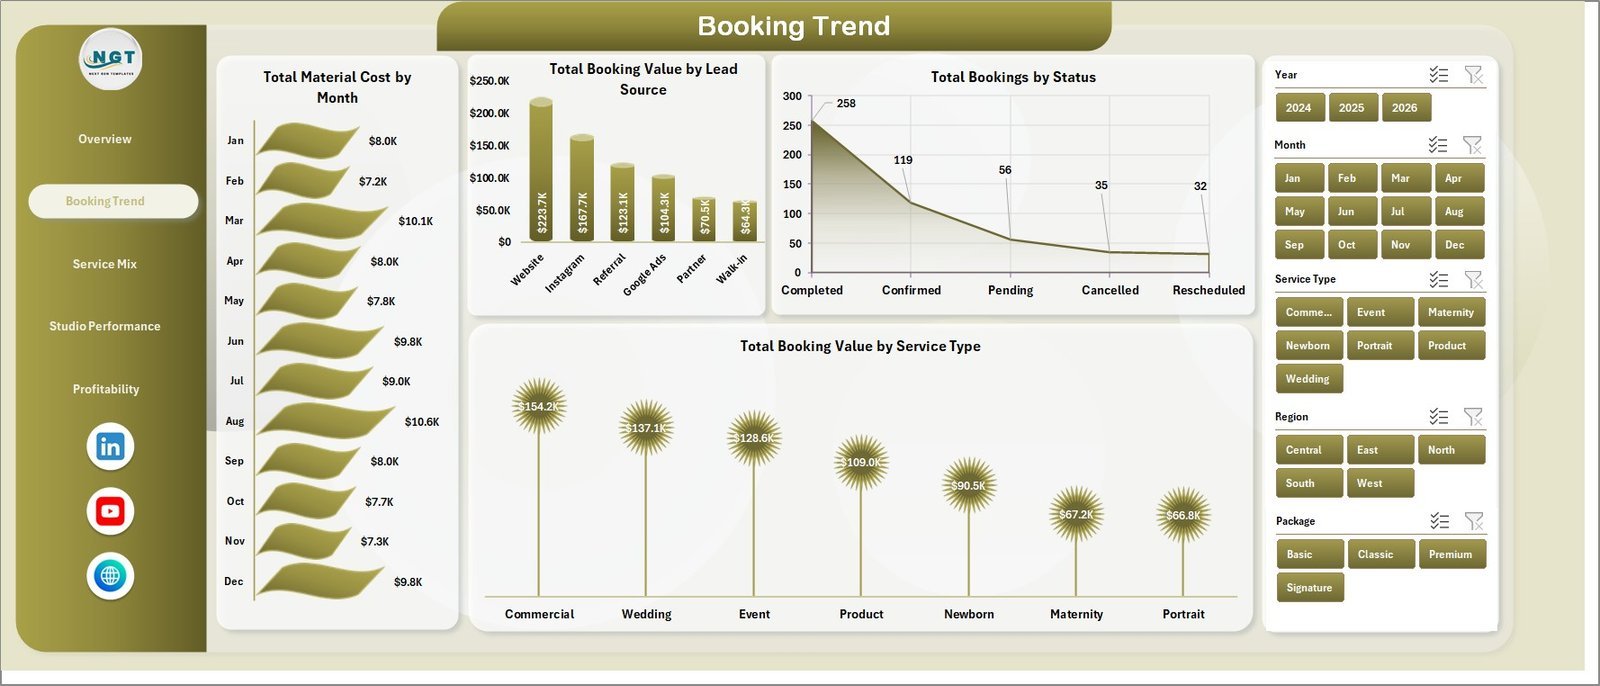
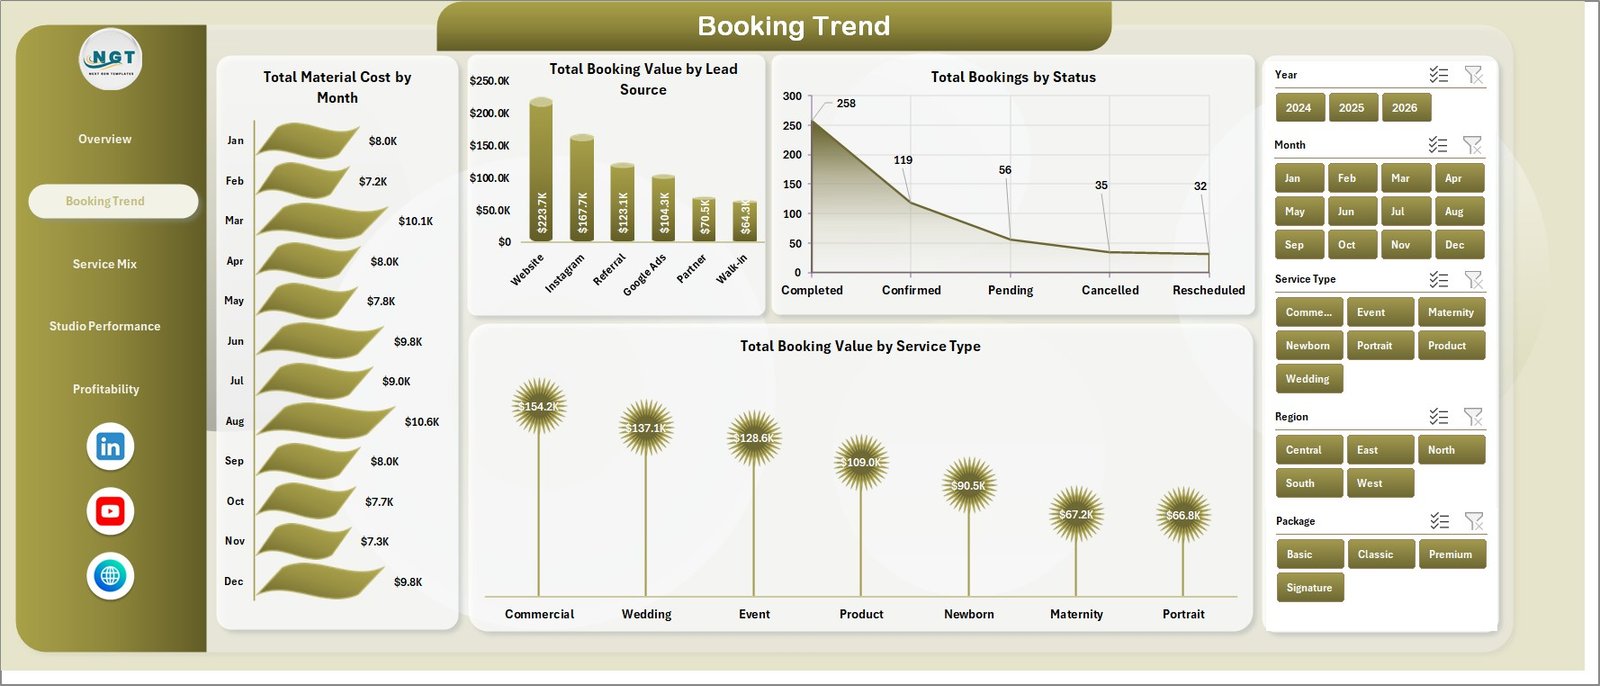
The Booking Trend page explains how bookings and cost move across months, lead sources, status groups, and service types.
Total Material Cost by Month: Tracks material spend month by month so you can see cost spikes. This is useful when busy seasons increase albums, prints, props, or editing-related expenses.
Total Booking Value by Lead Source: Compares revenue from referrals, website, social media, ads, and other sources. It helps decide which channels deserve more marketing budget.
Total Bookings by Status: Breaks booking count into completed, pending, cancelled, and other status groups. It gives a quick view of delivery pipeline and cancellation pressure.
Total Booking Value by Service Type: Shows which services generate the highest booking value. Use it to promote high-value services and review low-performing categories.
Booking Trend
3. Service Mix
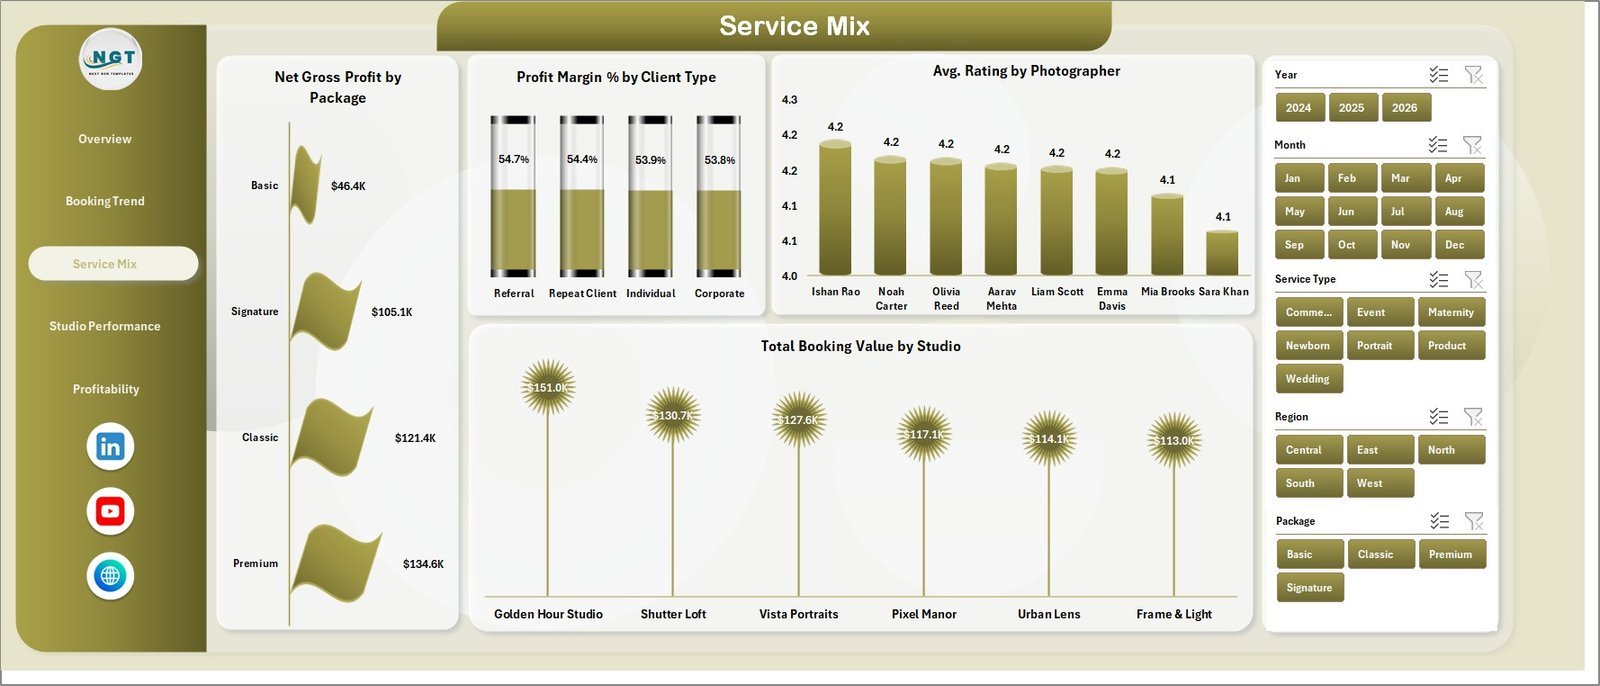
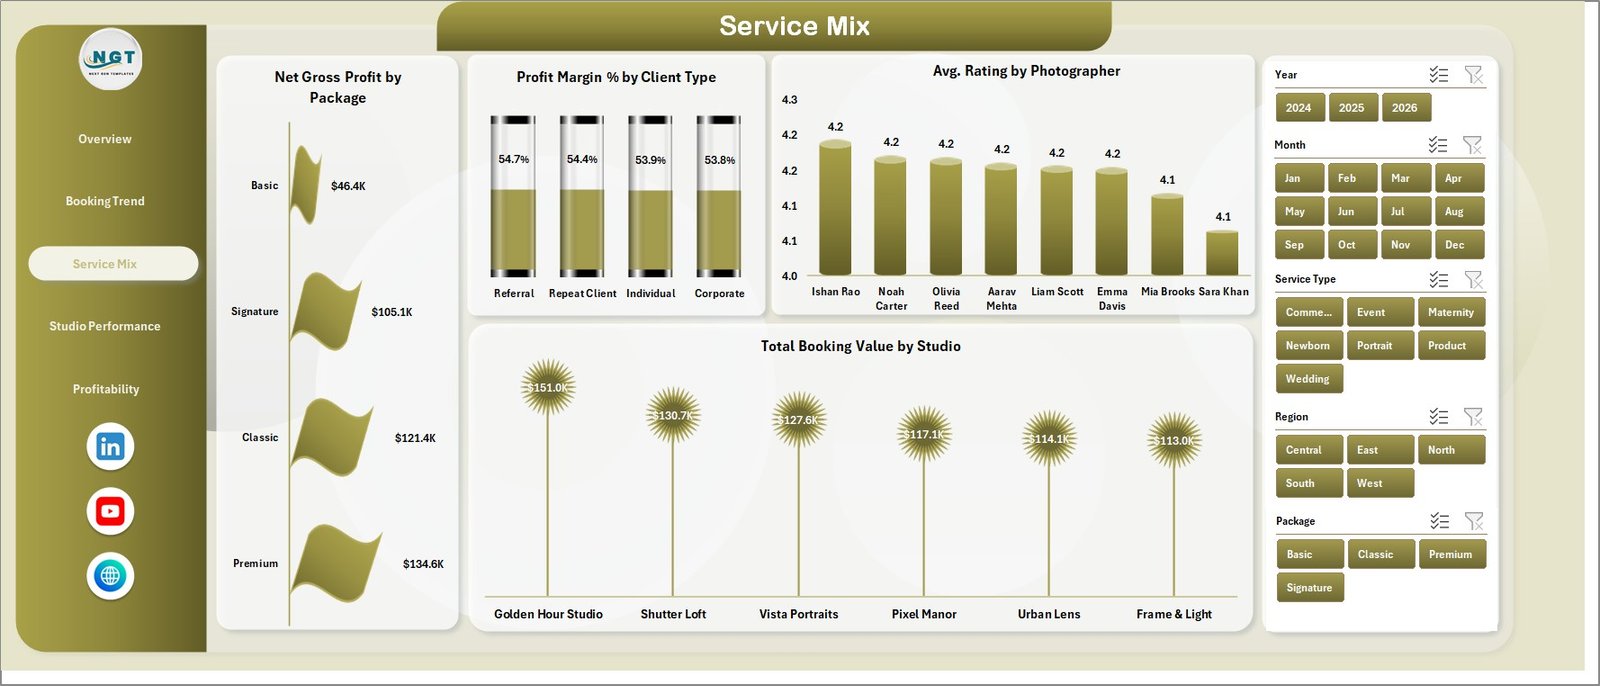
The Service Mix page focuses on packages, client types, photographer ratings, and studio revenue contribution.
Net Gross Profit by Package: Compares package-level profit so you can find the offers that create the most value. It supports pricing, bundling, and package promotion decisions.
Profit Margin % by Client Type: Shows margin differences between client segments such as individual, corporate, event, or agency clients. It helps identify which client groups deliver healthy profit.
Avg. Rating by Photographer: Compares customer rating by photographer. It is useful for coaching, recognition, and assignment planning.
Total Booking Value by Studio: Shows booking value by studio location. It helps compare branches and allocate resources where demand is strongest.
Service Mix
4. Studio Performance
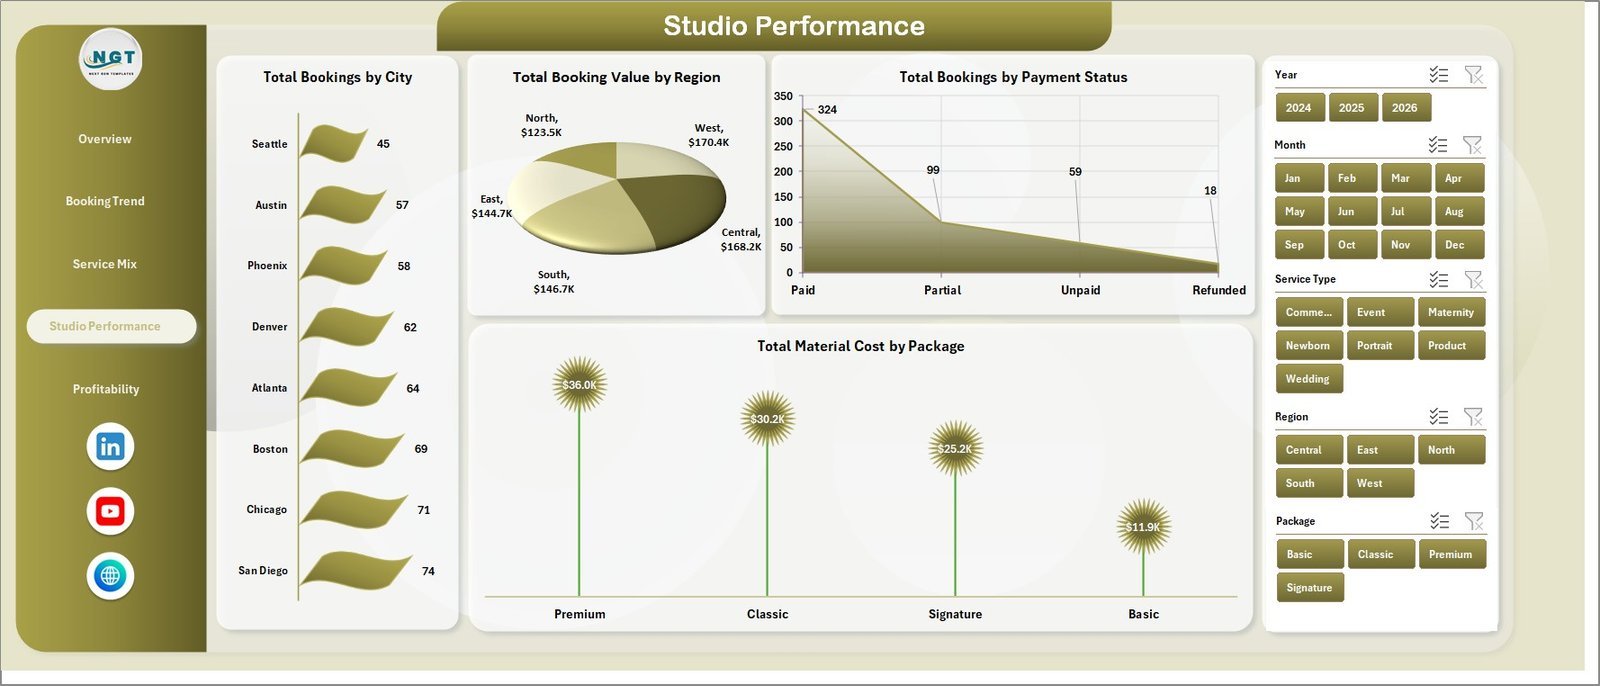
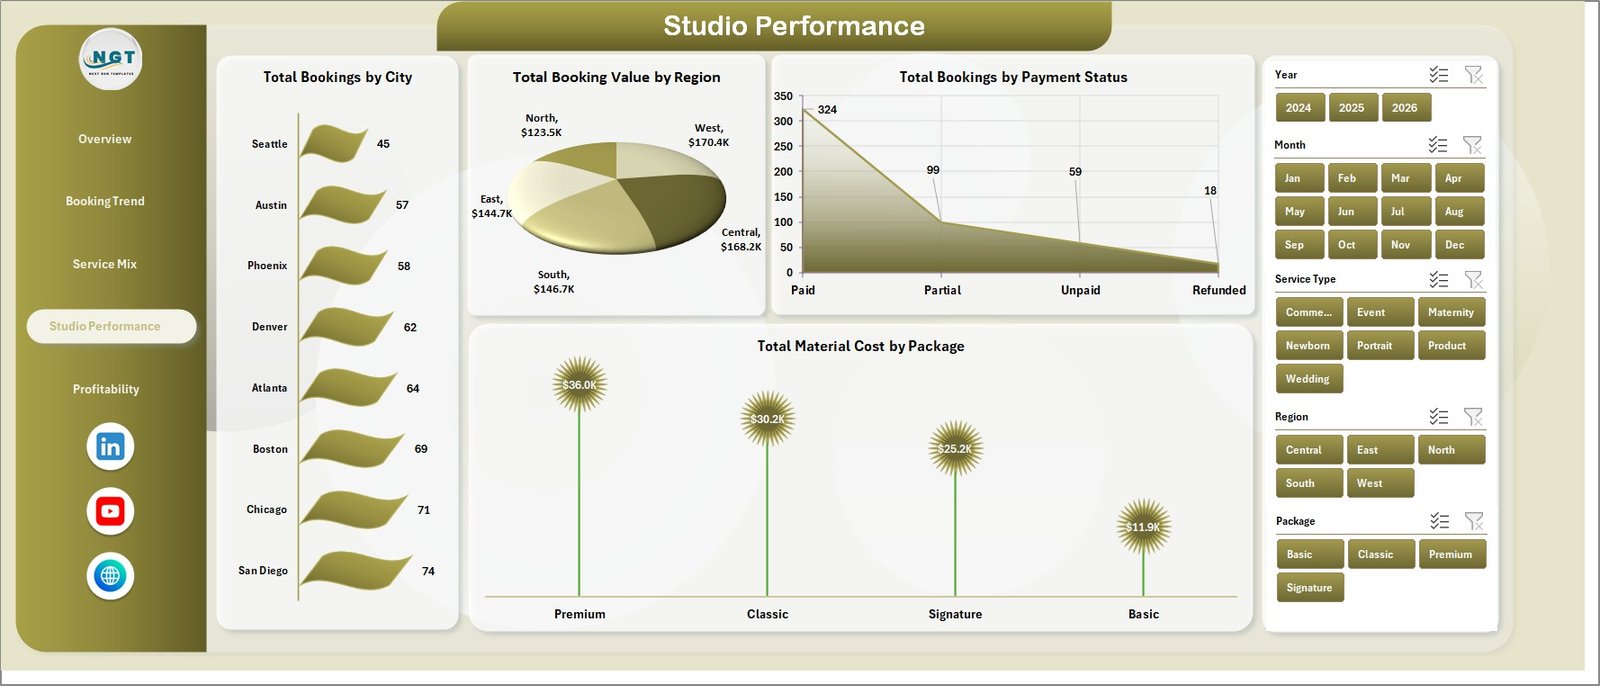
The Studio Performance page brings together city, region, payment status, and package cost views for location-level analysis.
Total Bookings by City: Shows booking volume by city so you can identify your strongest markets. It helps with staffing, travel planning, and local campaigns.
Total Booking Value by Region: Compares revenue contribution by region. Use it to review territory performance and regional sales focus.
Total Bookings by Payment Status: Shows paid, pending, partial, or unpaid booking groups. It helps monitor cash collection and follow-up priorities.
Total Material Cost by Package: Compares package cost levels. It helps identify packages that may need price changes or cost controls.
Studio Performance
5. Profitability
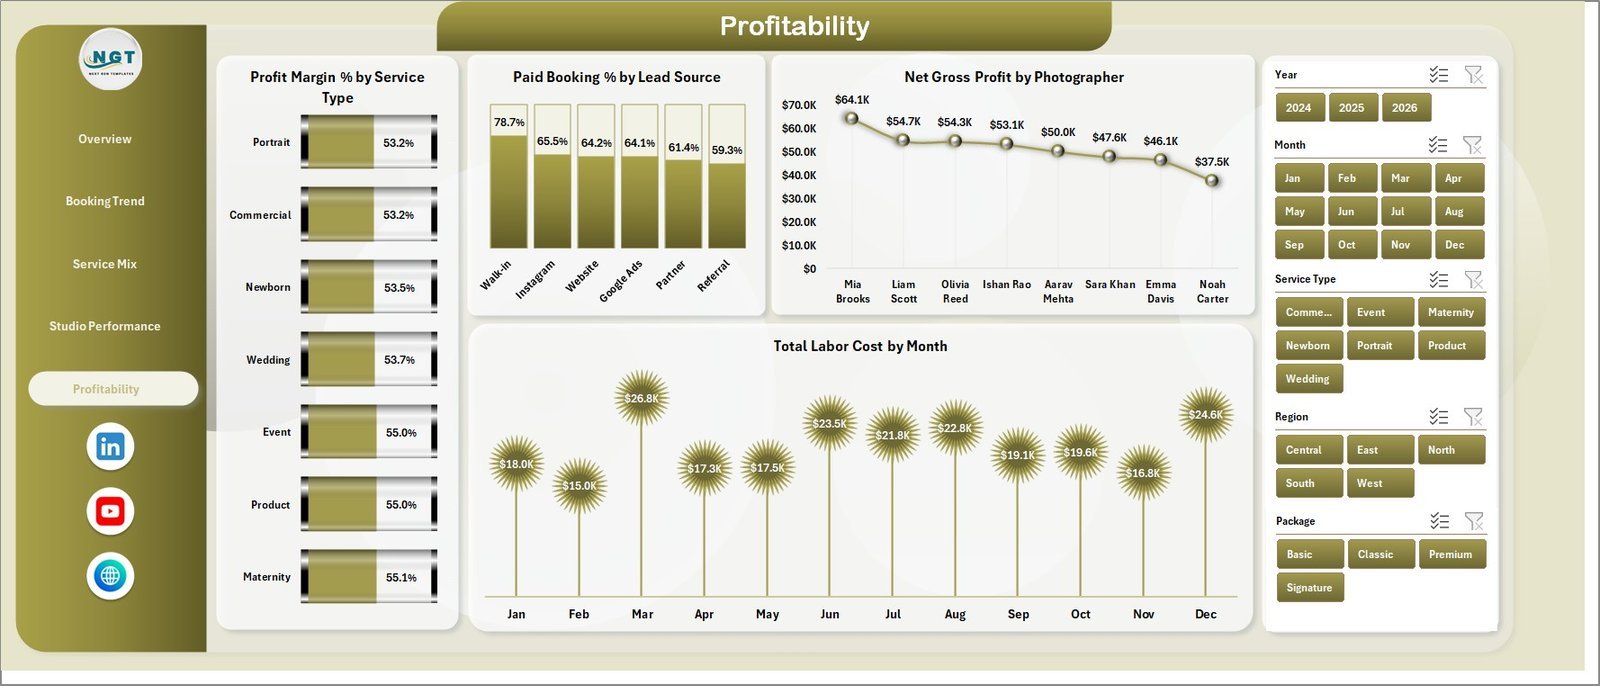
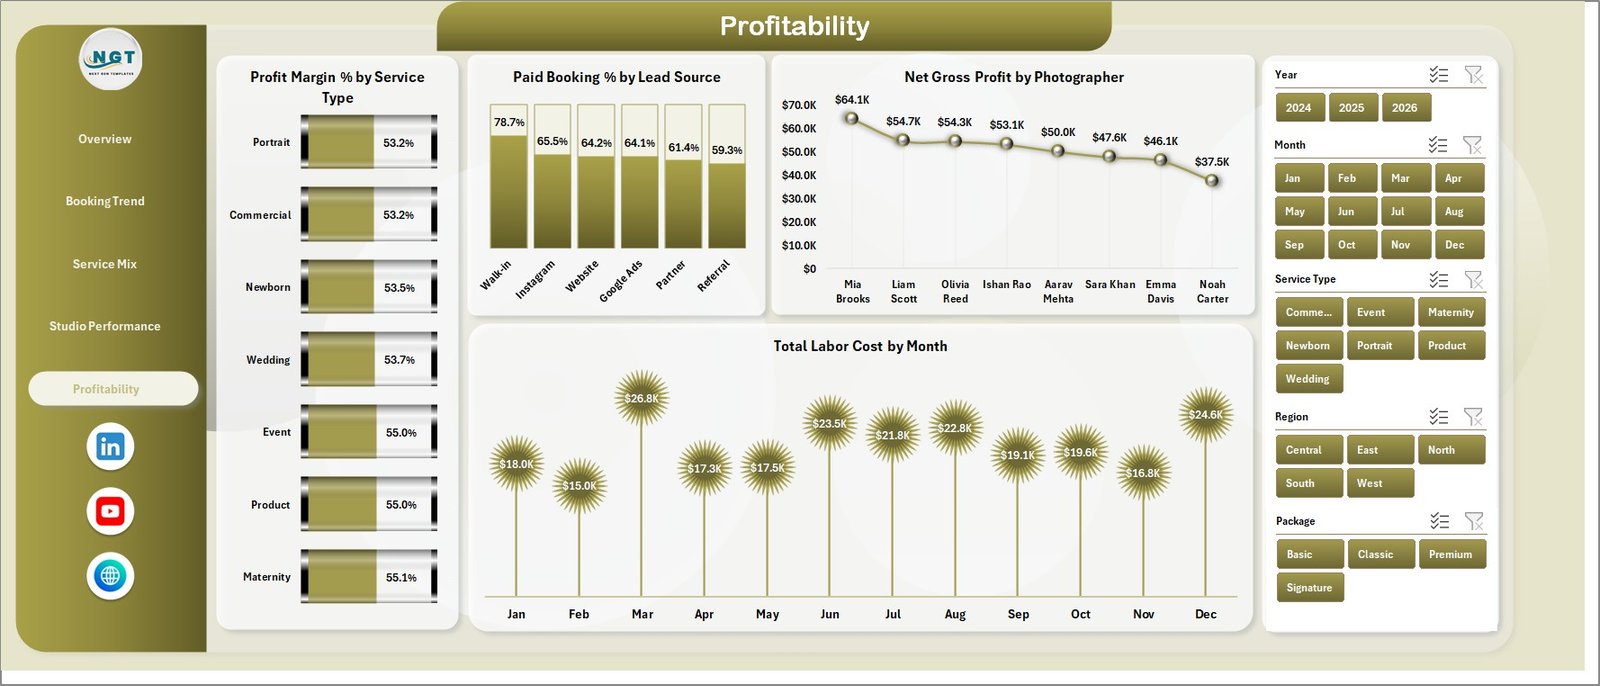
The Profitability page helps you review margin, paid booking percentage, photographer profit, and labor cost trends.
Profit Margin % by Service Type: Compares margin by service so you can separate high-revenue services from high-profit services. It supports pricing and service-mix decisions.
Paid Booking % by Lead Source: Shows which channels produce paid bookings most reliably. It helps judge lead quality, not just lead volume.
Net Gross Profit by Photographer: Compares profit contribution by photographer. This helps review assignments, productivity, and training opportunities.
Total Labor Cost by Month: Tracks labor cost over time. Use it to understand staffing pressure during busy seasons.
Profitability
6. Data Sheet Tab
The Data sheet is where you add your booking records in the same format. Keep the columns consistent so the pivots, cards, charts, and slicers continue to refresh correctly.

Data Sheet tab
7. Support Sheet Tab
The Support sheet contains the pivot tables used to build the dynamic dashboard. After updating the Data sheet, go to the Data tab in the Excel ribbon and click Refresh All. You can keep this sheet hidden during normal use.

Support sheet tab
Photography Studios Dashboard in Excel vs. Google Sheets vs. Paid CRM/SaaS – Where This Fits
| Feature | This Excel dashboard | Google Sheets dashboard | Paid CRM/SaaS |
|---|---|---|---|
| Cost | $17.99 one-time | One-time or free template | Monthly subscription |
| Platform | Microsoft Excel | Browser-based Sheets | Vendor cloud app |
| Setup time | Replace data and refresh pivots | Copy sheet and replace data | Longer onboarding |
| Customizable fields | Fully editable workbook | Editable sheet | Limited by vendor |
| Share with link | Best with OneDrive or SharePoint | Native sharing | Usually included |
| Year-1 cost at 5 users | $17.99 plus Excel licensing if needed | Template cost plus Google account | Often hundreds of dollars |
| Pivot-based refresh | Included | Uses sheet formulas/pivots | Vendor controlled |
| Photography-specific metrics | Included | Depends on template | Often generic reporting |
Who This Template Is For – and Who It’s Not For
This template is best for photography studios, wedding photography teams, portrait studios, commercial photographers, event photography agencies, and studio managers who already track bookings in Excel. It is not a full CRM, invoicing tool, client portal, contract system, or gallery delivery platform.
How to Use the Photography Studios Dashboard in Excel
- Download and unzip the Excel dashboard file.
- Open the workbook in Microsoft Excel.
- Go to the Data sheet and replace the sample rows with your booking records.
- Keep the same column structure for booking value, cost, studio, photographer, service type, package, status, payment status, lead source, and rating.
- Go to the Excel Data ribbon and click Refresh All.
- Review the dashboard pages and slicers.
Real-World Use Cases
Maya, a wedding studio owner: Maya uses Total Booking Value by Lead Source to see that referrals bring fewer bookings but higher paid booking percentage, then shifts campaign spend toward referral incentives.
Jordan, a portrait studio manager: Jordan compares Avg. Rating by Photographer and Net Gross Profit by Photographer to balance customer experience with profit contribution.
Priya, an operations lead: Priya reviews Labor Cost by Month and Material Cost by Package before busy season so pricing and staffing decisions are based on actual cost trends.
Frequently Asked Questions
What does this dashboard track?
It tracks booking value, net gross profit, total bookings, completed bookings, average rating, material cost, labor cost, payment status, service type, package, studio, city, region, lead source, photographer, and profit margin.
Do I need advanced Excel skills?
No. You mainly replace sample data on the Data sheet and use Refresh All. Basic Excel comfort is enough for normal use.
Can I change service types and packages?
Yes. Use your own service types, packages, photographers, studios, cities, and regions in the Data sheet while keeping the column format consistent.
Does it include formulas and pivots?
Yes. The Support sheet contains pivot tables used to feed the charts and cards dynamically.
Can I hide the Support sheet?
Yes. The Support sheet can stay hidden after setup because it is mainly used for backend pivot calculations.
Is this a replacement for a photography CRM?
No. It is an analytics dashboard. Use it alongside your booking, invoicing, or client management process.
About the Author
Built by PK – Microsoft Certified Professional with 15+ years of Excel, Google Sheets, and Power BI experience. Founder of NextGenTemplates, reaching 300K+ subscribers across YouTube channels. Every template is hand-built and tested before release.
Explore Related Templates
- Photography Business Dashboard in Google Sheets
- Photography Business Dashboard in Power BI
- Photography Business KPI Dashboard in Excel
- Browse Excel Dashboard Templates
Instant download. One-time payment. Editable Excel workbook.
Watch the demo video: