

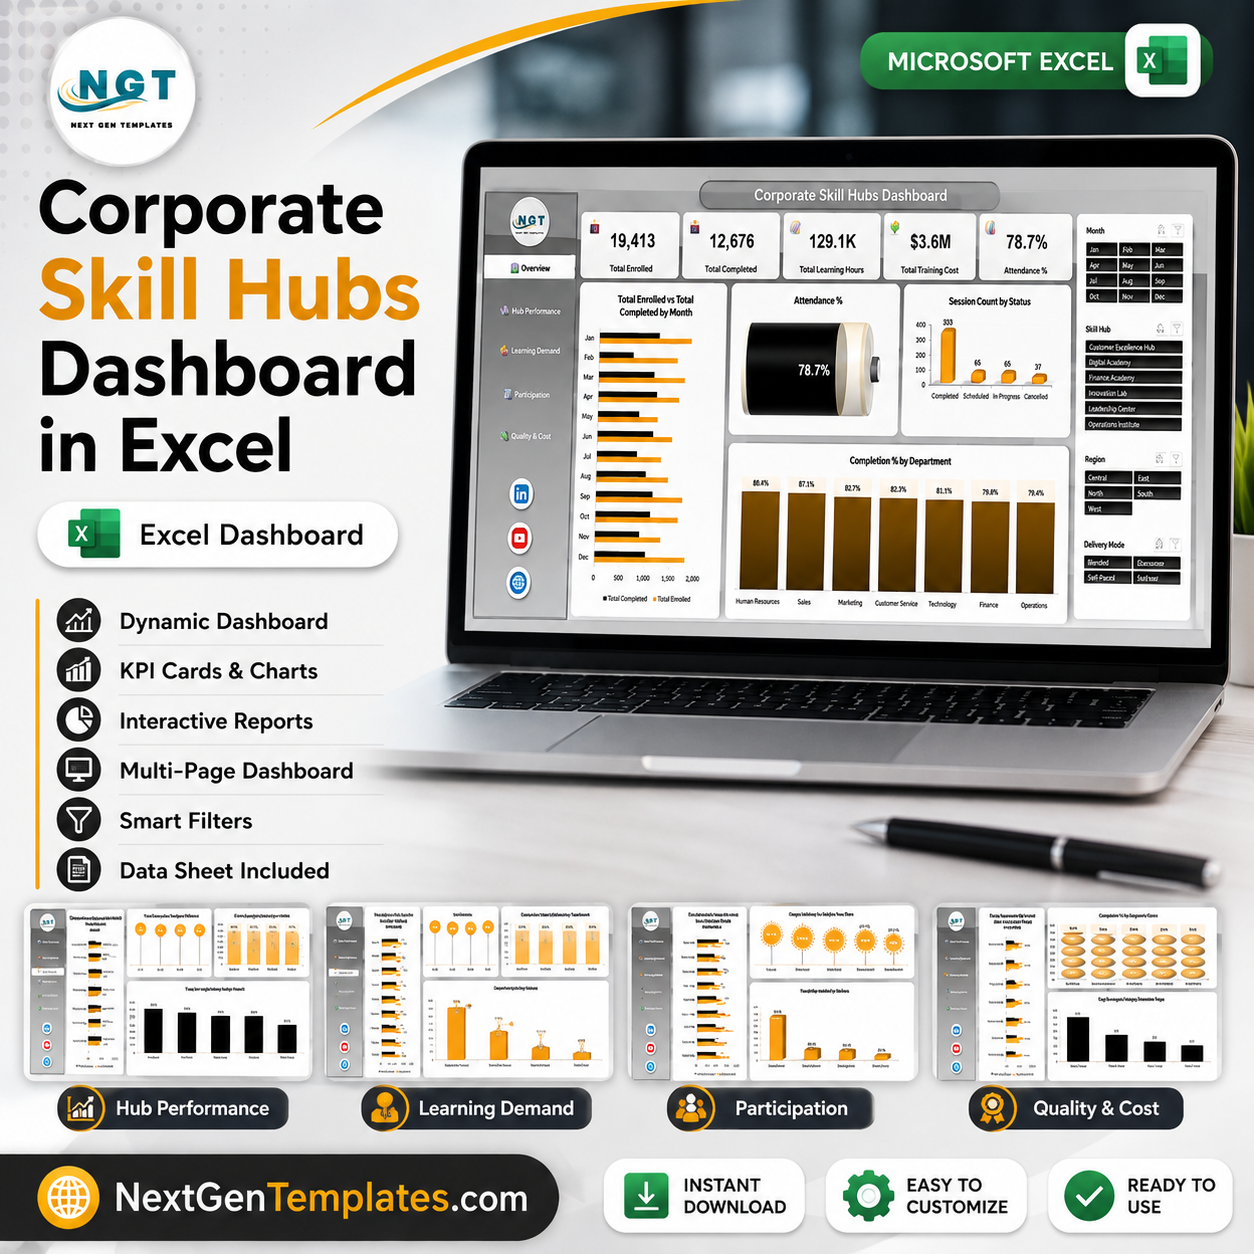
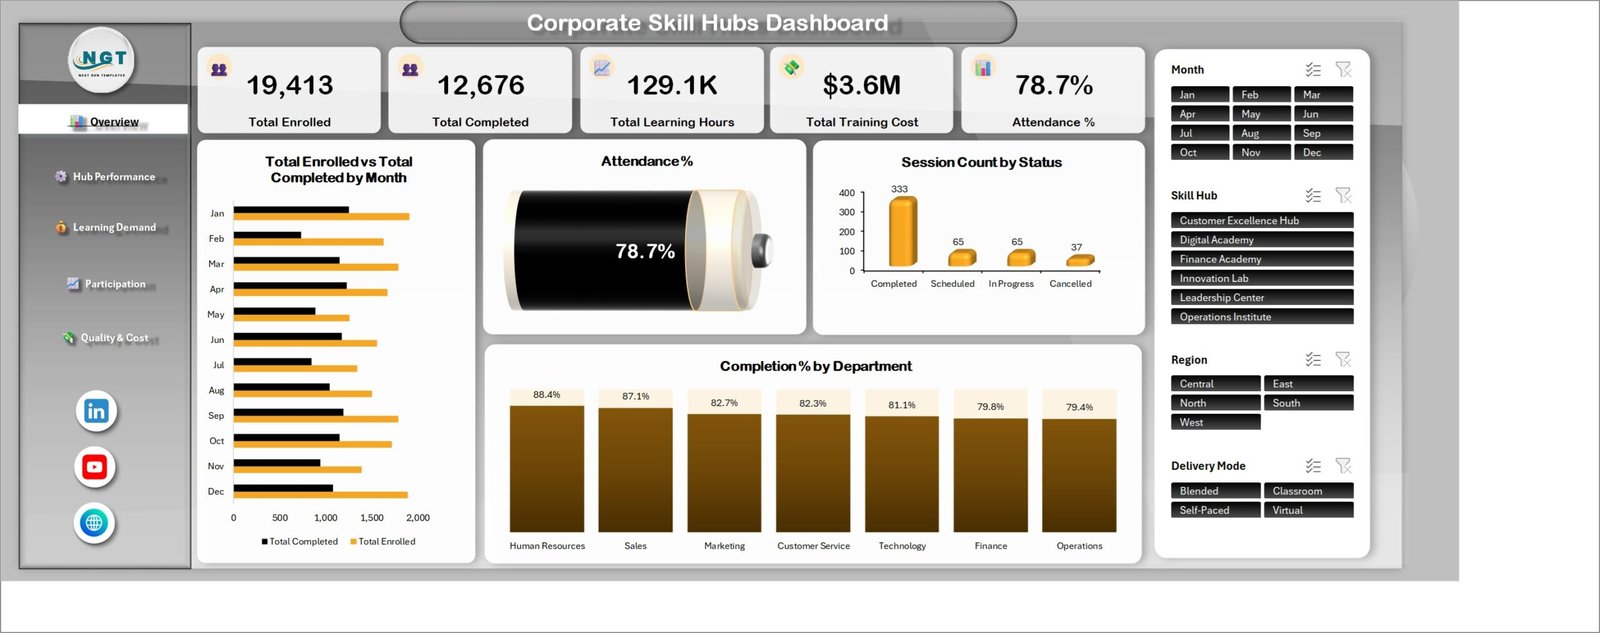
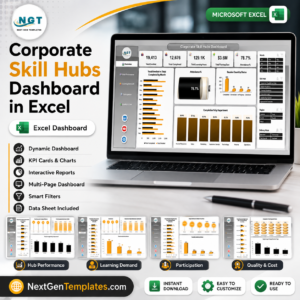
A corporate learning function that runs six academies typically loses the plot somewhere between the LMS export and the board pack. The Corporate Skill Hubs Dashboard in Excel closes that gap: one workbook, five linked pages, and 19 pivot-driven charts that turn a flat session log into an answer. The sample build tracks 19,413 enrollments, 12,676 completions, 129.1K learning hours, $3.6M of training cost and a 78.7% attendance rate across six skill hubs, seven departments, five regions and four delivery modes. Built by a Microsoft Certified Professional whose channels reach 300K+ subscribers, and hand-tested before release. Download it once, own it forever – no subscription, no licence key, and nothing to install beyond the copy of Excel you already have.
This is the analytical five-page dashboard, not a month-picker scorecard. If you want traffic lights against monthly targets instead, the Corporate Skill Hubs KPI Dashboard in Excel is the scorecard version of the same subject – different template, and many teams buy both.
Key Features of the Corporate Skill Hubs Dashboard in Excel
- Five KPI cards on the Overview page – Total Enrolled (19,413), Total Completed (12,676), Total Learning Hours (129.1K), Total Training Cost ($3.6M) and Attendance % (78.7%), each recalculating the moment a slicer changes.
- Four slicers wired to every page – Month, Skill Hub, Region and Delivery Mode share a single pivot cache, so filtering to Q3 Virtual sessions in the Digital Academy reshapes all 19 charts at once.
- Chart set built for questions, not decoration – Total Enrolled vs Total Completed by Month, Completion % by Department, Session Count by Status, Total Training Cost by Business Unit, Enrolled vs Capacity by Skill Domain, and Avg. Assessment Score vs Avg. Manager Rating by Skill Hub.
- 21 source columns covering Skill Hub, Business Unit, Department, Region, Delivery Mode, Program Category, Skill Domain, Course Name, Audience Level, Facilitator Type, capacity, enrolled, attended, completed, learning hours, assessment score, training cost, manager rating and status.
- 500 sample session records so every chart is populated on first open – delete them and paste yours in the same layout.
- No macros and no add-ins – the file is a plain .xlsx, so it opens on locked-down corporate machines and passes email filters that block .xlsm.
What’s Inside the Corporate Skill Hubs Dashboard in Excel
Seven worksheets: five dashboard pages, one Data sheet and one Support sheet.
1. Overview
The single-screen summary. Five KPI cards sit above Total Enrolled vs Total Completed by Month, an Attendance % dial reading 78.7%, Session Count by Status (333 Completed, 65 Scheduled, 65 In Progress, 37 Cancelled) and Completion % by Department, where Human Resources leads at 88.4% and Operations trails at 79.4%.
2. Hub Performance
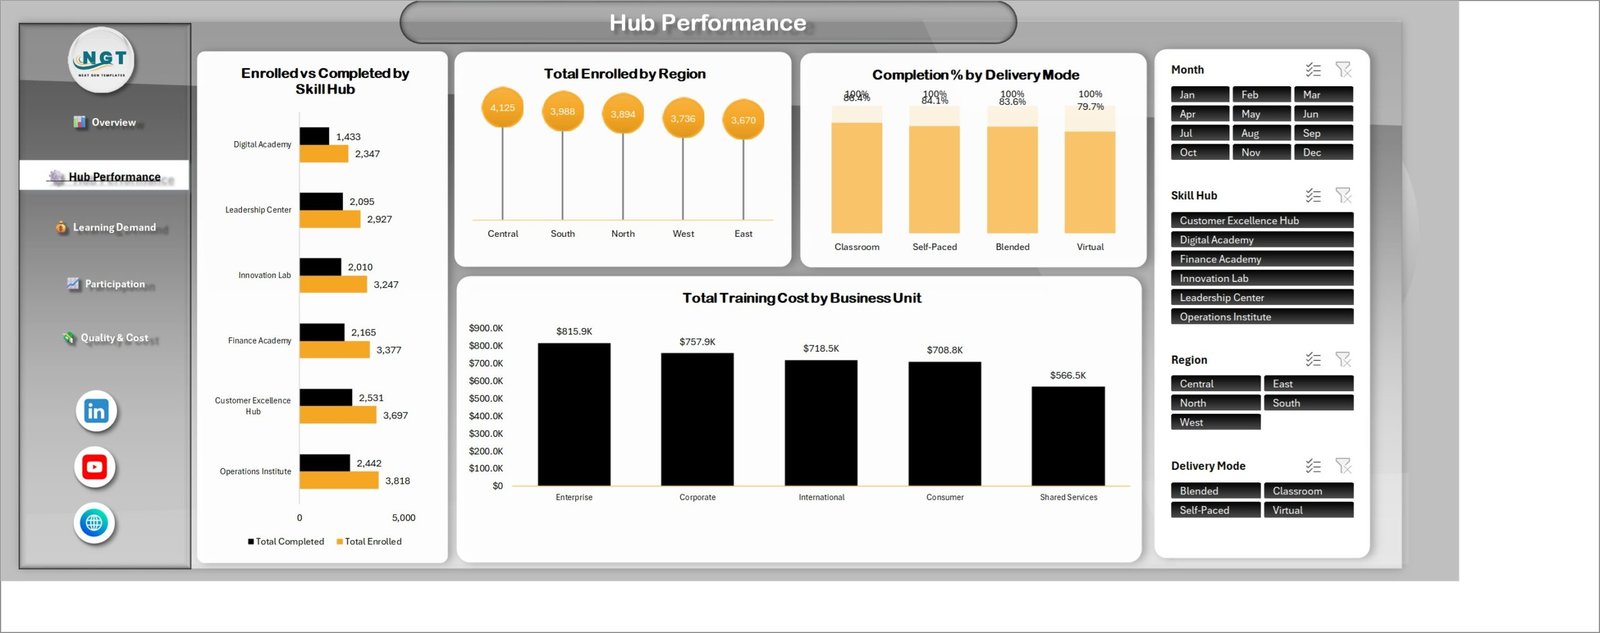
The hub league table. Enrolled vs Completed by Skill Hub puts all six academies side by side – Operations Institute takes the most enrollments (3,818) while the Customer Excellence Hub converts the most completions (2,531). Alongside it, Total Enrolled by Region (Central 4,125 down to East 3,670), Completion % by Delivery Mode (Classroom 86.4%, Self-Paced 84.1%, Blended 83.6%, Virtual 79.7%) and Total Training Cost by Business Unit, led by Enterprise at $815.9K.
3. Learning Demand
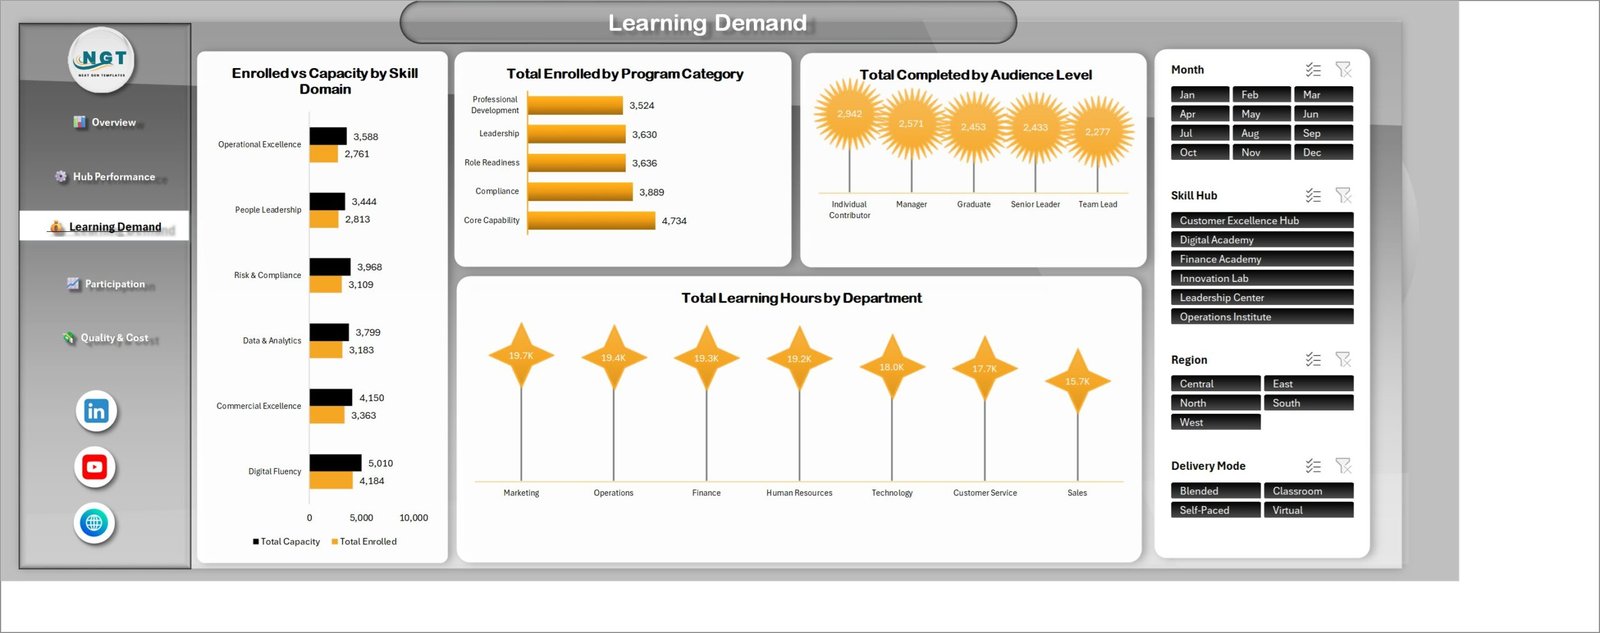
Where demand outruns supply. Enrolled vs Capacity by Skill Domain shows Digital Fluency running 4,184 enrollments against 5,010 seats while Risk & Compliance sits at 3,109 of 3,968. Total Enrolled by Program Category ranks Core Capability first at 4,734, and Total Completed by Audience Level and Total Learning Hours by Department finish the page.
4. Participation
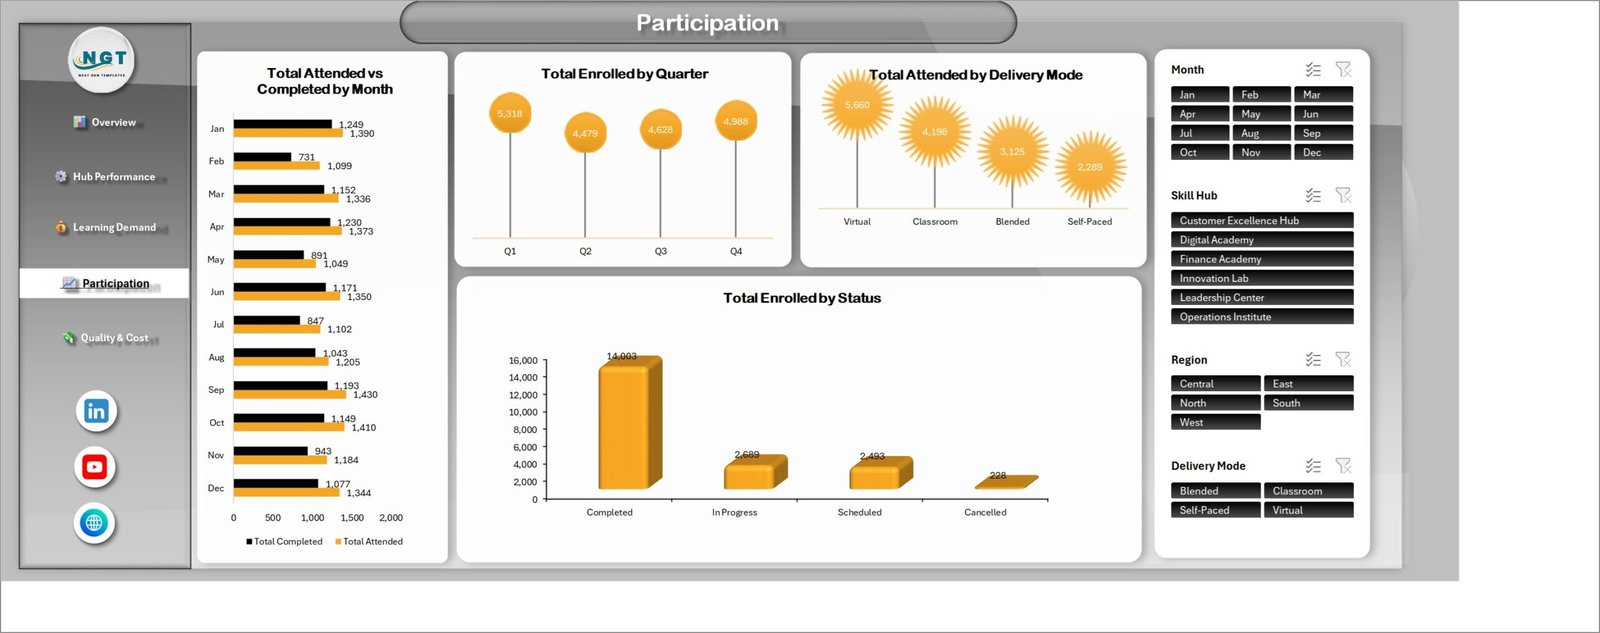
The attendance story month by month. Total Attended vs Completed by Month exposes February as the weak spot (1,099 attended, 731 completed), Total Enrolled by Quarter peaks in Q1 at 5,318, Total Attended by Delivery Mode puts Virtual on top at 5,660, and Total Enrolled by Status confirms 14,003 completed against just 228 cancelled.
5. Quality & Cost
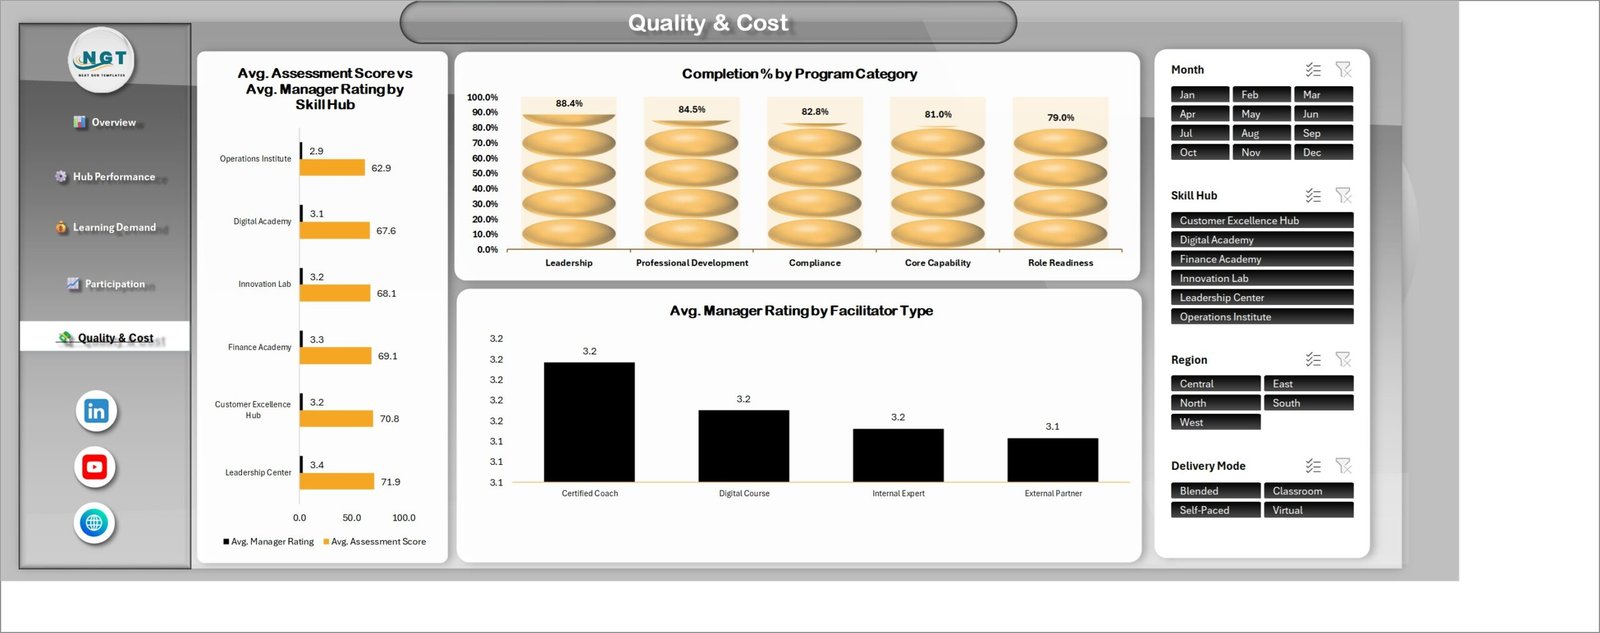
Avg. Assessment Score vs Avg. Manager Rating by Skill Hub pairs the two quality signals – Leadership Center leads on both (71.9 and 3.4), Operations Institute lags on both (62.9 and 2.9). Completion % by Program Category and Avg. Manager Rating by Facilitator Type complete the view.
6. Data and 7. Support
The Data sheet holds the 500-row session table that feeds every pivot. The Support sheet carries the helper calculations behind the KPI cards and the attendance dial. Both stay visible so you can audit any number back to its source.
Corporate Skill Hubs Dashboard in Excel vs. Google Sheets vs. a Paid LMS Analytics Suite – Where This Fits
| What matters | This Excel dashboard | Google Sheets build | Paid LMS analytics (Docebo, Cornerstone) |
|---|---|---|---|
| Cost | $17.99 once | Free, but you build it | Per-learner annual licence |
| Platform | Excel 2016+ or Microsoft 365 | Browser | Vendor cloud |
| Setup time | Under 30 minutes | Days of chart wiring | Weeks of implementation |
| Real-time team collaboration | Via OneDrive or SharePoint | Native | Native |
| Mobile access | Excel mobile app | Any browser | Vendor app |
| Customisable fields | All 21 columns are yours | Fully open | Limited to vendor schema |
| Share with a link | OneDrive link | Yes | Seat required |
| Year-1 cost at 5 users | $17.99 | $0 plus your build time | Typically four figures and up |
| Works without your LMS | Yes – any CSV export | Yes | No |
| Cost per session in the same view as completion | Yes | If you build it | Often a separate module |
Who This Template Is For – and Who It’s Not For
A good fit if you run a multi-academy corporate learning function, report L&D numbers to a leadership team monthly, export session data from an LMS or collect it in a shared sheet, or need training spend and completion visible in one place without buying an analytics module.
Not for you if you need live LMS sync (this reads a pasted or exported table, not an API), individual learner transcripts and certification records, SCORM or xAPI statement analysis, or compliance-grade audit trails. It is a management reporting layer, not a system of record.
How to Use the Corporate Skill Hubs Dashboard in Excel
- Unzip the download and open the workbook. Read the included Excel Dashboard – User Manual PDF first – it is four minutes well spent.
- Go to the Data sheet and look at the 500 sample rows to see what each of the 21 columns expects.
- Paste your own session export over the sample rows, keeping the column order. Add rows freely – the table expands.
- Press Ctrl + Alt + F5 (Refresh All). All 19 charts and the five KPI cards repopulate.
- Rename the Skill Hub, Business Unit, Department and Program Category values on the Data sheet to your own – the slicers pick them up automatically.
- Use the four slicers to answer a question, then screenshot or print the page straight into your monthly review pack.
Real-World Use Cases
Priya, L&D Director at a 4,000-person services firm. Six academies, one board slide due every month. She pastes the quarterly LMS export in, filters to the last three months, and screenshots the Hub Performance page. The Operations Institute’s gap between 3,818 enrollments and 2,442 completions is the whole conversation – and it is visible in one chart.
Marco, Finance Business Partner for HR. He cares about the $3.6M, not the attendance rate. The Training Cost by Business Unit chart on Hub Performance tells him Enterprise absorbs $815.9K, and the Completion % by Department chart tells him whether that money produced anything.
Ayesha, Regional Learning Manager. She filters everything to her region and Virtual delivery. Completion % by Delivery Mode shows Virtual at 79.7% against Classroom’s 86.4%, which becomes her case for redesigning the virtual curriculum rather than adding more sessions.
Frequently Asked Questions
Does this connect to my LMS automatically?
No. It reads a table you paste onto the Data sheet. Any LMS, HRIS or spreadsheet that can export a session list to CSV will work – map your columns to the 21 provided and refresh.
Is this the same as the Corporate Skill Hubs KPI Dashboard?
No, and that is deliberate. This is the analytical five-page dashboard with slicers and 19 charts. The KPI Dashboard is a month-picker scorecard with traffic lights against targets. Different structures, different jobs.
Do I need macros enabled?
No. The file is a plain .xlsx with pivot tables, pivot charts and slicers. Nothing to enable, nothing to unblock.
Which Excel versions work?
Excel 2016 and later on Windows, and Microsoft 365. Slicers need a desktop version – Excel for the web will display the workbook but slicer interaction is limited.
Can I add my own skill hubs or departments?
Yes. Type your own values into the Data sheet columns and refresh. The slicers, charts and KPI cards read the data, not a hard-coded list.
Can I change the colours to our brand?
Yes – the pages use standard Excel shape fills and chart formatting. Select a chart, change the series fill, and it holds through refreshes.
Are the numbers real?
No. All 500 rows are realistic sample data generated for demonstration so the dashboard is populated on first open. Replace them with yours.
About the Author
Built by PK – Microsoft Certified Professional with 15+ years of Excel, Google Sheets, and Power BI experience. Founder of NextGenTemplates, reaching 300K+ subscribers across YouTube channels. Every template is hand-built and tested before release.
Explore Related Templates
- Corporate Skill Hubs KPI Dashboard in Excel – the month-picker scorecard twin of this dashboard.
- Leadership Development Dashboard in Excel – zoom in on the leadership pipeline.
- Knowledge Hubs Dashboard in Excel – the content and knowledge-base counterpart.
- Online Certification Providers Dashboard in Excel – track external certification spend.
- Corporate Universities Dashboard in Excel – a broader corporate academy view.
- HR Director Toolkit – ten HR templates bundled at a discount.
Browse the full Excel Dashboard and HR and Payroll collections for more.
Add the Corporate Skill Hubs Dashboard in Excel to your cart and you will be looking at your own training numbers before your next coffee goes cold. Instant download, lifetime access, and a full walkthrough on the companion blog post.
Last updated: 20 August 2026.























Reviews
There are no reviews yet.