

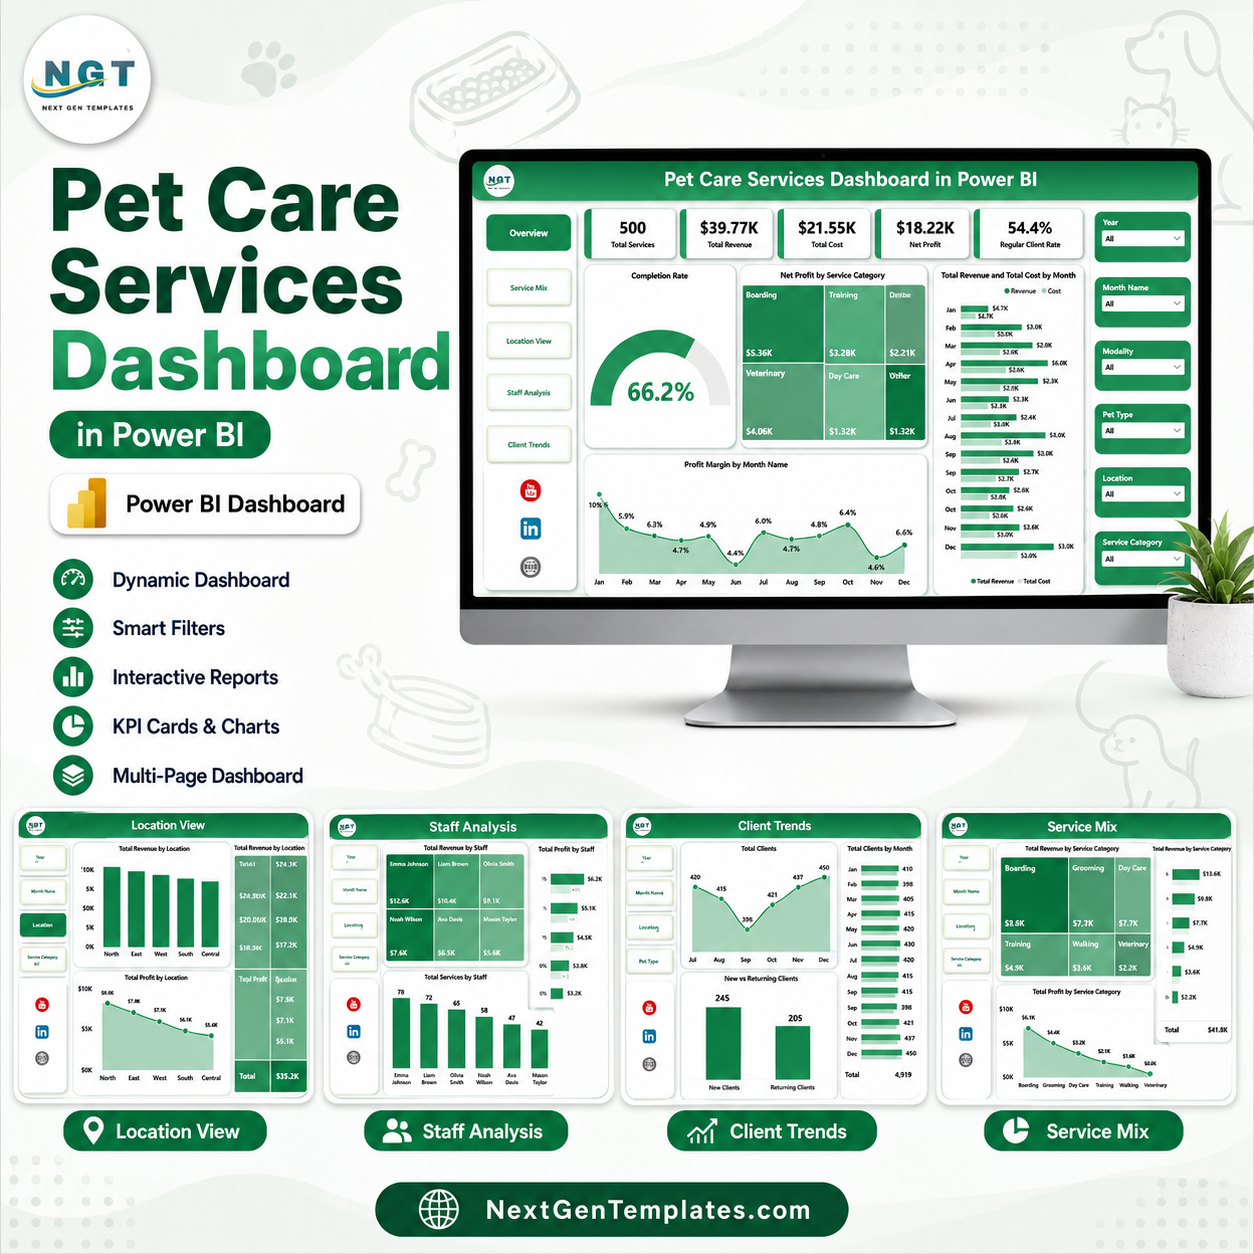

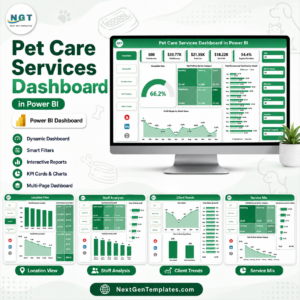
Pet Care Services Dashboard in Power BI gives grooming salons, daycare centers, boarding providers, trainers, veterinary support teams, and multi-location pet care businesses a 5-page Power BI report with 5 KPI cards, multiple slicers, and 15 focused chart views. For a one-time $17.99 sale price, you can review service volume, revenue, cost, net profit, repeat client behavior, completion rate, staff performance, locations, booking channels, and client trends without paying for a monthly reporting SaaS. Built by PK for a 300K+ subscriber learning audience, this dashboard is made for practical service reviews and faster decisions.
Pet Care Services Dashboard in Power BI
Key Features of Pet Care Services Dashboard in Power BI
- 5 Power BI pages: Overview, Service Mix, Location View, Staff Analysis, and Client Trends.
- 5 headline cards: Total Services, Total Revenue, Total Cost, Net Profit, and Repeat Client Rate.
- 15 analysis visuals: Review completion, revenue, cost, profit, margin, staff, location, booking channel, pet type, priority, and monthly trends.
- Interactive slicers: Filter the dashboard quickly to review a selected service category, staff member, pet type, location, or period.
- Service profitability view: Compare net profit, revenue, cost, and margin across services and time periods.
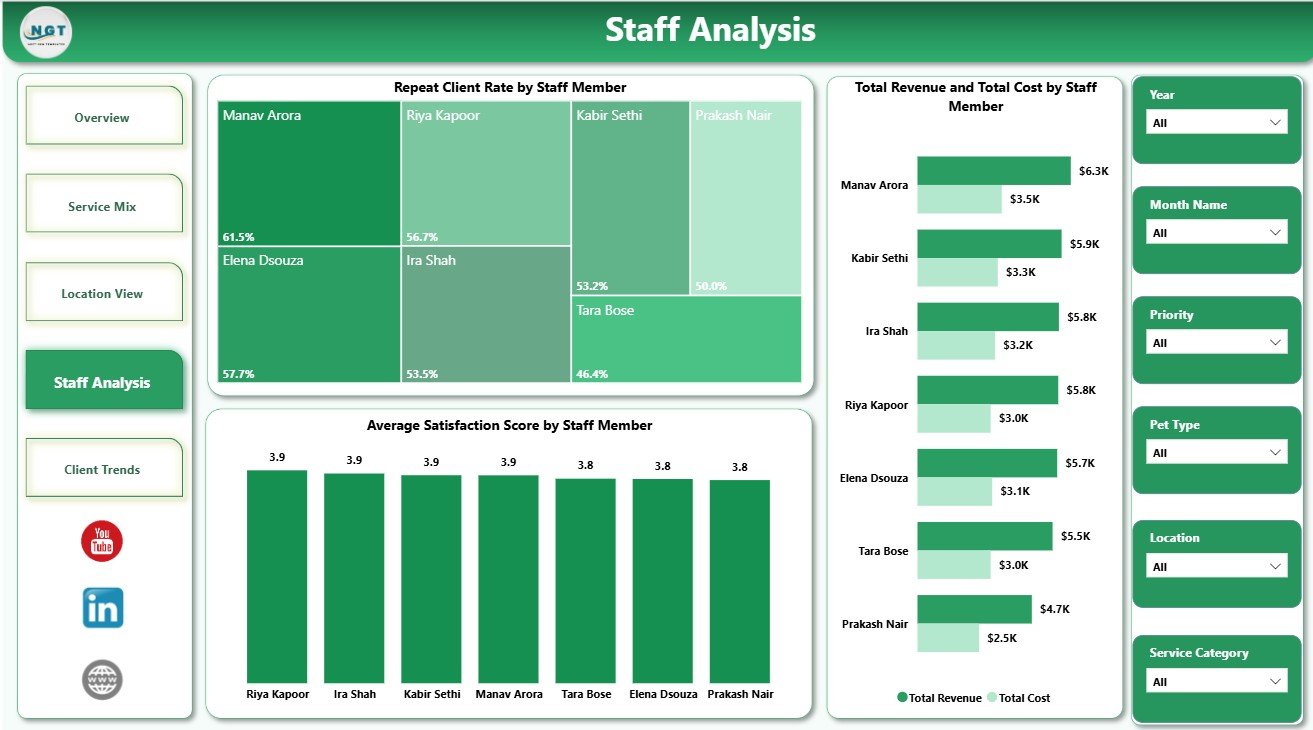
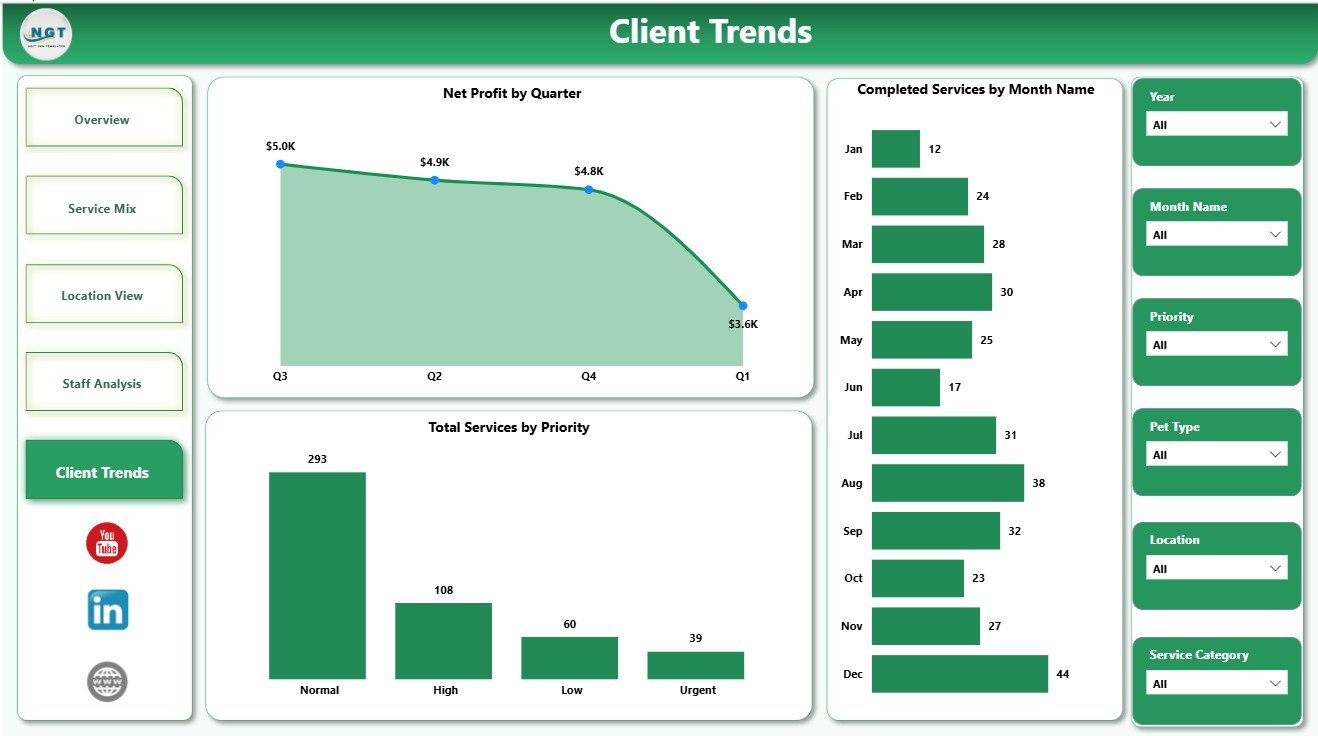
- Staff and client trend pages: Track repeat client rate, satisfaction score, monthly completion, quarterly profit, and priority mix.
What’s Inside the Pet Care Services Dashboard in Power BI
1 – Overview Page
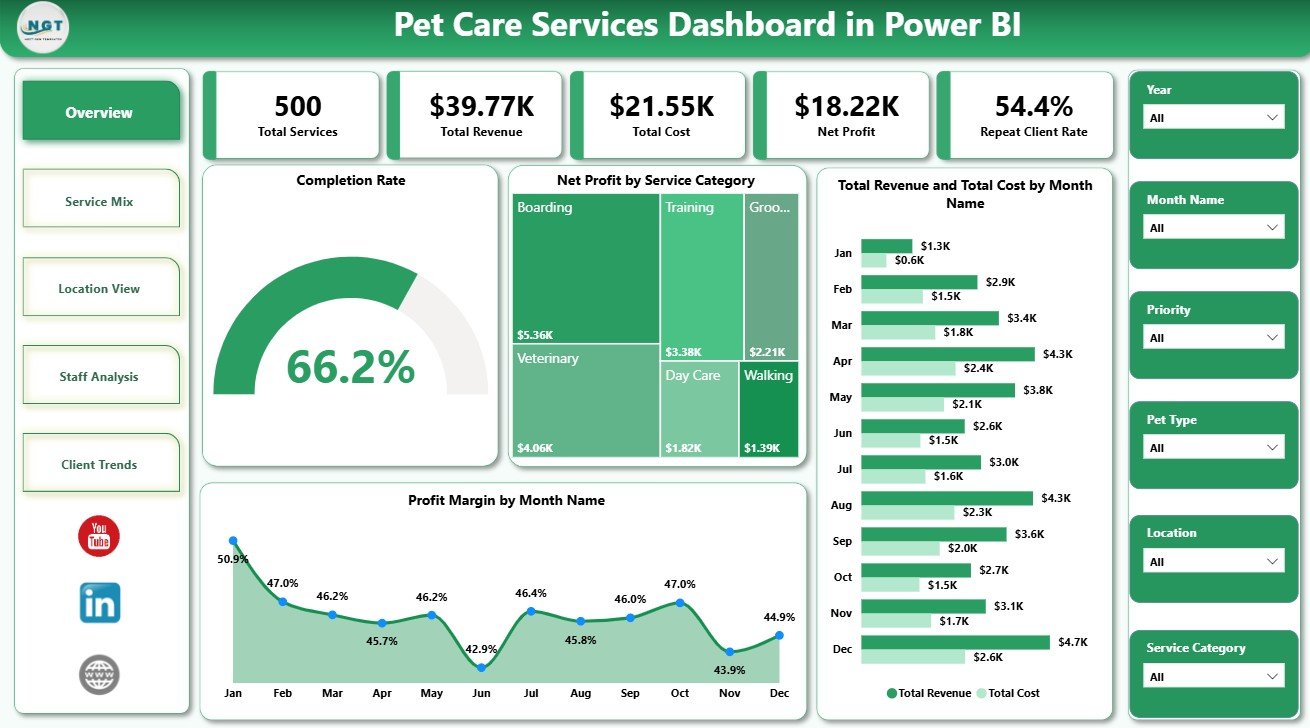
The Overview page shows the high-level business picture before you move into service, location, staff, and client detail. The top cards display Total Services, Total Revenue, Total Cost, Net Profit, and Repeat Client Rate, while slicers let you filter the full report quickly.
Completion Rate by Service Status: This chart shows how services are distributed by completion status. It helps managers spot unfinished work, cancellations, and operational follow-up needs.
Net Profit by Service Category: This visual compares bottom-line contribution across grooming, daycare, boarding, training, wellness, or other service groups. It helps owners identify which categories deserve more focus.
Total Revenue and Total Cost by Month Name: This chart compares monthly income against monthly cost. It makes seasonal demand, cost pressure, and margin movement easier to review.
Profit Margin by Month Name: This trend shows how margin changes across the year. It helps managers see whether higher revenue months are also producing healthier profit.
2 – Service Mix
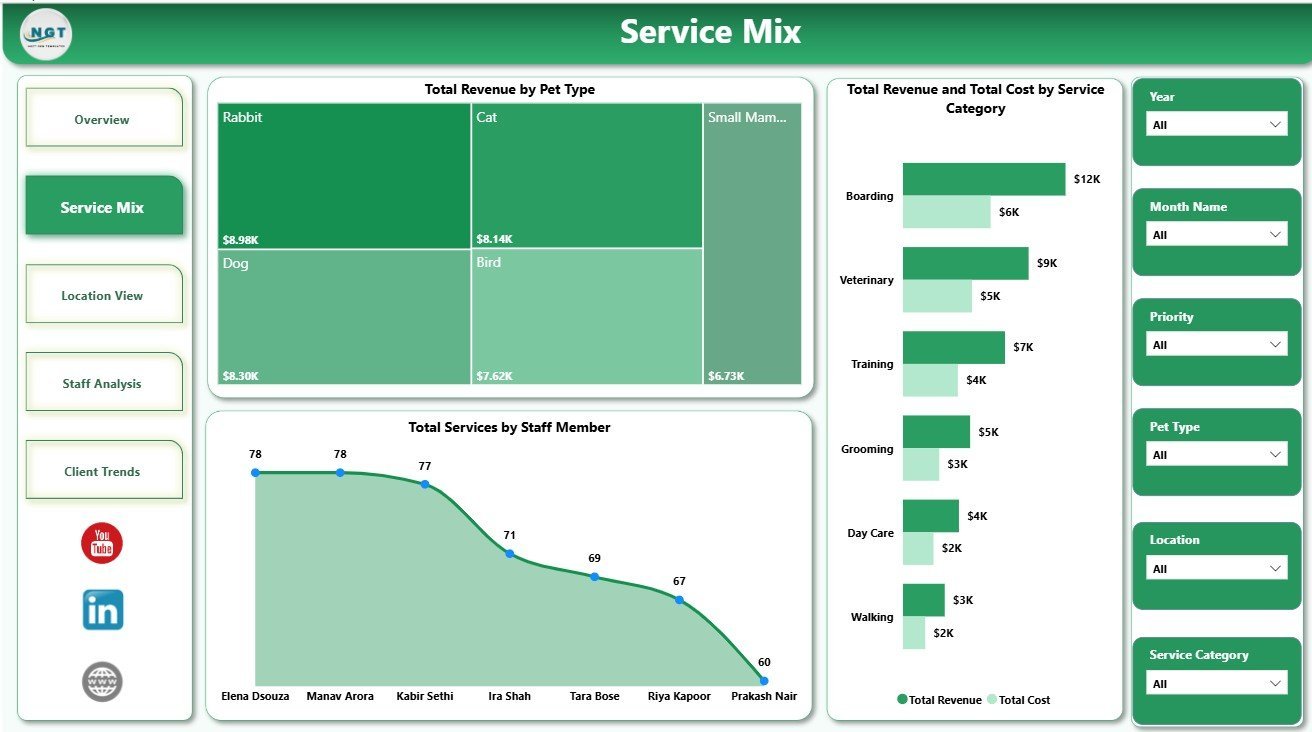
The Service Mix page explains how service revenue and cost are spread across pets, categories, and staff members. It includes Total Revenue by Pet Type, Total Revenue and Total Cost by Service Category, and Total Services by Staff Member.
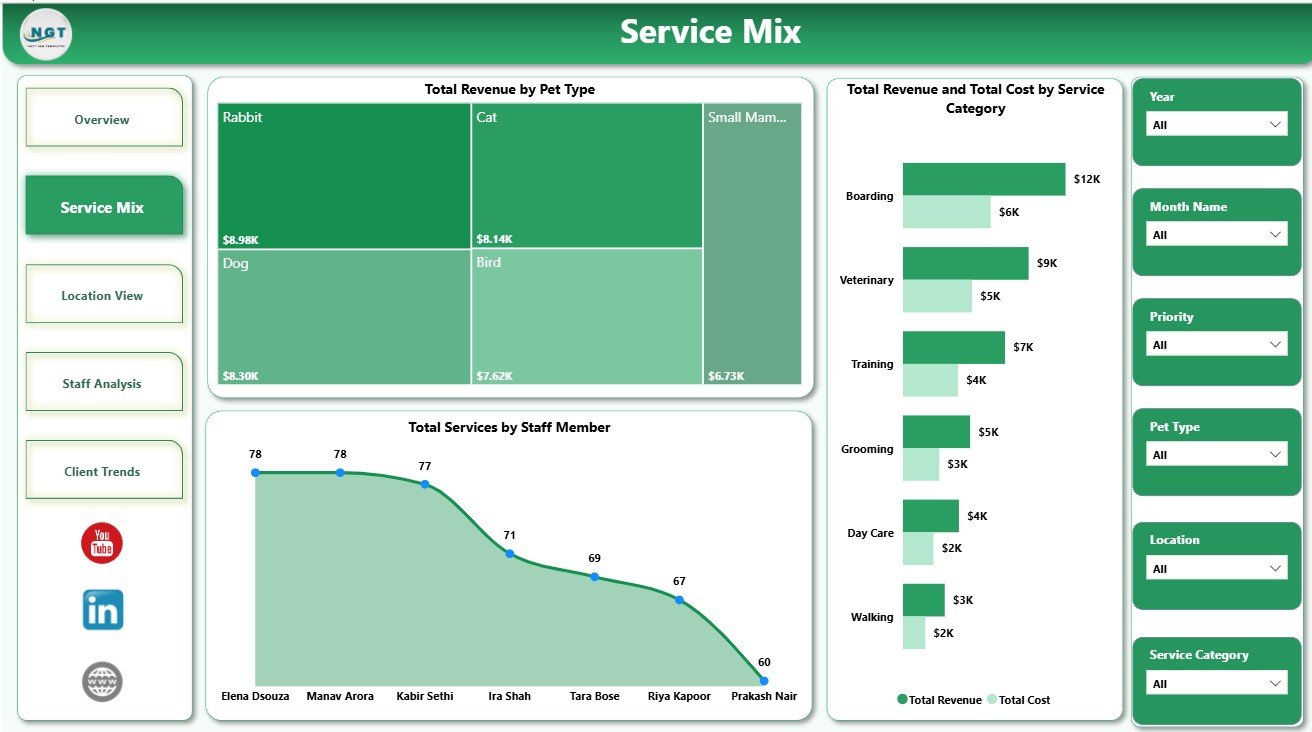
Service Mix
3 – Location View
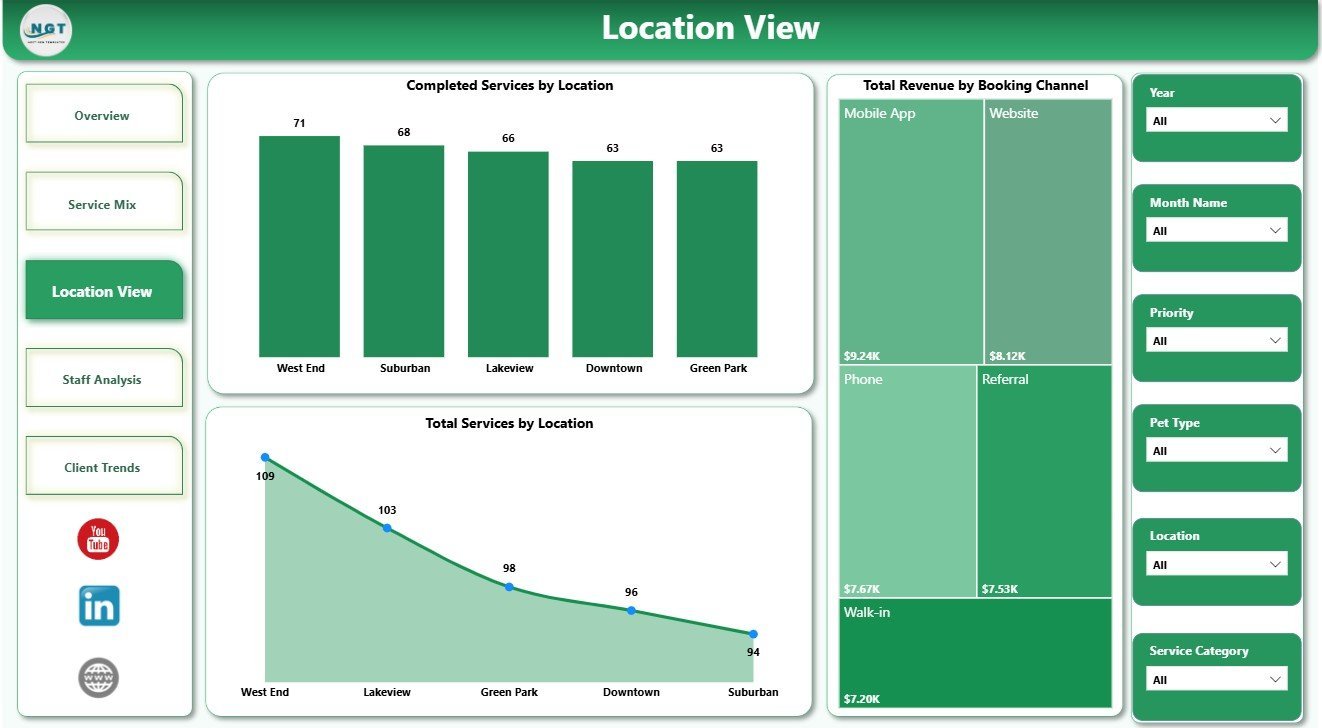
The Location View page helps multi-location pet service businesses compare branch-level work and revenue channels. It includes Completed Services by Location, Total Revenue by Booking Channel, and Total Services by Location.
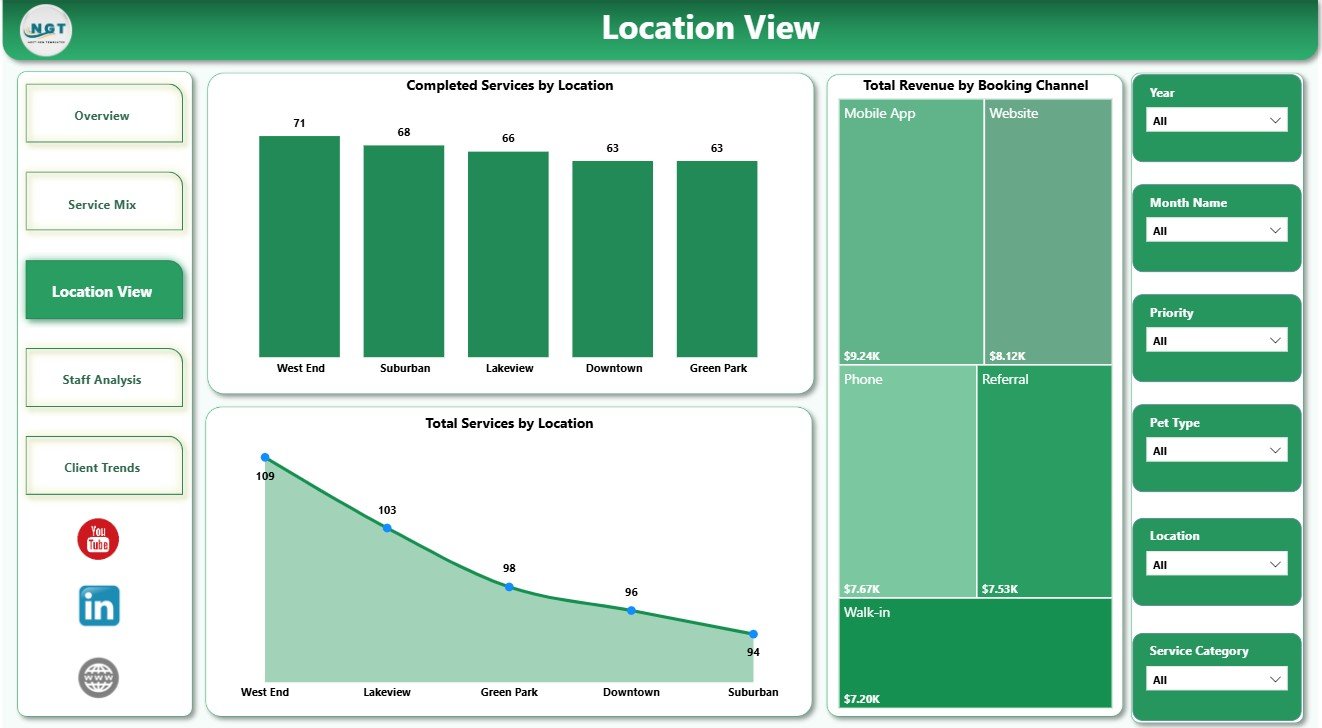
Location View
4 – Staff Analysis
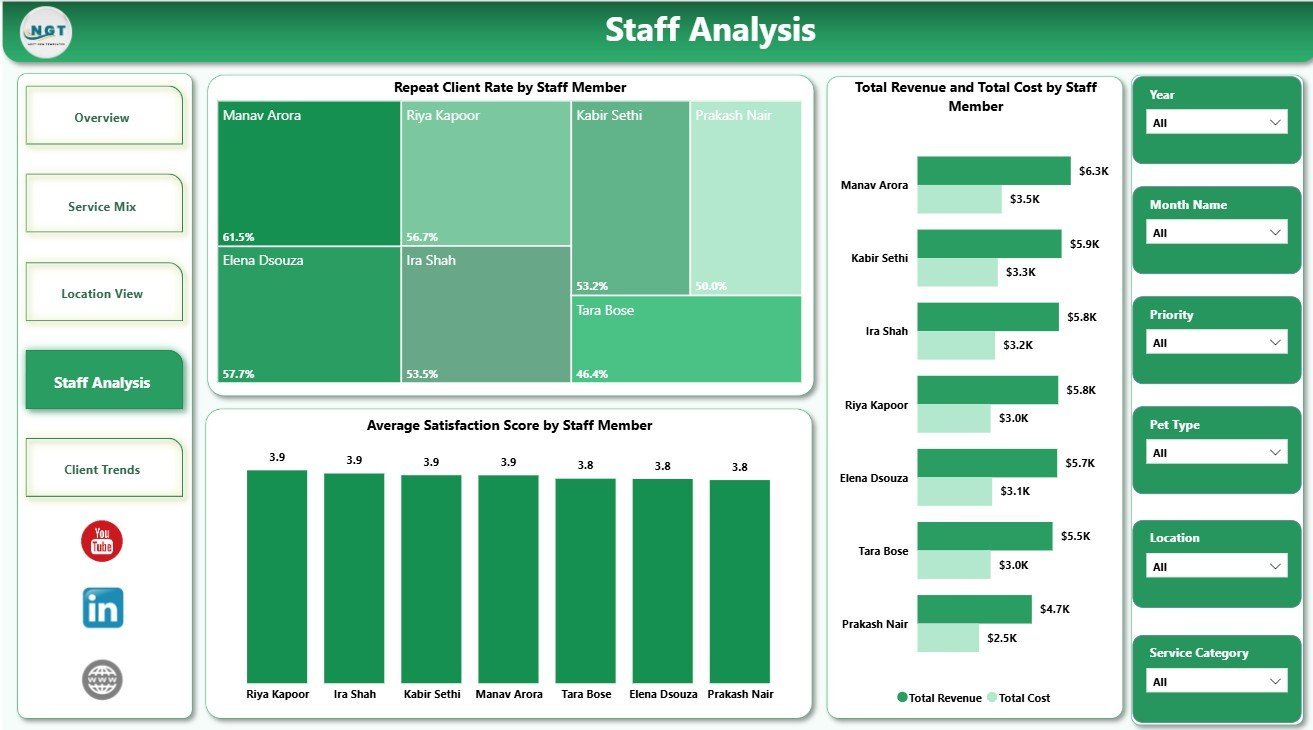
The Staff Analysis page is built for coaching, scheduling, and service-quality review. It includes Repeat Client Rate by Staff Member, Average Satisfaction Score by Staff Member, and Total Revenue and Total Cost by Staff Member.
Staff Analysis
5 – Client Trends
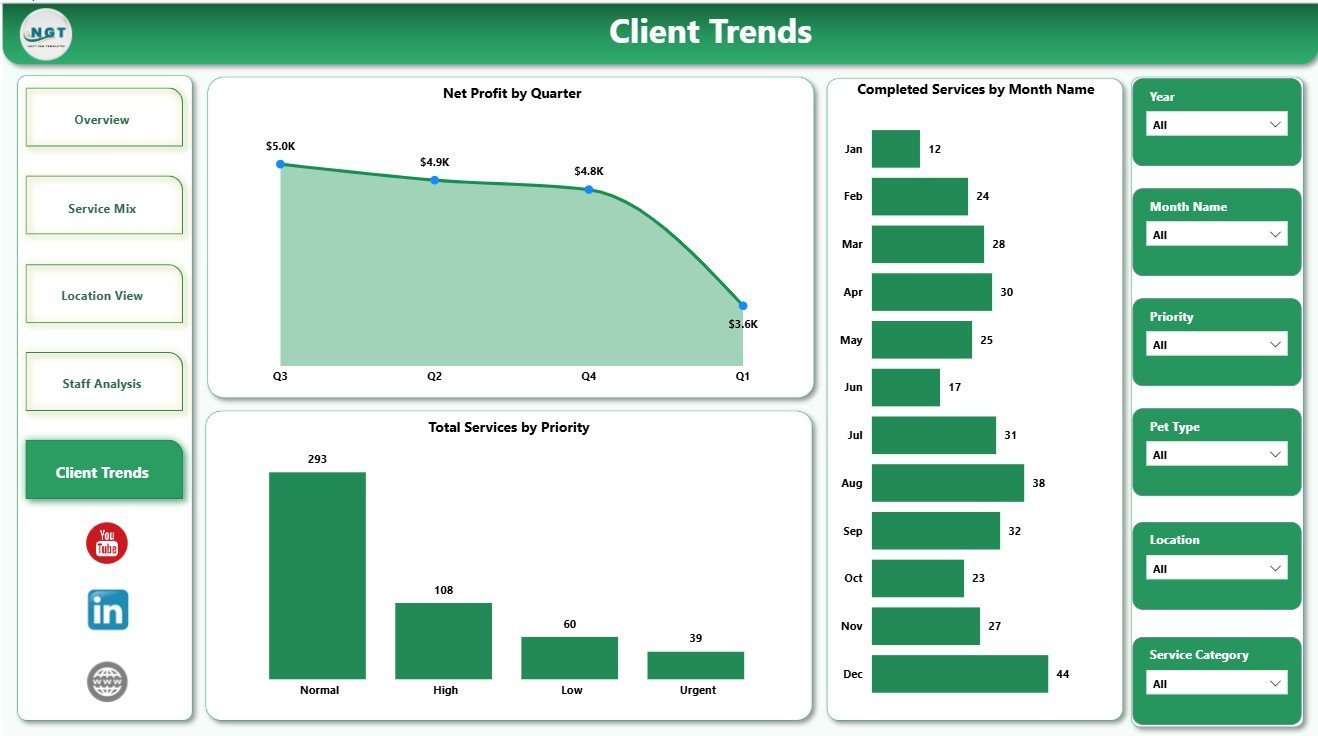
The Client Trends page supports period-over-period review. It includes Net Profit by Quarter, Completed Services by Month Name, and Total Services by Priority so owners can understand seasonality, workload urgency, and profit timing.
Client Trends
Pet Care Services Dashboard in Power BI vs. Tableau vs. Paid CRM/SaaS – Where This Fits
| Feature | This Power BI template | Tableau alternative | Paid pet care SaaS |
|---|---|---|---|
| Cost | $17.99 one-time sale price | Requires Tableau licensing and setup | Monthly or annual subscription |
| Platform | Power BI Desktop | Tableau Desktop or Cloud | Vendor-hosted web app |
| Setup time | Open the .pbix file and replace sample data/source | Build or rebuild visuals | Onboarding and configuration |
| Real-time team collaboration | Possible when published to Power BI Service | Possible with Tableau Cloud/Server | Usually included |
| Mobile access | Available through Power BI Service and mobile app | Available with paid setup | Usually included |
| Customizable fields | Editable model, measures, pages, and visuals | Editable with Tableau skills | Often plan or admin dependent |
| Share with link | Available after publishing to Power BI Service | Available with cloud/server sharing | Login controlled |
| Year-1 cost at 5 users | Template price plus your Power BI licensing choice | Often much higher licensing cost | Often hundreds or thousands |
| Pet service analytics | 5 pre-built pages for service, staff, location, and client trends | Requires custom build | Depends on reporting module |
Who This Template Is For – and Who It’s Not For
This dashboard is for pet grooming owners, boarding and daycare managers, veterinary support teams, trainers, franchise operators, and consultants who already have service records and want Power BI reporting. It is not a booking engine, POS system, payment processor, medical record system, inventory system, or customer messaging platform.
How to Use the Pet Care Services Dashboard in Power BI
- Download and unzip the product file.
- Open the .pbix file in Power BI Desktop.
- Review the sample Overview, Service Mix, Location View, Staff Analysis, and Client Trends pages.
- Replace the sample source with your own exported service data.
- Refresh the report and use slicers to filter the visuals.
- Customize colors, labels, measures, or pages if your business uses different terminology.
Real-World Use Cases
Meera, grooming salon owner: reviews net profit by service category and repeat client rate each month before deciding which services to promote.
James, daycare manager: compares completed services by location and total services by priority before adjusting staff coverage.
Priya, pet care consultant: uses Staff Analysis to compare satisfaction, repeat client rate, revenue, and cost by staff member during client review meetings.
Frequently Asked Questions
What pages are included?
The report includes Overview, Service Mix, Location View, Staff Analysis, and Client Trends pages.
What software do I need?
You need Power BI Desktop to open and edit the .pbix file. Power BI Desktop is available from Microsoft.
Can I use my own data?
Yes. Replace the sample source with your own service records, then refresh the Power BI report.
Does this include booking or billing?
No. This is an analytics dashboard template, not booking, POS, billing, or medical record software.
Can I publish it to Power BI Service?
Yes, if you have the correct Power BI account, workspace, and sharing permissions.
Can I customize the visuals?
Yes. You can edit pages, visuals, measures, labels, colors, and filters inside Power BI Desktop.
About the Author
Built by PK – Microsoft Certified Professional with 15+ years of Excel, Google Sheets, and Power BI experience. Founder of NextGenTemplates, reaching 300K+ subscribers across YouTube channels. Every template is hand-built and tested before release.
Explore Related Templates
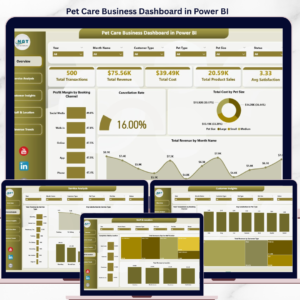
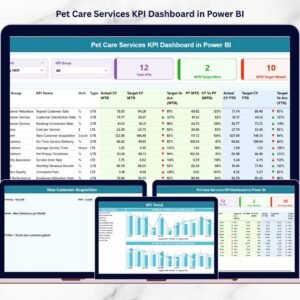
Compare this dashboard with Pet Care Services Dashboard in Excel, Pet Care Business Dashboard in Power BI, and Pet Care Services KPI Dashboard in Power BI. Browse more Power BI dashboard templates and Power BI templates.
Download the Pet Care Services Dashboard in Power BI today and turn pet service records into clearer monthly decisions.
Watch the demo video:
Compatibility and Requirements
- Works in Power BI Desktop, which is free. Microsoft explains how to get it in Get Power BI Desktop.
- The report is a .pbix file with 5 pages. Replace the sample source with your own service data, then refresh.





























Reviews
There are no reviews yet.